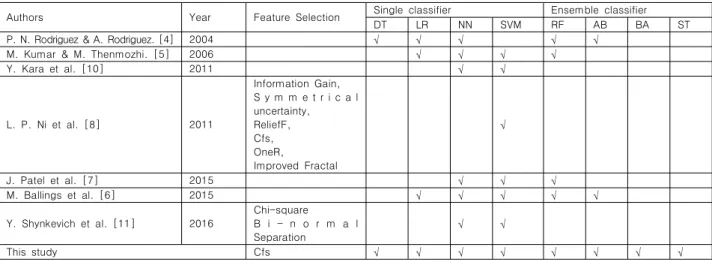
Predicting stock price direction by using data mining methods : Emphasis on comparing single classifiers and ensemble classifiers
1)
전체 글
1)
수치
관련 문서
This study investigates relationship between macroeconomic variables and stock returns using ARMA-GARCH model. Also the stability of serial data and the
Voting rights of existing shareholders of publicly traded common stock registered under Section 12 of the Exchange Act cannot be disparately reduced or
The results reveal that the market condition and the revision ratio of offer price are useful public information, which affects IPO stock performance in
8) Voting rights of existing shareholders of publicly traded common stock registered under Section 12 of the Exchange Act cannot be disparately reduced or restricted
Shiller, Comparing Welfare Effects: The Stock Market Versus the Housing Market, NBER Working
"Beyond Computation: Information Technology, Organizational Transformation and Business Practices” shows the relationship between IT stock and productivity for a large sample
1 John Owen, Justification by Faith Alone, in The Works of John Owen, ed. John Bolt, trans. Scott Clark, "Do This and Live: Christ's Active Obedience as the
Direction of a flux vector: direction of contaminant transport, normal to the frame Magnitude of a flux vector: net rate of contaminant transport per unit area of the
