https://doi.org/10.4174/astr.2018.95.5.267 Annals of Surgical Treatment and Research
Clinical outcome of 1,000 consecutive cases of liver transplantation: a single center experience
Bong Jun Kwak1, Dong Goo Kim1, Jae Hyun Han1, Ho Joong Choi1, Si Hyun Bae2, Young Kyoung You1, Jong Young Choi2, Seung Kew Yoon2
1Department of Surgery, Seoul St. Mary’s Hospital, College of Medicine, The Catholic University of Korea, Seoul, Korea
2Department of Internal Medicine, Seoul St. Mary’s Hospital, College of Medicine, The Catholic University of Korea, Seoul, Korea
INTRODUCTION
Liver transplantation (LT) is the most effective treatment for patients with end stage liver disease, acute liver failure, and some metabolic liver diseases, including hepatocellular carcinoma (HCC). The first case of LT in humans was performed in Denver, by Starzl et al. [1] in 1967. LT in Asia, including South Korea, was started in the late 1980s [2]. The first LT from a living
donor was accomplished in 1989. This has made it possible to drastically reduce graft ischemia time, although there is a risk to the donor [3]. Since the late 1980s, the number of LTs in Korea has been increasing steadily. According to statistics from the Korean Network of Organ Sharing (KONOS), there were 1,471 LTs in South Korea in 2016. Among them, there were 963 living donor LTs (LDLTs; 65.5%) and 508 deceased donor LTs (DDLTs;
34.5%). The Pittsburgh Health Center reported that the 1-year
Received January 3, 2018, Revised April 19, 2018, Accepted June 1, 2018 Corresponding Author: Dong Goo Kim
Division of Hepatobiliary-Pancreas Surgery and Liver Transplantation, Department of Surgery, Seoul St. Mary’s Hospital, College of Medicine, The Catholic University of Korea, 222, Banpo-daero, Seocho-gu, Seoul 06591, Korea
Tel: +82-2-22586102, Fax: +82-2-5952992 E-mail: [email protected]
ORCID code: https://orcid.org/0000-0002-7287-3172
Copyright ⓒ 2018, the Korean Surgical Society
cc Annals of Surgical Treatment and Research is an Open Access Journal. All articles are distributed under the terms of the Creative Commons Attribution Non- Commercial License (http://creativecommons.org/licenses/by-nc/4.0/) which permits unrestricted non-commercial use, distribution, and reproduction in any medium, provided the original work is properly cited.
Purpose: The aim of this study was to analyze survival outcomes in 1,000 consecutive liver transplantations (LTs) performed at a single institution from 1993 to April 2017.
Methods: The study population was divided into 2 groups based on donor type: deceased donor LT (DDLT; n = 181, 18.1%) and living donor LT (LDLT; n = 819; 81.9%), and into 3 periods based on the number of cases (first 300 cases, middle 300 cases, last 400 cases).
Results: Infection was the most common cause of death, accounting for 34.8% (95 of 273). Mortality due to hepatocellular carcinoma recurrence occurred most frequently between 1 and 5 years after transplantation. Mortality rate by graft rejection was highest between 5 and 10 years after transplantation. And mortality by de novo malignancy occurred most frequently after 10 years after transplantation. The patient survival rates for the entire population at 5 and 10 years were 74.7%, and 68.6%, respectively. There was no difference in survival rate between the LDLT and DDLT groups (P = 0.188).
Cause of disease, disease severity, case period, and retransplantation had a significant association with patient survival (P
= 0.002, P = 0.031, P = 0.003, and P = 0.024, respectively).
Conclusion: Surgical techniques and perioperative management for transplant patients have improved and undergone standardization. Controlling perioperative infection and managing patients with HCC as LT candidates will result in better outcomes.
[Ann Surg Treat Res 2018;95(5):267-277]
Key Words: Liver transplantation, Cause of death, Survival, Risk factors
recipient survival rate in 1985 was approximately 30% and the 5-year survival rate was approximately 20% [4]. In 2008, the US Department of Health and Human Services reported patient and graft survival rates, at 1, 5, and 10 years after DDLT, of 87%, 73%, and 59%, and 83%, 68%, and 53%, respectively [5]. Five-year survival rates > 90% have been reported in LDLT using a right liver graft [6]. These remarkably improved outcomes are due not only to the continued development of surgical techniques, but also to improvements in perioperative medical care.
The first DDLT was performed in our institution on a 30-year-old male patient, who had hepatitis B-related cirrhosis, in June 1993. The first LDLT was performed in May 1996 at our institution. The patient was a 2-year-old female who suffered from biliary atresia. She received a left lateral segment of liver from her mother. There has been a sharp increase in the number of LTs, especially LDLTs, since 2000. From June 1993 to April 2017, 1,000 LTs were performed for various types of liver diseases, including HCC. The aim of this study was to analyze the survival outcomes and causes of mortality of 1,000 LTs performed at a single institution.
METHODS
Patient status
Data on 1,000 LTs, performed in 969 patients who underwent LT from June 1993 to April 2017, were reviewed and analyzed retrospectively. Among them, there were 819 LDLTs (81.9%) and 181 DDLTs (18.1%). Fourteen pediatric recipients were <18 years of age (1.4%). Among them, primary transplantation was performed in 969 cases (96.9%) and a retransplantation was performed in 31 cases (3.1%). The study population was divided into 2 groups based on donor type (DDLT vs. LDLT), and into 3 periods based on the number of cases (period 1: first 300 cases, period 2: middle 300 cases, period 3: last 400 cases). The period 1 cases were from June 1993 to May 2006, the period 2 cases were from May 2006 to April 2011, and the period 3 cases were from April 2011 to April 2017. In DDLT, there was an event switching of venous flow reconstruction technique from classic method to Piggyback method. But there was no definite change of operative techniques and perioperative care in LDLT.
Therefore we divided the periods evenly according to case numbers.
The causes of mortality according to donor type and case period were evaluated. A survival analysis was performed according to donor type, cause of disease, disease severity, case period, and retransplantation. Operative mortality was defined as death within 30 days after surgery. The mean follow-up was 71.8 ± 59.1 months. Survival of 2 patients could not be evaluated because they were lost to follow-up. The study was reviewed and approved by the Ethics Committee of Seoul St. Mary’s Hospital, the Catholic University of Korea
(KC17RCSI0689). Patients were not required to give informed consent to the study because the analysis used anonymous clinical data that were obtained after each patient agreed to treatment by written consent.
Surgical technique
A bilateral subcostal incision with upper midline extension was used in LDLT recipients. The donor and recipient surgery were performed concurrently, to minimize cold ischemic time of the graft, and the graft vessels were not divided until the recipient was ready to receive the graft. The right lobe, without the middle hepatic vein, was resected from most donors. The procured graft was flushed with 2 L of cold (4°C) histidine- tryptophan-ketoglutarate (HTK) solution (HTK-Custodiol, Koehler Chemi, Alsbach-Haenlien, Germany) through the portal vein and hepatic artery at the back table. After all procedures were completed on the back table, the recipient portal vein and hepatic veins were resected, and the total hepatectomy was completed. The vascular anastomosis was started after controlling bleeding in the recipient operative field. End-to- side anastomosis was performed between the right hepatic vein of the donor and the right hepatic vein of the recipient in transplantations that used the modified right lobe. An end- to-end anastomosis was performed in the order of portal vein and hepatic artery. The hepatic arterial anastomosis was performed under a microscope (×10). The middle hepatic vein tributaries from segments 5 and 8 were reconstructed using an interpositioned prosthetic graft to the middle hepatic vein of the recipient. All accessory right hepatic veins over 5 mm were reconstructed to the inferior vena cava (IVC) to prevent venous congestion of the graft. Finally, duct-to-duct anastomosis was performed at the bile duct reconstruction. Otherwise, Roux- en-Y hepaticojejunostomy was performed only for patients who cannot be anastomosed by duct-to-duct method (n = 20/819, 2.4% in LDLT; n = 3/181, 1.7% in DDLT).
Most of the DDLT procedures were similar to those used for LDLT, although one difference was in the venous flow reconstruction method. Initially, the recipient IVC, from above the renal veins to the diaphragm, was totally removed. The excised retrohepatic vena cava was replaced with a donor vena caval segment using end-to-end anastomosis between the graft IVC and the recipient IVC. During the procedure, veno-venous bypass was used to decompress the splanchnic circulation and reduce bowel edema during the anhepatic phase. Since March 2008 (54th DDLT), we started hepatic venous flow reconstruction using the Piggyback technique, which was made popular in 1989 by Tzakis at al. [7]. A side-to-side anastomosis was routinely performed between the IVC segment of the graft and the IVC of the recipient.
Immune suppression
Immunosuppressive treatment included a regimen featuring a calcineurin inhibitor, cyclosporine (Sandimmun, Novartis Pharmaceuticals, Basel, Switzerland) or tacrolimus (Prograf, Astellas Pharma Inc., Tokyo, Japan) as a component of a double- or triple-drug cocktail (the other 2 drugs were prednisone and mycophenolate mofetil [Myrept, Chong Kun Dang Pharmaceutical Corp., Seoul, Korea]). An interleukin-2 receptor blocker (Simulect, Novartis Pharmaceuticals) was administered on the day of the operation and on postoperative day 4. Steroids were withdrawn 1 month after surgery, and mycophenolate mofetil was withdrawn 6 months after surgery. Only a low- dose calcineurin inhibitor was given after this time. The immunosuppressive protocol in the patients who underwent LT due to HCC did not differ from those used to treat benign diseases. When recurrence was detected during follow-up, the immunosuppressive agent was switched to everolimus (Certican, Novartis Pharmaceuticals), or a low trough level of the immunosuppressant was maintained.
Statistical analysis
Numerical data are presented as means and standard deviations. Continuous variables were analyzed using the independent t-test, one way analysis of variance, or the Kruskal- Wallis test, as appropriate. Proportions were tested using Pearson chi-square test or the Fisher exact test. A Kaplan-Meier analysis was used to calculate survival curves. Differences in survival curves were compared using log-rank statistics.
Cox proportional hazards model was used to identify factors that were independently associated with overall survival. The statistical analysis was performed using IBM SPSS Statistics ver. 19.0 (IBM Co., Armonk, NY, USA). A P-value of <0.05 was considered significant.
RESULTS
Demographic changes
The mean age of the 969 total patients was 49.9 ± 10.3 years (range, 1–75 years), and there were 695 male patients (69.5%). Cause of disease was hepatitis B in 652 patients (65.2%), hepatitis C in 60 patients (6%), alcohol use in 124 patients (12.4%), acute hepatic failure in 56 patients (5.6%), and autoimmune disease in 57 patients (5.7%). A total of 412 patients (41.2%) underwent transplantation due to a hepatic tumor. In DDLT group (n = 181), 25 patients (13%) were classified to transplantation due to other causes. The most of them (21 of 25, 84%) were retransplantation due to graft failure of primary transplanted liver. And the 2 patients underwent LT due to non-A, non-B hepatitis, 1 patient due to nonalcoholic steatohepatitis, and 1 patient due to unknown cause. Thirty-one patients underwent retransplantation. The most common cause
of retransplantation was rejection (14 of 31, 45.2%), followed by graft failure due to vascular complications (9 of 31, 29.0%) and graft failure due to biliary complications (5 of 31, 16.1%).
And other causes included primary non function and small for size syndrome. The mean Child-Turcotte-Pugh (CTP) score was 9.4 ± 2.7. The mean model for end-stage liver disease (MELD) score was 17.5 ± 10.2. The mean operation time and volume of transfusion were 562.1 ± 140.4 minutes and 12.3 ± 9.4 units, respectively. The surgical complication rate was 29.4%, and the perioperative mortality rate was 9.0%.
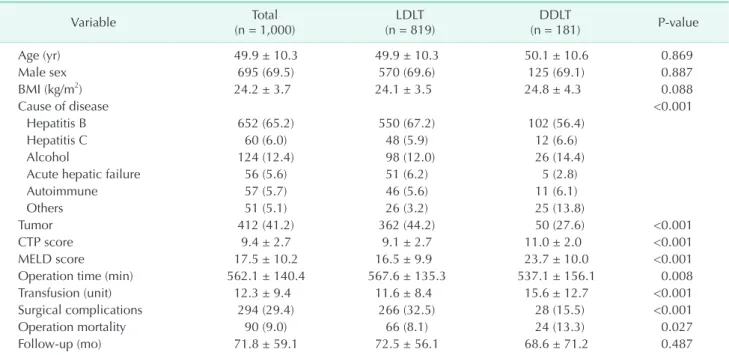
Age, sex, body mass index (BMI), and mean follow-up duration were not different between the LDLT and DDLT groups. Significantly more patients were diagnosed with a tumor in the LDLT group than in the DDLT group (P < 0.001).
The CTP score and MELD score were significantly higher in the DDLT versus LDLT group (both P < 0.001). Operation time was shorter in the DDLT versus LDLT group (P = 0.008). Otherwise, more perioperative transfusions were needed in the DDLT versus LDLT group (P < 0.001). Significantly more surgical complications occurred in the LDLT group than in the DDLT group (P < 0.001). Surgical mortality was higher in the DDLT versus LDLT group (P = 0.027) (Table 1).
Demographics according to case period were compared. Age and BMI increased significantly over time (both P < 0.001). The rate of hepatitis B decreased, while alcohol use increased, over time (both P < 0.001); the CTP score also decreased over time (P
= 0.063). The MELD score was higher in periods 2 and 3 than in period 1 (P = 0.031). The proportion of LDLTs decreased significantly over time (P < 0.001). Operative time and volume of perioperative transfusion decreased over time (both P <
0.001). The surgical complication rate (37.3%) and operative mortality were higher (12.0%) during period 1 than during the other periods. Abrupt decrease in surgical complications and operative mortality occurred during period 2 (22.3%, P < 0.001 and 7.0%, P = 0.081, respectively). The surgical complication and operative mortality rates were similar between periods 2 and 3 (Table 2).
Operative methods
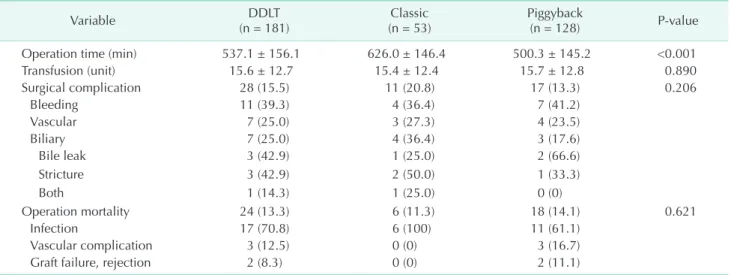
The DDLT (n = 181) group was further subdivided into 2 groups according to the venous outflow anastomosis technique.
The classic technique was used on the initial cases, up to February 2008 (n = 53); the Piggyback technique was used thereafter (n = 128). The Piggyback technique group showed significantly shorter operative times than the classic technique group (P < 0.001). Transfusions during the operation, the surgical complication rate, and the operative mortality rate were not different between the groups (P = 0.890, P = 0.206 and P = 0.621, respectively). In this study, surgical complication included events occurred only in hospital period from operation to discharge. The most common surgical complication in
the DDLT group was bleeding (11 of 28, 39.3%), and the most common cause of surgical mortality was infection (17 of 24, 70.8%). biliary complications occurred in 7 patients (3.9%).
Among them, 3 patients had bile leakage, another 3 patients had biliary stricture, and 1 patient had both. In all 7 patients, 1 patient was treated by intervention with endoscopic retrograde Table 1. Demographics according to graft type
Variable Total
(n = 1,000) LDLT
(n = 819) DDLT
(n = 181) P-value
Age (yr) 49.9 ± 10.3 49.9 ± 10.3 50.1 ± 10.6 0.869
Male sex 695 (69.5) 570 (69.6) 125 (69.1) 0.887
BMI (kg/m2) 24.2 ± 3.7 24.1 ± 3.5 24.8 ± 4.3 0.088
Cause of disease <0.001
Hepatitis B 652 (65.2) 550 (67.2) 102 (56.4)
Hepatitis C 60 (6.0) 48 (5.9) 12 (6.6)
Alcohol 124 (12.4) 98 (12.0) 26 (14.4)
Acute hepatic failure 56 (5.6) 51 (6.2) 5 (2.8)
Autoimmune 57 (5.7) 46 (5.6) 11 (6.1)
Others 51 (5.1) 26 (3.2) 25 (13.8)
Tumor 412 (41.2) 362 (44.2) 50 (27.6) <0.001
CTP score 9.4 ± 2.7 9.1 ± 2.7 11.0 ± 2.0 <0.001
MELD score 17.5 ± 10.2 16.5 ± 9.9 23.7 ± 10.0 <0.001
Operation time (min) 562.1 ± 140.4 567.6 ± 135.3 537.1 ± 156.1 0.008
Transfusion (unit) 12.3 ± 9.4 11.6 ± 8.4 15.6 ± 12.7 <0.001
Surgical complications 294 (29.4) 266 (32.5) 28 (15.5) <0.001
Operation mortality 90 (9.0) 66 (8.1) 24 (13.3) 0.027
Follow-up (mo) 71.8 ± 59.1 72.5 ± 56.1 68.6 ± 71.2 0.487
Values are presented as mean ± standard deviation or number (%).
LDLT, living donor liver transplantation; DDLT, deceased donor liver transplantation; BMI, body mass index; CTP, Child-Turcotte-Pugh;
MELD, model for end-stage liver disease.
Table 2. Demographics according to case period
Variable Period 1
(n = 300) Period 2
(n = 300) Period 3
(n = 400) P-value
Age (yr) 47.9 ± 10.1 48.9 ± 11.5 52.3 ± 9.0 <0.001
Male sex 222 (74.0) 197 (65.7) 276 (69.0) 0.082
BMI (kg/m2) 23.5 ± 3.4 23.9 ± 3.3 24.8 ± 4.0 <0.001
Cause of disease <0.001
Hepatitis B 243 (81.0) 182 (60.7) 227 (56.8)
Hepatitis C 16 (5.3) 14 (4.7) 30 (7.5)
Alcohol 17 (5.7) 38 (12.7) 69 (17.3)
Acute hepatic failure 6 (2.0) 30 (10.0) 20 (5.0)
Autoimmune 13 (4.3) 21 (7.0) 23 (5.8)
others 5 (1.7) 15 (5.0) 31 (7.8)
CTP score 9.6 ± 2.3 9.4 ± 2.6 9.2 ± 2.9 0.063
MELD score 16.1 ± 8.4 18.3 ± 10.6 17.9 ± 10.9 0.031
LDLT 250 (83.3) 273 (91.0) 296 (74.0) <0.001
Operation time (min) 651.62 ± 123.2 590.2 ± 124.3 473.8 ± 107.0 <0.001
Transfusion (unit) 14.1 ± 8.5 12.7 ± 8.8 10.6 ± 10.2 <0.001
Surgical complications 112 (37.3) 67 (22.3) 115 (28.8) <0.001
Operation mortality 36 (12.0) 21 (7.0) 33 (8.3) 0.081
Values are presented as mean ± standard deviation or number (%).
LDLT, living donor liver transplantation; DDLT, deceased donor liver transplantation; BMI, body mass index; CTP, Child-Turcotte-Pugh;
MELD, model for end-stage liver disease.
Period 1: from June 1993 to May 2006; period 2: from May 2006 to April 2011; period 3: from April 2011 to April 2017.
cholangio-pancreatography (ERCP), and 3 patients were treated by intervention with percutaneous transhepatic biliary drainage (PTBD). Two patients were treated by conservative care. And 1 patient underwent reoperation by bile peritonitis (Table 3).
The LDLT (n = 819) group was further subdivided into 3 groups according to the time intervals previously described in Table 2. Operative time and volume of perioperative transfusion decreased over time (both P < 0.001). The surgical complication rate in period 1 (40.8%) was higher than that in the other periods (P < 0.001). Among the surgical complications, bleeding decreased over time (P < 0.001). No significant differences were observed in any other complications
according to period. Operative mortality in period 1 (12.0%) was highest among the three periods (P = 0.023). Mortality due to vascular complications tended to decrease over time. No significant differences in mortality were observed due to other causes according to the period. The most common surgical complication in the LDLT group was a biliary complication (149 of 819, 56.0%). Among them, 116 patients (77.9%) had bile leakage, another 23 patients (15.4%) had biliary stricture, and 10 patients (6.7%) had both. In all 149 patients, 51 patients were treated by intervention with ERCP, and 26 patients were treated by intervention with PTBD. Drain catheter insertion was done in 5 patients. And 67 patients were treated by conservative care.
Table 3. Demographics according to operative methods: DDLT
Variable DDLT
(n = 181) Classic
(n = 53) Piggyback
(n = 128) P-value
Operation time (min) 537.1 ± 156.1 626.0 ± 146.4 500.3 ± 145.2 <0.001
Transfusion (unit) 15.6 ± 12.7 15.4 ± 12.4 15.7 ± 12.8 0.890
Surgical complication 28 (15.5) 11 (20.8) 17 (13.3) 0.206
Bleeding 11 (39.3) 4 (36.4) 7 (41.2)
Vascular 7 (25.0) 3 (27.3) 4 (23.5)
Biliary 7 (25.0) 4 (36.4) 3 (17.6)
Bile leak 3 (42.9) 1 (25.0) 2 (66.6)
Stricture 3 (42.9) 2 (50.0) 1 (33.3)
Both 1 (14.3) 1 (25.0) 0 (0)
Operation mortality 24 (13.3) 6 (11.3) 18 (14.1) 0.621
Infection 17 (70.8) 6 (100) 11 (61.1)
Vascular complication 3 (12.5) 0 (0) 3 (16.7)
Graft failure, rejection 2 (8.3) 0 (0) 2 (11.1)
Values are presented as mean ± standard deviation or number (%).
DDLT, deceased donor liver transplantation.
Classic: up to February 2008; Piggyback: from March 2008.
Table 4. Demographics according to case period: LDLT
Variable LDLT
(n = 819) Period 1
(n = 250) Period 2
(n = 273) Period 3
(n = 296) P-value Operation time (min) 567.6 ± 135.3 658.7 ± 117.8 591.1 ± 116.2 468.9 ± 96.1 <0.001
Transfusion (unit) 11.6 ± 8.4 14.0 ± 7.5 12.4 ± 8.7 8.9 ± 8.1 <0.001
Surgical complication 266 (32.5) 102 (40.8) 65 (23.8) 99 (33.4) <0.001
Bleeding 76 (28.6) 44 (43.1) 16 (24.6) 16 (16.1)
Vascular 38 (14.3) 14 (13.7) 8 (12.3) 16 (16.1)
Biliary 149 (56.0) 44 (43.1) 39 (60.0) 66 (66.7)
Bile leak 116 (77.9) 29 (65.9) 30 (76.9) 57 (86.4)
Stricture 23 (15.4) 8 (18.2) 7 (17.9) 8 (12.1)
Both 10 (6.7) 7 (15.9) 2 (5.1) 1 (1.5)
Operation mortality 66 (8.1) 30 (12.0) 18 (6.6) 18 (6.1) 0.023
Infection 32 (48.5) 13 (43.3) 9 (50.0) 10 (55.6)
Vascular complication 16 (24.2) 10 (33.3) 5 (27.8) 1 (5.6)
Graft failure, rejection 8 (12.1) 4 (13.3) 1 (5.6) 3 (16.7)
Values are presented as mean ± standard deviation or number (%).
LDLT, living donor liver transplantation.
Period 1: from June 1993 to May 2006; Period 2: from May 2006 to April 2011; Period 3: from April 2011 to April 2017.
The most common cause of surgical mortality was infection (32
of 66, 48.5%) (Table 4).
Causes of mortality
A total of 273 patients (27.3%) died during the follow-up period. The causes of mortality according to various factors are
Table 5. Cause of mortality according to graft type
Cause of mortality Total
(n = 273) LDLT
(n = 218) DDLT
(n = 55) P-value
Infection 95 (34.8) 66 (30.3) 29 (52.7) 0.002
Peumonia 44 (46.3) 29 (43.9) 15 (51.7)
Biliary sepsis 9 (9.5) 7 (10.6) 2 (6.9)
Others 42 (44.2) 30 (45.5) 12 (41.4)
HCC recurrence 50 (18.3) 49 (22.5) 1 (1.8) <0.001
Graft failure, rejection 41 (15.0) 34 (15.6) 7 (12.7) 0.595
Vascular complication 36 (13.2) 29 (13.3) 7 (12.7) 0.910
De novo malignancy 14 (5.1) 9 (4.1) 5 (9.1) 0.136
Others 37 (13.6) 31 (14.2) 6 (10.9) 0.521
Values are presented as number (%).
LDLT, living donor liver transplantation; DDLT, deceased donor liver transplantation; HCC, hepatocellular carcinoma.
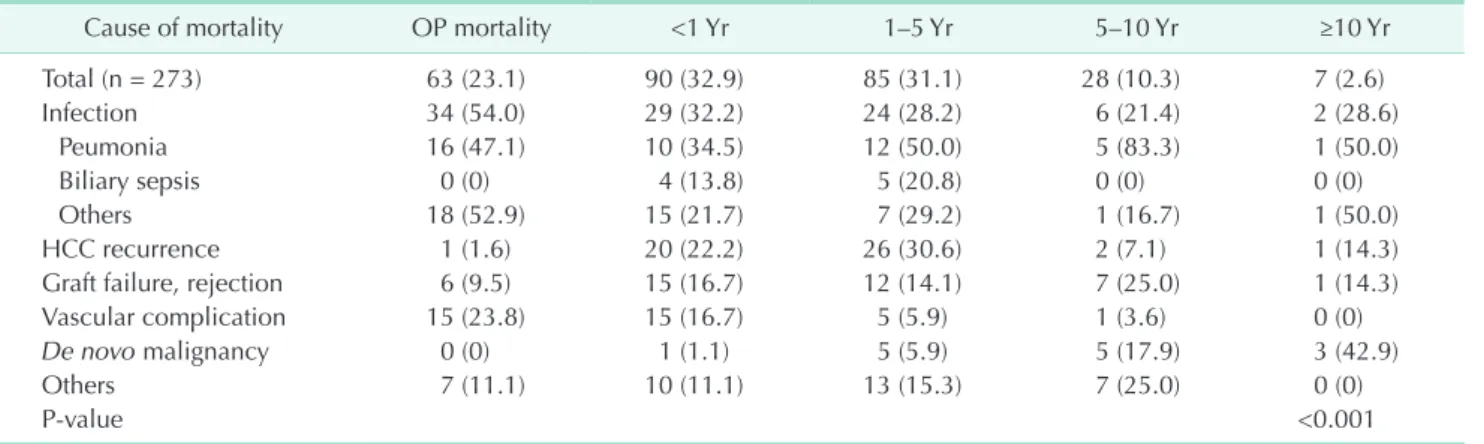
Table 6. Cause of mortality according to survival period
Cause of mortality OP mortality <1 Yr 1–5 Yr 5–10 Yr ≥10 Yr
Total (n = 273) 63 (23.1) 90 (32.9) 85 (31.1) 28 (10.3) 7 (2.6)
Infection 34 (54.0) 29 (32.2) 24 (28.2) 6 (21.4) 2 (28.6)
Peumonia 16 (47.1) 10 (34.5) 12 (50.0) 5 (83.3) 1 (50.0)
Biliary sepsis 0 (0) 4 (13.8) 5 (20.8) 0 (0) 0 (0)
Others 18 (52.9) 15 (21.7) 7 (29.2) 1 (16.7) 1 (50.0)
HCC recurrence 1 (1.6) 20 (22.2) 26 (30.6) 2 (7.1) 1 (14.3)
Graft failure, rejection 6 (9.5) 15 (16.7) 12 (14.1) 7 (25.0) 1 (14.3)
Vascular complication 15 (23.8) 15 (16.7) 5 (5.9) 1 (3.6) 0 (0)
De novo malignancy 0 (0) 1 (1.1) 5 (5.9) 5 (17.9) 3 (42.9)
Others 7 (11.1) 10 (11.1) 13 (15.3) 7 (25.0) 0 (0)
P-value <0.001
Values are presented as number (%).
OP, operation; HCC, hepatocellular carcinoma.
Table 7. Cause of mortality according to case period
Cause of mortality Period 1
(n = 300) Period 2
(n = 300) Period 3
(n = 400) P-value
Total (n = 273) 115 (42.1) 71 (26.0) 87 (31.9) <0.001
Infection 37 (32.2) 23 (32.4) 35 (40.2) 0.437
Peumonia 16 (43.2) 11 (47.8) 17 (48.6)
Biliary sepsis 8 (21.6) 1 (4.3) 0 (0)
Others 13 (35.1) 11 (47.8) 18 (51.4)
HCC recurrence 22 (19.1) 7 (9.9) 21 (24.1) 0.067
Graft failure, rejection 17 (14.8) 14 (19.7) 10 (11.5) 0.355
Vascular complication 20 (17.4) 9 (12.7) 7 (8.0) 0.151
De novo malignancy 7 (6.1) 5 (7.0) 2 (2.3) 0.337
Others 12 (10.4) 13 (18.3) 12 (13.8) 0.313
Values are presented as number (%).
HCC, hepatocellular carcinoma.
Period 1: from June 1993 to May 2006; period 2: from May 2006 to April 2011; period 3: from April 2011 to April 2017.
shown in Tables 5–7. Infection was the most common cause of death, representing 34.8% (95 of 273) of all deaths. This was followed by recurrent HCC (18.3%), graft failure (15.0%), and vascular complications (13.2%). Among all infection related deaths, pneumonia was most common (44 of 95, 46.3%).
Deaths by biliary sepsis occurred only in 9 patients (9 of 95, 9.5%). Significantly more infection-related deaths occurred in the DDLT group than in the LDLT group (P = 0.002). Most deaths related to HCC recurrence occurred in the LDLT group (P < 0.001) (Table 5). Among all deaths (n = 273), 56.0% (153 of 273) occurred within 1 year after transplantation, and 87.1%
(238 of 273) occurred within 5 years after transplantation.
Infection was the most common cause of death within 1 year after transplantation. Mortality due to a vascular complications occurred mainly during the perioperative period. Mortality due to HCC recurrence occurred most frequently between 1 and 5 years after transplantation. The rate of mortality due to graft failure was highest between 5 and 10 years after transplantation. Mortality due to de novo malignancy occurred most frequently 10 years after transplantation (Table 6). Causes of death according to case period were also evaluated. Infection was the most common cause of death during all case periods (Table 7).
Survival analysis
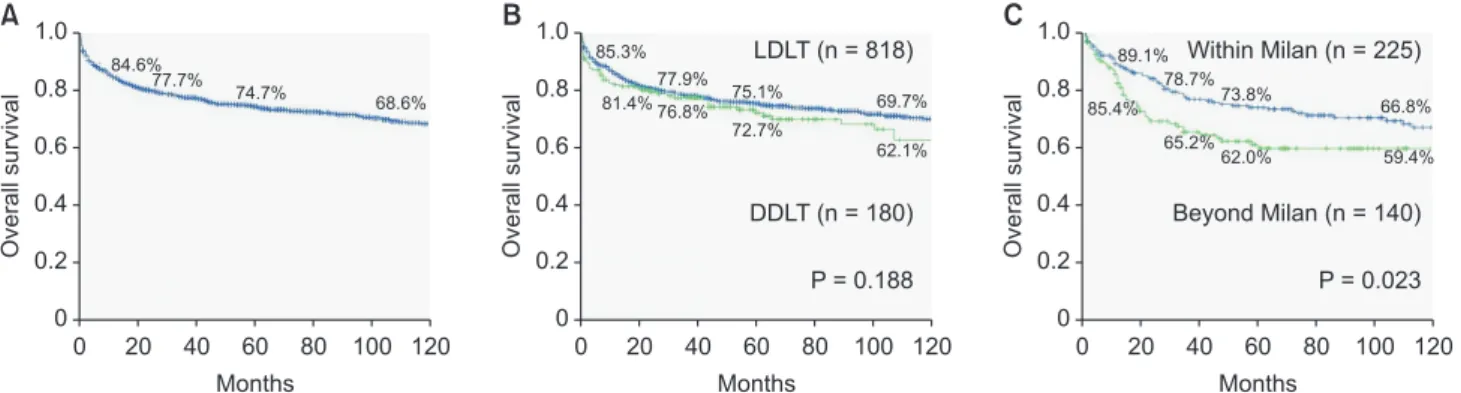
The patient survival rates for the entire population (n = 998) at 1, 3, 5, and 10 years were 84.6%, 77.7%, 74.7%, and 68.6%, respectively (Fig. 1A). Little difference was found in the survival rate between the LDLT and DDLT groups (P = 0.188). The 1-, 3-, 5-, and 10-year survival rates were 85.3%, 77.9%, 75.1%, and 69.7%
for the LDLT group and 81.4%, 76.8%, 72.7%, and 62.1% for the DDLT group (Fig. 1B). LTs due to tumor were 411 cases. Among them, we could find reports of exact size and numbers of HCC in 365 patients by pathologic review. 225 patients (61.6%) were within Milan criteria, and 140 patients (38.4%) were beyond Milan criteria. We analyzed overall survival according to Milan
criteria. The patients within Milan criteria showed significant better survival rate than patients beyond Milan criteria (P = 0.023) (Fig. 1C).
We analyzed patient survival according to various factors.
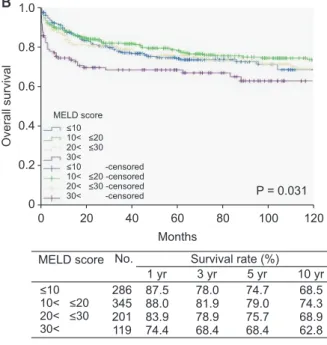
Cause of disease (P = 0.002) (Fig. 2A), disease severity according to the MELD score (P = 0.031) (Fig. 2B), case period (P = 0.003) (Fig. 2C), and retransplantation (P = 0.024) (Fig. 2D) were significantly associated with patient survival. Survival rate by cause of disease is shown in Fig. 2A. Cause of disease was classified into 6 categories: hepatitis B; hepatitis C; alcohol;
fulminant hepatitis; autoimmune liver diseases, including primary biliary cirrhosis, primary sclerosing cholangitis, and autoimmune hepatitis; and tumors; a significant difference in survival rate was noted by category (P = 0.002): patients with hepatitis B showed the best survival rate among all cause of disease categories. Patients with tumors showed relatively poorer survival than those with other kinds of disease. Among 998 cases, survival rates at 1, 5, and 10 years of patients with tumors (n = 411) were significantly worse than those of patients without tumors (n = 587) (84.1%, 68.4%, and 60.9%
vs. 84.9%, 79.1%, and 73.8%, respectively) (P < 0.001) (Fig. 2A).
In the survival analysis according to disease severity, patients were split into 4 groups: MELD score of ≤ 10 (n = 287), 10–20 (n = 346), 20–30 (n = 201), or >30 (n = 119). Patients with MELD scores > 30 demonstrated significantly worse survival than those with a MELD score of ≤ 10 (P = 0.032) or 10–20 (P
= 0.004) (Fig. 2B). Case period showed a significant association with overall survival (P = 0.003). The survival rate between periods 2 and 3 was similar. However, the survival rate during period 3 was significantly better than that during period 1 (period 1 vs. period 2, P = 0.086; period 1 vs. period 3, P = 0.034; period 2 vs. period 3, P = 0.454) (Fig. 2C). The survival rate of re-transplantation at 1, 5, and 10 years was significantly worse than that of patients who underwent primary transplantation (P = 0.024) (Fig. 2D).
We performed multivariate analysis using the Cox regression
1.0
0.8
0.6
0.4
survivalOverall 0.2
0
0 20 40 60 80 100 120
A 1.0
0.8
0.6
0.4
survivalOverall 0.2
0
0 20 40 60 80 100 120 1.0 C
0.8
0.6
0.4
survivalOverall 0.2
0
0 20 40 60 80 100 120
B
Months Months Months
LDLT (n = 818)
DDLT (n = 180)
P = 0.188
Within Milan (n = 225)
Beyond Milan (n = 140)
P = 0.023 84.6%
77.7%
74.7%
68.6%
85.3%
81.4%
77.9%
76.8%
75.1%
72.7%
69.7%
62.1%
89.1%
78.7%
73.8%
66.8%
85.4%
65.2%
62.0% 59.4%
Fig. 1. Overall survival analysis of 1,000 liver transplantations; overall survival in all cases (A), overall survival according to graft type (B) and overall survival in patients with hepatocellular carcinoma according to Milan criteria (C). LDLT, living donor liver transplantation; DDLT, deceased donor liver transplantation.
proportional hazard model to identify risk factors for overall survival in the 1,000 LTs. In multivariate analysis, cause of disease (P < 0.001), MELD score (P < 0.001), case period (P = 0.004) were independent prognostic factors in the 1,000 LTs.
Otherwise re-LT was not (P = 0.221) (Table 8).
DISCUSSION
We analyzed the survival outcomes of 1,000 LTs performed at a single institution. The results illustrate the evolution of the LT program at our center over the 24 years since its inception in 1993. Although the number of LTs performed annually was nearly 10 in the 1990s, there was an abrupt increase in
the number of LTs, and especially LDLTs, since 2000; we reached a total of 1,000 cases in 2017. Similar to the situation in other Asian countries, LDLTs have been more frequently performed than DDLTs. Continued efforts have been made to improve social awareness regarding organ donation. As a result, according to statistics from the KONOS, the proportion of DDLTs has increased gradually, reaching 34% in 2016 [8]. In our institution, the proportion of DDLTs has also increased over the past several years.
The longer operation time and 2 fold higher surgical complication rate for LDLT versus DDLT may be related to anatomical characteristics, whereby the diameters of vessels and biliary structure at the anastomosis site were smaller in
1.0
0.8
0.6
0.4
0.2
Overallsurvival
0
0 20 40 60 80 100 120
A
Months
P = 0.002 Cause of disease
HBV HCV Alcohol Fulminant Autoimmune Tumor Others HBV-censored HCV-censored Alcohol-censored Fulminant-censored Autoimmune-censored Tumor-censored Others-censored
Cause of disease HBV HCV Alcohol Fulminant Autoimmune Tumor Others
No. Survival rate (%) 1 yr 3 yr 5 yr 10 yr 318
28 104
55 49 411
33 86.1 89.3 87.3 76.3 79.6 85.6 84.8
83.7 73.4 86.2 74.4 75.4 71.8 77.4
81.9 68.1 80.2 72.3 75.4 68.3 72.5
79.8 59.6 65.1 72.3 54.3 60.8 56.0
1.0
0.8
0.6
0.4
0.2
Overallsurvival
0
0 20 40 60 80 100 120
B
Months
P = 0.031 MELD score
MELD score No. Survival rate (%)
286 345 201 119
87.5 88.0 83.9 74.4
78.0 81.9 78.9 68.4
74.7 79.0 75.7 68.4
68.5 74.3 68.9 62.8
<10 10< <20 20< <30 30<
<10 -censored
10< <20 -censored 20< <30 -censored
30< -censored
<10 10< <20 20< <30 30<
1 yr 3 yr 5 yr 10 yr
1.0
0.8
0.6
0.4
0.2
Overallsurvival
0
0 20 40 60 80 100 120
C
Months
P = 0.003
1.0
0.8
0.6
0.4
0.2
Overallsurvival
0
0 20 40 60 80 100 120
D
Months
P = 0.024 87.2%
79.4%
75.8%
82.4%
76.7%
74.5%
67.9%
72.1%
65.1%
60.5%
58.1%
Period 3 (n = 399) Period 2 (n = 300) Period 1 (n = 299)
85.1%
78.2%
75.2%
69.1%
67.6%
63.8%
59.6% 53.6%
1st LT (n = 967)
Re-LT (n = 31)
Fig. 2. Overall survival analysis of the 1,000 liver transplantations (LTs); causes of diseases (A), disease severity (B), case period (C), and primary versus retransplantation (D). Period 1: from June 1993 to May 2006; period 2: from May 2006 to April 2011;
period 3: from April 2011 to April 2017.
living versus deceased donor grafts, so more meticulous and advanced surgical skills are needed for LDLT. The greater number of perioperative transfusions and higher operative mortality rate in the DDLT group may be associated with higher disease severity (higher CTP and MELD scores) versus the LDLT group. As the number of cases increased, age and BMI also increased, showing that the number of LT candidates has been increasing. The volume of transfusion, surgical complications, and operative mortality rates have decreased as the number of cases has increased, likely due to advances in surgical skill and perioperative management [9].
The DDLT Piggyback technique was associated with a significantly shorter operation time than that of classic anastomosis, because of the lack of a veno-venous bypass procedure and improvements in surgical skill over time.
Operation time tended to decrease over time in both the DDLT and LDLT groups. Transfusions, surgical complications, and operative mortality tended to improve more significantly over time in the LDLT versus DDLT group, supporting the notion that technical improvements were apparently more pronounced for LDLT. It has also been proposed that LDLT requires a more sophisticated technique due to the anatomical characteristics [10,11].
In this study, 273 of the 969 total patients died during the follow-up period. Survival data of only 2 patients could not be evaluated because of loss to follow-up due to emigration. The most common cause of mortality was infection. Other large studies with long-term follow-up also reported that infection was a major cause of death [12,13]. Infection was the major cause of death in all survival periods after transplant (21.4%–
54.0%) in our study. Furthermore, it was the most common cause of death in all case periods (26.0%–42.1%). Therefore, controlling infection is an important challenge to improve survival in LT, especially DDLT [14]. In addition, over half of the cases of operative mortality (54.0%) were due to infection.
Therefore, infection control has a more important role during perioperative period than during other periods. Mortality rate due to recurrence of HCC was significantly higher for patients who underwent LDLT versus those who underwent DDLT, which may be related to a higher proportion of tumors in the LDLT versus DDLT group.
The patient survival rates for the entire population at 5 and 10 years were 74.7% and 68.6%, respectively. These results are comparable with those reported by the largest volume LT centers, although the study populations differed [9,15]. Patients with hepatitis B had the best survival rates among all causes of disease, which can be explained by the effective antiviral agents used for hepatitis B prophylaxis. Combining prophylaxis with antiviral agent and hepatitis B immune globulins can prevent recurrence of hepatitis B following LT [16]. In the present study, the 5-year survival rate for patients who underwent LT due to a tumor was 68.3%, which was comparable with outcomes at other institutions [17-19]. Otherwise, patients with tumors showed relatively poorer survival than those with other kinds of disease in this study. The most common cause of mortality in this group was tumor recurrence (n = 49, 36.6%). This may be the result of applying expanded criteria beyond the Milan criteria in our center, as in many other institutions. Among our cases, 35% of our patients underwent LT due to a tumor, which was beyond the Milan criteria. Applying expanded Table 8. Risk factors for overall survival (OS) in the 1,000 liver transplantations by multivariate analysis using the Cox regression proportional hazard model
Risk factor Univariate analysis of OS Multivariate analysis of OS
HR 95% CI P-value HR 95% CI P-value
Cause of disease 0.003 <0.001
HBV 1 1
HCV 1.921 0.984–3.749 0.056 3.002 1.507–5.982 0.002
Alcohol 1.294 0.803–2.087 0.290 1.422 0.844–2.398 0.186
Fulminant 1.644 0.936–2.886 0.083 1.627 0.901–2.938 0.107
Autoimmune 1.838 1.062–3.180 0.030 2.015 1.088–3.732 0.026
Tumor 1.855 1.376–2.500 <0.001 2.622 1.853–3.710 <0.001
Others 1.853 0.951–3.610 0.070 2.017 0.985–4.129 0.055
MELD score 0.048 <0.001
Case period 0.013 0.004
Period 1 1 1
Period 2 0.640 0.473–0.865 0.004 0.578 0.417–0.801 0.001
Period 3 0.823 0.614–1.103 0.192 0.738 0.536–1.017 0.064
Retransplantation 0.040 0.221
HR, Hazard ratio; CI, confidence interval; MELD, model for end-stage liver disease.
criteria, especially for LDLT, has been widely performed [18-20].
Otherwise, some studies reported unsatisfactory results [21,22].
Therefore, the optimal criteria for LT in patients with HCC are still uncertain; more studies and discussion are needed.
Disease severity according to the MELD score was associated with long-term survival. In particular, patients with a MELD score > 30 showed significantly poorer survival than other patients. The relationship between pretransplant MELD score and posttransplant patient survival is controversial. However, many studies have reported poorer survival with a higher MELD score [23-25]. Survival during period 3 was significantly better than that during period 1 in this study (P = 0.034).
Perioperative mortality, defined as death within 30 days after surgery, also tended to be lower in period 3 than period 1 (P
= 0.100), indicating that surgical techniques and perioperative management for transplant patients have improved and undergone standardization since 1993. As a result, the learning curve for LT has been overcome and survival has
been improved. Survival of retransplant patients showed a steep decrease within 1 year. This result was associated with emergent transplants due to sudden deterioration, such as vascular complications or acute rejection after primary transplantation. It may also be related to the technical difficulty of retransplantation compared to primary transplantation.
In conclusion, surgical techniques and perioperative management for transplant patients have improved and become standardized. As a result, the learning curve for LT has been overcome and survival rates have improved. Perioperative infection control and management of patients with HCC will continue to play important roles in improving outcomes.
CONFLICTS OF INTEREST
No potential conflict of interest relevant to this article was reported.
REFERENCES
1. Starzl TE, Groth CG, Brettschneider L, Penn I, Fulginiti VA, Moon JB, et al.
Ortho topic homotransplantation of the human liver. Ann Surg 1968;168:392-415.
2. Lee KU, Kim SB, Kim SH, Lee HJ, Suh KS, Kim ST. Liver transplantation in Seoul National University Hospital. Transplant Proc 2002;34:2799-800.
3. Strong RW, Lynch SV, Ong TH, Matsunami H, Koido Y, Balderson GA. Successful liver transplantation from a living donor to her son. N Engl J Med 1990;322:1505-7.
4. Iwatsuki S, Shaw BW, Starzl TE. Five- year survival after liver transplantation.
Transplant Proc 1985;17:259-63.
5. Berg CL, Steffick DE, Edwards EB, Heim- bach JK, Magee JC, Washburn WK, et al.
Liver and intestine transplantation in the United States 1998-2007. Am J Trans plant 2009;9(4 Pt 2):907-31.
6. Yi NJ, Suh KS, Suh SW, Chang YR, Hong G, Yoo T, et al. Excellent outcome in 238 con se cutive living donor liver trans- plantations using the right liver graft in a large volume single center. World J Surg 2013;37:1419-29.
7. Tzakis A, Todo S, Starzl TE. Orthotopic
liver transplantation with preservation of the inferior vena cava. Ann Surg 1989;210:
649-52.
8. Korea Centers for Disease Control &
Prevention. 2016 Konos Annual Report [Internet]. Seoul (Korea): Korea Centers for Disease Control & Prevention, Korean Network for Organ Sharing; c2014 [cited 2017 Sep 10]. Available from: https://www.
konos.go.kr/konosis/index.jsp.
9. Salizzoni M, Cerutti E, Romagnoli R, Lupo F, Franchello A, Zamboni F, et al. The first one thousand liver transplants in Turin: a single-center experience in Italy. Transpl Int 2005;18:1328-35.
10. Lee SG. A complete treatment of adult living donor liver transplantation: a re- view of surgical technique and current challenges to expand indication of pa- tients. Am J Transplant 2015;15:17-38.
11. Polak WG, Peeters PM, Slooff MJ. The evolution of surgical techniques in cli- nical liver transplantation. A review. Clin Transplant 2009;23:546-64.
12. Jain A, Reyes J, Kashyap R, Dodson SF, Demetris AJ, Ruppert K, et al. Long-term survival after liver transplantation in
4,000 consecutive patients at a single center. Ann Surg 2000;232:490-500.
13. Schoening WN, Buescher N, Rademacher S, Andreou A, Kuehn S, Neuhaus R, et al.
Twenty-year longitudinal follow-up after orthotopic liver transplantation: a single- center experience of 313 consecutive cases. Am J Transplant 2013;13:2384-94.
14. Lee JS, Lee SH, Kim KS, Gil EM, Choi GS, Kim JM, et al. Bacterial infection mo- ni toring in the early period after liver transplantation. Ann Surg Treat Res 2018;
94:154-8.
15. Chan SC, Cheung TT, Chan AC, Chok KS, Sharr WW, Fung JY, et al. New insights after the first 1000 liver transplantations at The University of Hong Kong. Asian J Surg 2016;39:202-10.
16. Markowitz JS, Martin P, Conrad AJ, Markmann JF, Seu P, Yersiz H, et al. Pro- phylaxis against hepatitis B recurrence following liver transplantation using combination lamivudine and hepatitis B immune globulin. Hepatology 1998;28:
585-9.
17. Mazzaferro V, Regalia E, Doci R, Andreola S, Pulvirenti A, Bozzetti F, et al. Liver
trans plantation for the treatment of small hepa tocellular carcinomas in patients with cirrhosis. N Engl J Med 1996;334:
693-9.
18. Tamura S, Sugawara Y, Kokudo N. Section 4. Further expanding the criteria for HCC in living donor liver transplantation:
the Tokyo University experience. Trans- plantation 2014;97 Suppl 8:S17-20.
19. Yao FY. Liver transplantation for hepa- tocellular carcinoma: beyond the Milan criteria. Am J Transplant 2008;8:1982-9.
20. Yao FY, Ferrell L, Bass NM, Watson JJ, Bacchetti P, Venook A, et al. Liver trans- plantation for hepatocellular car cinoma:
expansion of the tumor size limits does
not adversely impact survival. Hepa tology 2001;33:1394-403.
21. Decaens T, Roudot-Thoraval F, Hadni- Bresson S, Meyer C, Gugenheim J, Durand F, et al. Impact of UCSF criteria according to pre- and post-OLT tumor features: an- aly sis of 479 patients listed for HCC with a short waiting time. Liver Transpl 2006;
12:1761-9.
22. Todo S, Furukawa H; Japanese Study Group on Organ Transplantation. Living donor liver transplantation for adult patients with hepatocellular car cinoma:
experience in Japan. Ann Surg 2004;
240:451-9.
23. Freeman RB, Harper A, Edwards EB.
Excellent liver transplant survival rates under the MELD/PELD system. Trans- plant Proc 2005;37:585-8.
24. R a n a A , H a rdy M A , H a l a zu n K J, Woodland DC, Ratner LE, Samstein B, et al. Survival outcomes following liver trans plantation (SOFT) score: a novel method to predict patient survival fol- lowing liver transplantation. Am J Trans- plant 2008;8:2537-46.
25. Cholongitas E, Marelli L, Shusang V, Senzolo M, Rolles K, Patch D, et al. A systematic review of the performance of the model for end-stage liver disease (MELD) in the setting of liver trans- plantation. Liver Transpl 2006;12:1049-61.