Copyright@2014 by The Korean Society of Safety (pISSN 1738-3803) All right reserved. http://dx.doi.org/10.14346/JKOSOS.2014.29.1.001
유무선 네트워크기반 지하철역사 공기질 제어의 위험성 평가
최 기 흥
한성대학교 기계시스템공학과 (2013. 9. 26. 접수 / 2014. 2. 14. 채택)
Assessment of Risk in Wireless-Wired Network Based Control of Indoor Air Quality (IAQ) in Subway Stations
Gi Heung Choi
Department Mechanical Systems Engineering, Hansung University
(Received September 26, 2013 / Accepted February 14, 2014)Abstract : With increasing number of citizen using subway stations everyday, safety, health and comfort of passengers and occupants became an important social issue. Considering the fact that various physical variables and pollutants are related to indoor air quality (IAQ) which may cause health problem, IAQ need to be closely monitored and controlled in multiple locations in subway stations. This study is a continuation of the previous studies and delay induced in wireless-wired network is experimentally evaluated and the risk involved is assessed. In doing that, a key parameter is identified to be the network delay in different network media. Application of information-theoretic measure to assess the risk in network delay is then discussed. The idea is based on the general principles of engineering design and their applications to quantification of uncertainty in network delay. Experimental results show that more risk is involved in wireless data communication. Efficient and fast conversion of transmission data in both LonWorks/IP server and ZL converter is also noted.
Key Words : in-door air quality (IAQ); safety; health; wireless network; wired network; risk assessment
†
Corresponding Author : Gi Heung Choi, Tel : +82-760-4322-mail : gihchoi@hansung.ac.kr
1. INTRODUCTION
In terms of ensuring the safety, health and comfort of passengers and occupants (mostly metro personnel) in the subway stations, IAQ can be defined as the physical, chemical and biological properties that indoor air must have in order not to cause or aggravate the illness of passengers and occupants, and to secure high level of safety, health and comfort to the passengers and the occupants in the performance of the designated activities for which the station has been intended and designed
1)
. In subway stations intensive and customized information has to be provided to operators and also to passengers. Performance of wireless monitoring and control of IAQ in subway stations was evaluated in the previous studies1,2,3)
. Specifically, a basic framework for wireless sensor network using LonWorks/IP Gateway/Web server was suggested to better perform monitoring and control of IAQ. In view of safety, health and comfort management in “Virtual Device Network (VDN)”environment, a method to guarantee interoperability between devices was also suggested.
This study is a continuation of the previous studies and
delay induced in wireless-wired network is experimentally evaluated and the risk involved is assessed. In doing that, a key parameter is identified for performance evaluation of different network media. Application of information-theoretic measure to assess the risk in network delay is then discussed. The idea is based on the general principles of engineering design and their applications to quantification of uncertainty in network delay. Experimental results are given to assess the risk involved in both local device network and VDN configurations.
2. FRAMEWORK FOR WIRELESS SENSOR NETWORK
The important factors affecting IAQ in subway stations are identified as particulate matters (PM), CO, NO2
, ozone, VOCs (Volatile Organic Compounds), radon, electromagnetic fields, chemical agent, and environmental tobacco smoke (ETS) and biological agents4)
. In the previous study, the average values of particulate (PM10
) were measured at multiple locations in several subway stations5,6)
. Particulate in indoor air appears, as expected, to be denser than in outdoor air. Tunnel and platform are the weakest locationsfor the health of passenger. The results suggest that improving IAQ of subway station needs multiple measurements and monitoring in multiple locations. In order to make subway station more comfortable, ventilation methods must also be upgraded in tunnels and platforms.
These issues imply that large amount of data need to be collected and processed effectively in the field. Real-time feedback on the conditions of pollutant sources, indoor/outdoor air quality and activities in the stations as well as device, equipment and facilities is also required for efficient management of IAQ.
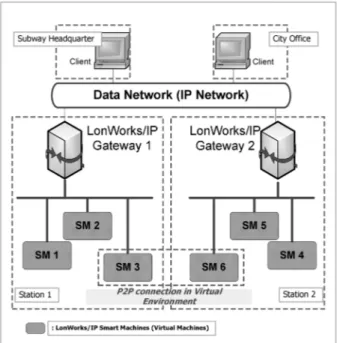
Recent trends require that access to the device/equipment information be provided from several locations in the subway stations or anywhere in the city. By connecting device network into IP network, multiple sites/locations can be simply integrated into a seamless VDN. VDN includes one or more remote sites connected with one or more monitoring/control applications located on the Internet. The general architecture of a VDN is shown in Fig. 1. One example is virtual machine (VM) or smart machine (SM), which utilizes the virtual device network (VDN). In this configuration, monitoring and control IAQ, safety and health management and predictive maintenance, for example, can be performed both in the subway stations and in remote site through internet.
Considering the fact that physical properties, pollutants are closely monitored and controlled in multiple locations in the subway station, concept of distributed monitoring andcontrol network such as LonWorks network technology
Fig. 1. VDN based service system realized in distributed server-client environment using LonWorks/IP Gateway/Web server.
needs to be implemented for several reasons
2,3)
.The suggested framework was designed to deal with twisted pair (TP) communication media such as LonWorks and wireless media such as Zigbee. Zigbee was particularly suggested for ease of installation. Simple tests, however, showed that electromagnetic interference due to power line of the train especially when the train moves along the platform severely degrades the real-time transmission performance of the wireless media. In that case, twisted pair communication media must be used. Zigbee to LonWorks (ZL) converter transforms wireless communication data into network variable (NV) data, then transmitted through LonWorks network. Any data must be transmitted to other devices in the LonWorks network or other client through LonWorks/IP server in the form of NV. The values of NV can then be monitored in real time.
3. EXPERIMENT
A simple networking test in a laboratory was performed to assess the transmission characteristics of wireless communication using Zigbee modules under busy and hostile environment. The sensor node was set to generate the sensing data every 10sec. Each sensor node was composed of sensor module linked to a Zigbee wireless communication module so that the node transmits the sensor readings to the receiver node which is ZL converter. Fig.2 shows the composition of each sensor node. Data rate for wireless network, LonWorks network and IP network were set to 9600bps, 78kbps and more than 1Mbps, respectively. These data rates were far beyond the bandwidth of sensor signal. The transmission power of 2.4GHz Zigbee module was 1mW.
Four sets of network configuration were used to test thedelay in networks.
Fig. 2. An example of sensor node constructed using CO2 sensor,
sensor module and Zigbee wireless communication module.
Set 1: Simple local wired network configuration. The wired
network was composed of Lonwork I/O devices as shown in Fig.3. In this configuration, only LonWorks network was used between sensor node (“toggle” in Fig.3) and the destination node (“destination” in Fig.3) as the reference.Set 2: Virtual network interface (VNI) configuration using
the LonWorks/IP web server in Fig.3. In this configuration, local LonWorks network was connected to LonWorks/IP server (“webserver-0” in Fig.3). LonWorks/IP packet then transmitted to other LonWorks/IP server (“webserver-1” in Fig.3) which in turn passes the packet data to destination device bound to it. The network interface in this case is called “the virtual network interface (VNI)” in virtual device network (VDN) environment. Any client on the IP network can access to the local network and monitor the sensor data in remote site.Set 3: In this networking as shown in Fig.4, the sensor
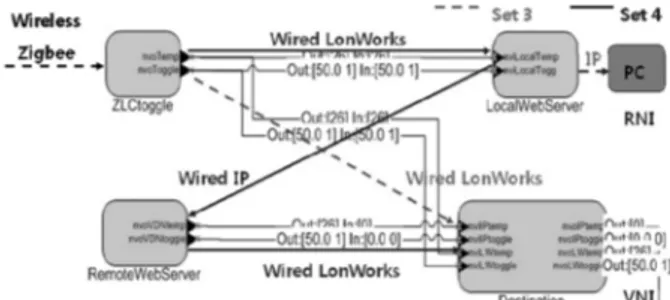
data were gathered in local sensor node which is connected to local Zigbee node, transmitted to ZL converter (“ZLCtoggle” in Fig.4) through wireless media and only LonWorks network was used between ZL converter and the destination node (“destination” in Fig.4) as the reference.Set 4: In this VDN environment in Fig.4, the wireless
device network was composed of LonWorks/IP web server, I/O devices, Zigbee to LonWorks protocol converter. The sensor data were gathered in local sensor node which is connected to local Zigbee node, and transmitted to ZL converter through wireless media and then to LonWorks/IP server (“LocalWebServer” in Fig.4). LonWorks/IP packet then transmitted to other LonWorks/IP server (“RemoteWebServer” in Fig.4) which in turn passes the packet data to destination I/O device bound to it. Destination devices in all cases actuate the HVAC facilities to control IAQ. Any client on the IP network can access to the local network and monitor the sensor data in remote site.4. EVALUATION OF NETWORK DELAY
1Hz pulse input was used to test the time delay in eachFig. 3. Network configuration of LonWorks/IP virtual device network in network Set 1 and Set 2.
Fig. 4. Network configuration of LonWorks/IP virtual device network in network Set 3 and Set 4.
network set. The output signals in destination device in four network sets were measured in oscilloscope. Fig.5 shows such outputs for network Set 1 and Set 2. The first signal is the original input signal input to the sensor node for tests.
Second signal is the one measured at the destination device directly connected to sensor node in Set 1. The last signal was measured at the destination device when it was connected to the remote LonWorks/IP server in Set 2.
Similarly, Fig.6 shows such outputs for network Set 3 and Set 4. The first signal is the original input signal for tests.
Second signal is the one received by ZL converter. Third
Fig. 5. Network delay in Set 1 (2
ndsignal) and Set 2 (3
rdsignal).
The first signal is the original input pulse signal and the second one is the signal received by the destination LonWork device.
Fig. 6. Network delay in Set 3 (3
rdsignal) and Set 4 (4
thsignal).
The first signal is the original input pulse signal and the second
one is the signal received by ZL converter
signal is the one measured at the destination device directly connected to ZL converter in Set 3. The last signal was measured at the destination device when it was connected to the remote LonWorks/IP server in Set 4. A thousand pulse input signals were generated and their delays were measured.
Fig.7 shows the histogram of the delay of received signals in Set 1 and Set 2. The transmission delay in wired media appears to be within a wide range of 13~263ms. For Set 1, delay of 13~26ms were measured, where as 48~263ms were for Set 2. Additional delay of 22 to 250ms in Set 2 was due to delay in IP network and data processing in LonWorks/IP server including network variable mapping.
It is interesting to note, however, that the measured delay is widely and evenly spread over the 30 to 250 ms range in Set 2 where the sensor data of discrete nature were transmitted.
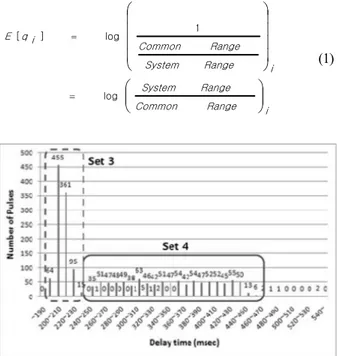
In Fig.8, the transmission delay in wireless media appears to be within a narrow range of 150~160ms. Fig.9 shows the histogram of the delay of received signals in Set 3 and Set 4. For Set 3, delay of 190~240ms were measured, where as 230~530ms were for Set 4. Additional delay of up to 340ms
Fig. 7. Network delay in transmission of data in network Set 1 and Set 2.
Fig. 8. Network delay in transmission of data through wireless media.
in Set 4 was due to delay in IP network and data processing in LonWorks/IP server. Again, the measured delay is widely and evenly spread over the 240 to 430 ms range in Set 4 where the sensor data of discrete nature were transmitted.
Comparing the results in Set 1 and Set 3, one can estimate the time delay induced by wireless media to be minimum of 164ms to maximum of 227ms. Similarly, comparing the results in Set 2 and Set 4 gives the estimated delay of up to 482ms by wireless media. These results reasonably agree with the data in Fig.8 and Fig.9. Comparing the results in Set 1 and Set 4 gives the estimated delay of up to 517ms when the signal pass through both wireless media and the IP network. More significant delay is noticed when both wireless and IP media are used for data transmission.
Delay in transmitting the IP packet in Fig.9, however, appears to be minimal and does not surpass that in local LonWorks network in relatively short distance within a city and data conversion appears to consume more time
2,3)
. Such distribution in Fig.9, therefore, indicates that attention needs to be paid to efficient and fast conversion of transmission data in both ZL converter and LonWorks/IP server.5. ASSESSMENT OF RISKS IN NETWORK DELAY
Levels of safety, health and comfort related to indoor air quality in subway stations can be evaluated using the concept of information-theoretic measure7)
. The information content associated with a particular safety, health and comfort requirement i is defined by:Range i Common
Range System
Range i System
Range Common
q i E
⎟⎟ ⎠
⎜⎜ ⎞
⎝
⎛
⎟ ⎟
⎟ ⎟
⎠
⎞
⎜ ⎜
⎜ ⎜
⎝
⎛
=
=
log log 1 ]
[
(1)
Fig. 9. Network delay in transmission of data in network Set 3
and Set 4.
Information content is a measure of the probability of success of achieving the specified requirements in comfort process in subway station or a measure of uncertainty in ensuring safety, health and comfort in subway station.
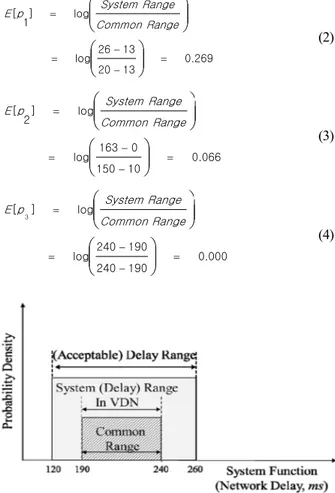
Similar concept may be applied to assessment of risk in network delay involved in control of IAQ. In order to assess the risk in network delay, either a local device network (wired or wireless as in Set 1 or Set 3) or a single VDN (with wired or wireless device network as in Set 2 or Set 4) can be used. System functions (or system parameters) for network delay management are used as system requirements for assessment of risk. Fig.10 shows such a case where a single system requirement (duration of network delay) is used for assessment of uncertainty in the network, hence the risk involved. The systems operation range may, however, differ by adding the IP network to the local device network.
When a single system requirement is used to assess the risk in network delay in sequence, the uncertainty must be taken into account separately.
The acceptable range of network delay for monitoring and control of IAQ in subway station is, in general, limited by both the upper bound and the lower bound. If the network delay increases beyond the upper bound, for example, uncertainty increases beyond this value. Lower bound may be applied to avoid communication traffic overload on the system.
The actual range of delay for a local device network (LonWorks network) in Set 1 is estimated to be 13 to 26ms, Fig.10, and 0ms to 163ms for IP network, Fig.11. For ease of interpretation, data conversion time in LonWorks/IP servers in both transmitting and receiving networks is assumed to be fixed to 100ms in this study. From this observation, it is reasonable to assume that the design range (or the acceptable range of delay) for a local device network (LonWorks network) is 10ms to 20ms, whereas the design range for IP network to be 10~150ms. The design range for VDN configuration overall in Set 4 where the delay in dataconversion is taken into account in the process then becomes 120~260ms.
In order to account more precisely the risks of network
Fig. 10. Probability distribution as a function of network delay for a local device (LonWorks) network.
Fig. 11. Probability distribution as a function of network delay for a LonWorks/IP network.
the delay in both the local device network and IP network, total uncertainties were evaluated separately, where the values were 0.269 in Eq.(2) and 0.066 in Eq.(3), respectively. The total uncertainty or total risk is simply the sum of both values
1)
and calculated to be 0.335. The uncertainty in the wired VDN configuration was also estimated for comparison purpose, where the value was 0.0 in Eq.(4), Fig.12. Zero uncertainty implies no risk in using wired VDN for control of IAQ.269 . 0 13
20 13 log 26 log 1 ]
[
− =
= −
=
⎟⎟⎠
⎜⎜ ⎞
⎝
⎛
⎟⎟⎠
⎜⎜ ⎞
⎝
⎛
Range Common
Range System p
E
(2)
066 . 0 10
150 0 log 163
log 2]
[
− =
= −
=
⎟⎟⎠
⎜⎜ ⎞
⎝
⎛
⎟⎟⎠
⎜⎜ ⎞
⎝
⎛
Range Common
Range System p
E
(3)
000 . 0 190
240 190 log 240
log ]
[
3
− =
= −
=
⎟⎟ ⎠
⎜⎜ ⎞
⎝
⎛
⎟⎟ ⎠
⎜⎜ ⎞
⎝
⎛
Range Common
Range System p
E
(4)
Fig. 12. Probability distribution as a function of network delay for
a VDN.
Fig. 13. Probability distribution as a function of network delay for a VDN where a local wireless network (Zigbee network) is used in addition to LonWorks network.
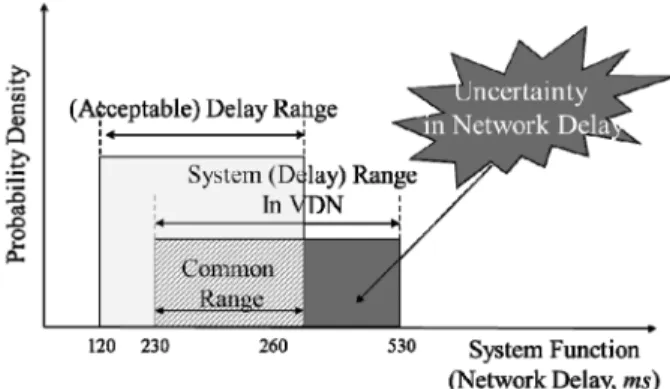
For wireless network configuration in Set 4, separate estimate of network delay is not necessary since the delay in wireless network was estimated to be a narrow range between 150ms and 160ms. It is assumed to be constant, which does not affect the assessment of risks involved in the both LonWorks network and IP network in Set 4. It, however, affects the assessment of risk in the overall VDN configuration. Data conversion time in LonWorks/IP server is again assumed to be fixed to 100ms, acceptable range of network delay in wireless VDN to be 120~260ms. The total uncertainty is calculated to be 1.0 in Eq.(5), which indicates that more uncertainty or more risk is involved in wireless configuration, Fig.13.
0 . 1 230
260 230 log 530
log ]
[ 4
− =
= −
=
⎟⎟ ⎠
⎜⎜ ⎞
⎝
⎛
⎟⎟ ⎠
⎜⎜ ⎞
⎝
⎛
Range Common
Range System p
E
(5)
6. CONCLUSION
A basic framework to assess the risk involved in wired-wireless network based control of IAQ in subway station was suggested. A key parameter was identified to be the network delay in different network media. Application of information-theoretic measure to assess the risk in network delay was then discussed. The idea is based on the general principles of engineering design and their applications to quantification of uncertainty in network delay. In particular, delay induced in wireless-wired network was experimentally evaluated and the risk involved was assessed subsequently.
In order to account more precisely the risks of network the delay in both the local device network and IP network, total uncertainties were evaluated separately. The total risk in this case was 0.335, whereas the uncertainty in the wired VDN configuration was 0.0 which implies no risk in control of IAQ. Attention, however, needs to be paid to efficient and fast conversion of transmission data in LonWorks/IP server. As expected, more risk is involved in wireless data communication in both local network and VDN configurations. Efficient and fast conversion of transmission data in ZL converter is again noted.
Acknowledgement: This research was supported by Hansung
University.References
1) G. H. Choi, “Assessment of Indoor Air Quality(IAQ), Comfort and Safety in Metro Subway Stations”, Int. J. Safety, Vol.7, No.1, pp.39-43, 2008.
2) G. H. Choi, G. S. Choi and J. H. Jang, “Performance Evaluation of Wireless Sensor Network in Web-based Monitoring and Control of Indoor Air Quality (IAQ) in Subway Stations”, Proc. of Asia Pacific Symposium on Safety, pp.119~124, 2009.
3) G. H. Choi, “Performance Evaluation of Wireless and Wired Networks for Monitoring and Control of Indoor Air Quality (IAQ) in Subway Stations”, J. of the Korean Society of Safety, Vol.27, No.1, pp.1-6, 2012 .
4) Ben Bronsema, et al, “Performance Criteria of Buildings for
Health and Comfort”, Report of ISIAQ-CIB, Task Group
TG42, 2004.5) H. W. Lee, J.-k. Park, N.-S. Jang, H.-R. Lee and H. -M. Kim,
“Analysis of Ambient Air Quality Level in Subway Area in Busan Metropolitan City”, J. Environmental Science, Vol. 2, pp. 207-215, 2003.
6) J.-W. Chang, J. -J. Cho, W. -G. Choi, D.-S. Park, W. -S. Jung and T. -O. Kim, “A Study of PM-10 and Heavy Metal Characteristics in the Air at the Each Site of Subway Station”,
J. Environmental Science, Vol.4, pp.125-129, (in Korean),
2005.7) Nam P. Suh, “The Principles of Design”, Oxford University