1)1. 서 론
1.1. 연구의 배경 및 목적
미세먼지는 현재 우리나라 환경문제 중 가장 큰 이슈 로 받아들여지고 있다. 미세먼지는 호흡계, 순환계 및 알 레르기 질환을 유발하는 등 건강에 부정적인 영향을 미 치는 것으로 알려져 있다(Choe and Lee, 2015; Hong, 2019; Oh et al., 2019). 2013년 세계보건기구(WHO) 산
하의 국제암연구소(IARC)는 미세먼지를 사람에게 암을 유발하는 것으로 확인된 1군 발암물질로 지정한 바 있다.
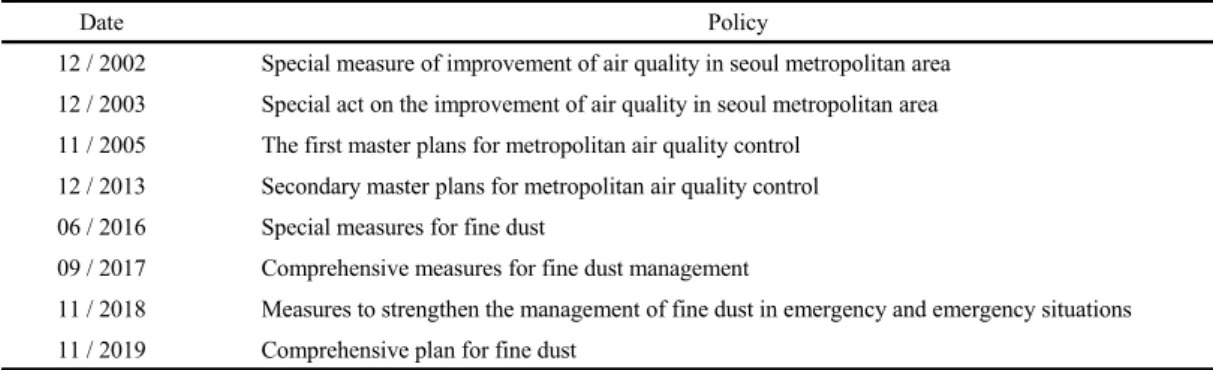
국민적 관심과 우려가 빠르게 증가하는 미세먼지 문 제를 해결하기 위해 정부와 지방자치단체에서는 다양한 저감대책을 발표해 왔다(Table 1 참조). 2019년에 발표 된 미세먼지 관리 종합계획에서는 초미세먼지(PM2.5) 연 평균 농도의 2016년 대비 35% 이상 절감을 목표로 설정 하여, 배출총량제 전국 확대, 석탄발전 미세먼지 저감,
Received 6 January, 2020; Revised 14 March, 2020;
Accepted 1 April, 2020
*Corresponding author: Hyungkyoo Kim, Department of Urban Design and Planning, Hongik University, Seoul 04066, Korea Phone : 82-2-320-1635
E-mail : [email protected]
ⓒ The Korean Environmental Sciences Society. All rights reserved.
This is an Open-Access article distributed under the terms of the Creative Commons Attribution Non-Commercial License (http://
creativecommons.org/licenses/by-nc/3.0) which permits unrestricted non-commercial use, distribution, and reproduction in any medium, provided the original work is properly cited.
ORIGINAL ARTICLE
도시의 산업특성이 미세먼지 농도에 미치는 영향
음정인 김형규*
홍익대학교 도시공학과
The Impacts of Industrial Characteristics of Cities on Fine Dust Levels
Jeongin Eum, Hyungkyoo Kim*
Department of Urban Design and Planning, Hongik University, Seoul 04066, Korea
Abstract
Fine dust is one of the most critical environmental issues in Korea, and the government recognizes the need to establish customized reduction policies based on regional characteristics. Several studies on air pollutants investigate whether factories affect the distribution of fine dust in a particular region. However, understanding the impact of the entire industry sector requires further investigation. This study identifies the impacts of industrial characteristics on fine dust levels of 141 municipalities across Korea in 2016. A total of 23 variables were used, of which 12 referred to industries and 11 to general characteristics of each city. Due to the high correlation between independent variables, partial least squares (PLS) regression models were used. The analysis identified 14 significant variables for PM10 and 13 for PM2.5. Therefore, the results suggest that local industrial characteristics can significantly influence fine dust levels and provide suggestions for establishing customized reduction policies based on local characteristics.
Key words : Fine dust, PM10, PM2.5, Industrial characteristic, Partial least squares regression
미세먼지 고농도 계절관리제 도입 등의 사업을 계획하였 다. 현재 정부에서 발표하는 대책은 대부분 전국적인 방 식으로 마련되고 있고, 동시에 지역별 특성에 따른 맞춤 형 감축정책의 수립 필요성을 인식하고 있다. 그러나 현 재 종합적인 대책과 대응전략을 세우지 못한 지방자치단 체가 다수 존재한다(Ministry of Environment, 2018).
미세먼지(PM10)는 공기 중 고체상태 입자와 액체상태 입자의 혼합물로서, 배출, 화학반응 또는 자연발생에 의 해 생성되며 사업장 연소, 자동차 연료 연소, 생물성 연소 과정 등 특정 배출원으로부터 직접 발생하기도 한다. 초 미세먼지(PM2.5)의 경우 상당량이 황산화물(SOx), 질소 산화물(NOx), 암모니아(NH3), 휘발성 유기화합물(VOCs) 등의 전구물질이 대기에서 특정한 조건반응을 겪으면서 2 차로 생성된다(Korea Environment Corporation Air Korea, 2017).
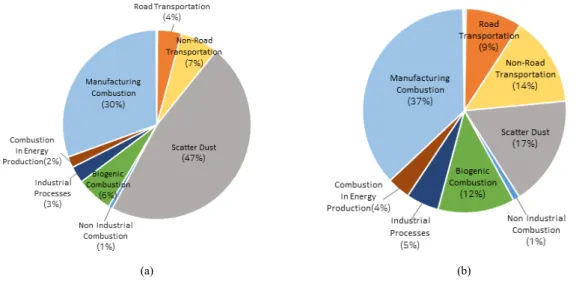
미세먼지를 포함한 총 9개의 대기오염물질을 대상 으로 대기정책지원시스템(Clean Air Policy Support System, CAPSS)을 통해 국가 대기오염물질의 배출량 을 산정한다. CAPSS는 대기오염물질 배출목록에 근거 한 대기관리 종합시스템으로, 정책수행에 필요한 양질의 정보를 제공한다. CAPSS 배출원 분류체계는 유럽의 CORINAIR 배출원 분류체계를 기초로 국내 현실에 맞 추어 변경하여 사용되고 있으며, 배출원을 에너지 산업 연소, 비산업 연소, 제조업 연소, 생산공정, 에너지 수송 및 저장, 유기용제 사용, 도로, 비도로, 폐기물처리, 농업 활동, 기타 면오염원, 비산먼지, 생물성 연소의 13개 대 분류로 분류하고 있다(National Institute of Environ -mental Research, 2018). 2015년 기준 국가 대기오염 물질 배출량 중 미세먼지(PM10), 초미세먼지(PM2.5) 배
출량에서 제조업을 포함한 다양한 산업분야가 많은 비중 을 차지하고 있다(Fig. 1 참조). 제조업이 지역의 미세먼 지 분포에 미치는 영향에 대한 연구는 다수 존재하나, 도 시의 전반적인 주요 산업과 관련된 연구는 찾기 어렵다.
이러한 배경 하에 본 연구는 2016년 전국 141개 시 ․ 군 ․ 구를 대상으로 도시 주요 산업특성의 영향이 미세먼지 농도에 미치는 영향을 규명한다. 전통적인 다중회귀분 석 시 발생할 수 있는 다중공선성 및 표본 수 문제를 해 결하기 위해 PLS (Partial Least Squares) 회귀분석을 사용한다.
1.2. 선행연구 검토
산업이 미세먼지에 미치는 영향과 관련된 연구는 다 양하게 존재한다. 최근 산업단지를 중심으로 주변의 미 세먼지 분포를 분석하고 그에 따른 미세먼지 저감방안을 구축하는 연구가 진행되고 있다. Moon et al.(2011)은 전국 산업단지 공급계획이 대기환경에 미치는 영향을 검 토하여 대기환경 차원에서 산업단지 공급계획의 적정성 을 확인하고 개선방안을 제시하였다. Ryu and Lee (2016)는 산업단지에 인접한 도시를 중심으로 산업단지 에서 배출되는 미세먼지(PM10)의 확산 특성을 고찰하고, 이를 통해 향후 산업단지 배후지 개발에 있어 대기오염 물질에 의한 영향을 최소화하기 위한 도시계획 방향을 제시하였다. Moon et al.(2017)은 주요 국가 산업단지로 인한 대기질 영향과 건강영향 평가를 조기사망자 수를 통해 분석하였으며 산업단지 운영으로 인한 영향을 도출 하고 미세먼지 저감방안 검토의 필요성을 제시하였다.
동시에, 건축물 수 및 건폐율과 같은 도시 물리적 요 소, 토지이용 및 교통량 등 도시의 일반적 특성이 미세먼지
Date Policy
12 / 2002 Special measure of improvement of air quality in seoul metropolitan area 12 / 2003 Special act on the improvement of air quality in seoul metropolitan area 11 / 2005 The first master plans for metropolitan air quality control
12 / 2013 Secondary master plans for metropolitan air quality control 06 / 2016 Special measures for fine dust
09 / 2017 Comprehensive measures for fine dust management
11 / 2018 Measures to strengthen the management of fine dust in emergency and emergency situations 11 / 2019 Comprehensive plan for fine dust
Table 1. Fine dust policies
분포에 영향을 주는지에 대한 연구가 진행되고 있다 (Table 2 참조). Jeong and Lee(2018)는 서울시 지역별 측정소 주변 토지이용의 특성과 면적차이에 따라 미세먼 지 측정값의 공간분포가 다르게 나타나는 경향을 분석하 였다. Yoon(2019)은 수도권 근린생활권 단위 기준에서 미세먼지(PM10) 농도에 영향을 미치는 도시 공간특성 요 인들을 도출하였다. Maeng(2014)은 이산화질소, 이산
화황, 미세먼지(PM10)와 도시특성 간의 상관성 연구를 진행해 산업업종별 관리의 필요성을 제시하였다.
지역적 특성에 따라 미세먼지의 공간적 분포를 조사 한 연구도 다수 존재한다. Kim et al.(2018)은 1990년부 터 2016년까지의 전국 및 7개 권역의 미세먼지 농도특 성을 분석해 2000년 이후 일부 지역에서의 두드러진 증 가추세를 확인하였다. Jang et al.(2012)은 장기 관측
Authors Urban characteristics
Jeong and Lee(2018) Area, ratio by land use type (residential, commercial, public, transportation, inland water, broadleaf forest, coniferous forest, artificial grassland, etc.)
Hong et al.(2007) Number of floating population, number of businesses, area of land use (residential, commercial, green, transportation facilities), transportation facilities, building coverage area, number of intersections
Oh and Chung(2007)
Population (total population, households), employment (Number of businesses, workers), land use area (residential, commercial, industrial), number of buildings (residential, commercial, industrial), transportation (automobile registration)
Park et al.(2017) Number by vehicle type, vehicle registration by year compared to the previous year
Yoon(2019)
Land-use characteristics (residential, commercial, industrial, agricultural, forest, etc.); urban spatial structure (number of buildings, average building area, average building coverage ratio, average floor area ratio, number of intersections), environmental pollution-causing facilities
Maeng(2014)
Population characteristics variables (population, population density), traffic characteristics variables (density by road, car density), land and housing characteristics (land characteristics by population, area by region, density by housing type), industrial characteristics (density by specific manufacturing industries) Table 2. Previous studies on urban characteristics
(a) (b)
Fig. 1. 2015 national air pollutants emission. (a) PM10, (b) PM2.5
자료를 바탕으로 한반도 10개 도시에서 미세먼지의 변동 특징을 시공간적 발생주기를 분석해 지역별로 미세먼지 의 발생주기가 다르게 나타남을 발견했으며, 미세먼지 발생주기에 관한 정보가 지역적으로 특화된 대기오염 물 질의 관리 및 통제 시스템을 수립하는데 주요한 역할을 할 것으로 판단하였다. Lee(2019)는 공간을 도시와 농 촌, 산업단지, 주거지역 등 5개 권역으로 나눠 오염원 데 이터를 분석하고 권역별 미세먼지 저감 대책을 제시하였 다.
발생특성 분야에서는 특정지역의 미세먼지 배출원 및 토지이용에 따른 발생 경향을 분석하는 연구가 활발히 이루어지고 있다. Kim(2013)은 금속관련 산업시설이 밀 집되어있는 공업시설과 상가들이 밀집된 상업지역의 토 양시료를 채취해 화학적 분석을 행한 후, 주인자분석을 통해 각 지역에 대한 미세먼지(PM10)와 초미세먼지 (PM2.5)의 주된 영향요인을 제시하였다. Kang and Lee(2015)은 충주지역에 영향을 미치는 초미세먼지 (PM2.5)에 대한 배출원 기여도 추정을 사계절에 대해 연 구하였다. Seo et al.(2014)은 왕십리 상업지역의 식당가 를 중심으로 초미세먼지(PM2.5)의 분포특성을 분석해 상 업지역에서 배출되는 초미세먼지(PM2.5)의 발생 경향을 파악하였다.
여러 산업 분야 중 제조업의 미세먼지 배출에 주목해 그에 따른 문제와 해결방안을 제시한 연구를 비롯하여 미세먼지와 산업과의 관계를 분석한 연구는 다수 존재한 다. 그러나 도시의 산업특성에 따른 미세먼지 영향에 대 한 연구는 부족한 상황이다. 더불어 대다수의 선행연구 에서 다중회귀분석을 사용하고 있다. 이와 달리 본 연구 는 도시의 주요 산업특성이 미치는 영향을 규명하고, 통 계적 한계를 극복하는 분석 기법을 사용한다는 점에서 차별성을 갖는다.
2. 재료 및 방법
2.1. 변수설정
본 연구의 종속변수인 미세먼지 농도는 미세먼지 (PM10)와 초미세먼지(PM2.5)로 설정한다. 미세먼지는 직경에 따라 구분하며, 미세먼지(PM10)는 1000분의 10 mm보다 작은 먼지이고, 초미세먼지(PM2.5)는 1000분의 2.5 mm보다 작은 경우에 해당한다. 관련 데이터는 한국
환경공단 에어코리아의 최종확정 측정자료에서 확보하 였다. 대기측정소는 전국 160개 시‧군‧구에 총 302개소가 존재한다. 한 도시에 다수의 측정소가 있는 경우 평균값 을 해당 도시의 미세먼지 값으로 설정하였다.
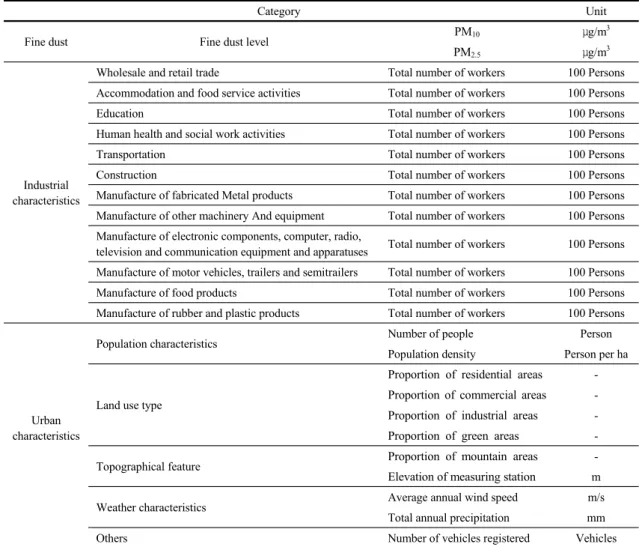
독립변수로는 도시의 산업특성과 관련된 변수 12개, 도시의 일반적 특성과 관련된 변수 11개 등 총 23개를 설정하였다(Table 3 참조). 산업특성 변수는 우리나라에 서 가장 비중이 큰 12개 산업의 도시별 산업별 종사자수 로 구성하였다. 12개 산업은 통계청 9차 한국표준산업분 류의 6개 대분류 산업과 6개의 중분류 산업으로 이루어 진다. 통계청의 2015년 경제총조사를 기준으로 종사자 수가 가장 많은 서비스업 5개 업종(도매 및 소매업, 숙박 및 음식점업, 교육서비스업, 보건 및 사회복지서비스업, 운수업), 건설업, 종사자 수가 가장 많은 제조업 6개 업종 (금속가공제품 제조업, 기타 기계 및 장비 제조업, 전자 부품‧컴퓨터‧영상‧음향 및 통신장비 제조업, 자동차 및 트 레일러 제조업, 식료품 제조업, 고무제품 및 플라스틱 제 조업)이 해당된다.
통제변수로는 인구 수, 인구밀도, 토지이용 비율, 산 지비율, 측정소의 해발고도, 풍속 및 강수량, 차량등록대 수와 같이 선행연구에서 미세먼지 농도에 유의미한 영향 이 존재하는 것으로 확인된 다양한 도시특성으로 설정한 다(Handerson et al., 2007; Oh and Chung, 2007;
Rossa et al., 2007; Lee et al., 2015). 인구 및 인구밀도 와 토지이용 비율은 이미 많은 선행연구에서 미세먼지 농도에 유의미한 영향이 있는 것으로 확인된 바 있다. 산 지비율과 측정소의 해발고도는 지리 및 지형적 요인에 따른 미세먼지 농도의 변화를 고려하기 위해 설정하였다.
관련 데이터는 산림청에서 제공하는 산지통계와 에어코 리아의 측정소 정보 및 국토지리정보원의 수치표고모델 을 가공해 직접 구성하였다. 기상변수는 기상 변화에 따 른 미세먼지 농도의 변화를 통제하기 위해 연간 평균풍 속과 합계강수량을 사용하였으며, 기상자료개방포털의 종관기상관측 자료와 방재기상관측 자료를 활용하였다.
차량등록대수의 경우 도시별 교통량을 반영하기 위한 변 수에 해당하고, 관련 데이터는 통계청에서 확보하였다.
이외에도 유동인구, 건폐면적, 건축물 수 등과 같은 변수 도 유의미한 것으로 알려져 있으나, 전국 단위에서의 분 석이 어렵다는 점을 고려하여 제외하였다.
2.2. 연구범위
본 연구의 공간적 범위는 미세먼지 농도 및 기상변수 데이터가 존재하는 전국 141개 시 ․ 군 ․ 구로 설정하였다.
필요한 모든 데이터가 존재하는 시기 중 가장 최근인 2016년의 자료를 사용하였다. 또한, 중국 등 인접 국가 로부터 유입되는 미세먼지의 영향을 배제하기 위해 겨울 철 북서풍이 부는 기간과 봄철 황사 기간을 분석에서 제 외하였다.
2.3. 연구방법
우선, 상관분석을 이용하여 도시의 산업특성 및 도시 특성 변수들 사이의 관계를 파악하였다. 다중공선성은
두 변수 간의 선형관계에 의해 발생하지만, 다수의 변수 들 간의 선형관계에 의해서도 발생될 수 있기 때문에 상 관분석을 이용한 방법은 다중공선성을 진단하기 위한 기 초적인 단계로 이해할 수 있다(Lee and Lee, 2012). 분 석 결과, 전체 253개의 상관계수 중 23개가 0.6 이상의 매우 큰 상관관계를 보였고, 이는 다중공선성이 발생할 가능성이 높음을 의미한다. 이 경우 독립변수들 간의 독 립성이 부족하므로 다중회귀분석 적용이 어려워진다.
PLS (Partial Least Square) 회귀분석은 부분 최소제 곱을 활용한 분석방법으로 각 설명변수와 반응변수 간의 영향관계를 파악하기 때문에 다중공선성 문제를 제거할 수 있는 장점을 갖고 있는 통계모형이다. 다중회귀분석
Category Unit
Fine dust Fine dust level PM10 μg/m3
PM2.5 μg/m3
Industrial characteristics
Wholesale and retail trade Total number of workers 100 Persons
Accommodation and food service activities Total number of workers 100 Persons
Education Total number of workers 100 Persons
Human health and social work activities Total number of workers 100 Persons
Transportation Total number of workers 100 Persons
Construction Total number of workers 100 Persons
Manufacture of fabricated Metal products Total number of workers 100 Persons Manufacture of other machinery And equipment Total number of workers 100 Persons Manufacture of electronic components, computer, radio,
television and communication equipment and apparatuses Total number of workers 100 Persons Manufacture of motor vehicles, trailers and semitrailers Total number of workers 100 Persons
Manufacture of food products Total number of workers 100 Persons
Manufacture of rubber and plastic products Total number of workers 100 Persons
Urban characteristics
Population characteristics Number of people Person
Population density Person per ha
Land use type
Proportion of residential areas - Proportion of commercial areas - Proportion of industrial areas - Proportion of green areas -
Topographical feature Proportion of mountain areas -
Elevation of measuring station m
Weather characteristics Average annual wind speed m/s
Total annual precipitation mm
Others Number of vehicles registered Vehicles
Table 3. Data description
에서 관측치의 수가 충분하지 못할 때 생기는 문제도 제 거할 수 있다(Kim and Won, 2012). 모형의 유의성을 검증할 통계량이 존재하지 않는다는 지적이 존재하나 (Jeong et al., 2014), 잠재요인 사영 변수 중요도값 (Variable importance in the projection, VIP)의 크기로 설명변수의 영향력을 해석하기 때문에, 개별 설명변수에 대하여 전통적인 회귀분석보다 훨씬 더 유연하게 접근할 수 있다는 장점이 존재한다(Jeong, 2012).
PLS 회귀분석에서는 VIP 값을 통해 변수의 중요도를 파악하고, 계수(Coefficients)를 이용해 상대적인 영향력 을 비교할 수 있다. 일반적으로 독립변수의 VIP 값이 1 이상일 경우 통계적으로 유의성이 높은 경우에 해당하며, 0.8 이상인 경우에도 유의성이 있는 것으로 판단한다. 본 연구에서는 VIP 값이 0.8 이상인 독립변수만을 유의미 한 변수로 간주한다(Table 4 참조).
3. 결과 및 고찰
3.1. 미세먼지(PM
10)
분석 결과 총 14개의 독립변수가 미세먼지(PM10)에 영향을 미치는 중요 요인으로 나타났다. 가장 중요한 요 인에 해당되는 변수는 산지비율로서 VIP 값이 1.905로 나타났다(Table 5 참조). 그 외 VIP 값 1 이상에 해당하 는 독립변수는 측정소의 해발고도(1.586), 인구(1.487), 차량등록대수(1.314), 강수량(1.268), 교육서비스업 종 사자 수(1.208), 보건 및 사회복지 서비스업 종사자수 (1.202), 숙박 및 음식점업 종사자수(1.189), 도매 및 소 매업 종사자 수(1.159), 전자부품·컴퓨터·영상·음향 및 통신장비 제조업 종사자수(1.017)이다. VIP 값 0.8 이상 1 미만의 독립변수는 운수업 종사자수(0.891), 건설업 종사자 수(0.887), 주거지역 비율(0.827), 기타 기계 및
장비 제조업(0.818) 순으로 나타났다. .
산업특성의 경우 총 8개 업종(서비스업 6개 업종, 제 조업 2개 업종)이 미세먼지(PM10) 농도에 유의미한 양의 영향을 미치는 것으로 나타났다. 교육서비스업, 운수업, 보건 및 사회복지서비스업, 기타 기계 및 장비 제조업, 전 자부품 ․ 컴퓨터 ․ 영상 ․ 음향 및 통신장비 제조업, 숙박 및 음식점업, 건설업, 도매 및 소매업의 종사자 수가 증가 할수록 미세먼지(PM10) 농도가 높아짐을 알 수 있다 (Fig. 2 참조). 도시특성 변수 중에서는 주거지역 비율, 차량등록대수, 인구가 증가할수록 미세먼지(PM10) 농도 가 상승하였다. 도시특성 변수와 서비스업의 경우 인구 가 증가할수록 많아지는 사람들의 활동에 따른 것으로 판단된다. 반면, 강수량, 측정소의 해발고도, 산지비율의 경우 음의 관계가 존재하는 것으로 확인되었다. 이는 기 후와 지형 ․ 지리적인 영향의 존재에 따른 것으로 해석할 수 있다. 가장 큰 양의 영향을 주는 독립변수는 주거지역 비율이며, 가장 큰 음의 영향을 주는 독립변수는 산지비 율이다.
3.2. 초미세먼지 (PM
2.5)
분석 결과 총 13개의 독립변수가 초미세먼지(PM2.5) 에 영향을 미치는 중요 요인으로 나타났다. 가장 중요한 요인으로 추정되는 독립변수는 측정소의 해발고도로 VIP 값이 2.015로 나타났다(Table 6 참조). 그 외 VIP 값 1 이상의 중요한 요인으로 판단된 독립변수는 산지비 율(1.743), 인구밀도(1.451), 보건 및 사회복지 서비스업 종사자 수(1.221), 숙박 및 음식점업 종사자 수(1.156), 교육서비스 종사자 수(1.143), 녹지지역 비율(1.139), 인 구 수(1.124), 건설업(1.070), 도매 및 소매업 종사자 수 (1.047) 순으로 나타났다. 또한 VIP 값 0.8 이상 1 미만의 독립변수는 운수업(0.952)로는 차량등록대수(0.836)가
Range Importance
~ 0.6 No importance
0.6 ~ 0.7 Very weak importance
0.7 ~ 0.8 Weak importance
0.8 ~ 1.0 Normal or slight importance
1.0 ~ 1.2 Moderate importance
1.2 ~ High importance
Table 4. Reference criteria for interpreting VIP values
Fig. 2. Coefficients for PM10.
Variables VIP Coefficient
Industrial characteristics
Wholesale and retail trade Total number of workers 1.159 0.002
Accommodation and Food service activities Total number of workers 1.189 0.003
Education Total number of workers 1.208 0.006
Human health and Social work activities Total number of workers 1.202 0.004
Transportation Total number of workers 0.891 0.004
Construction Total number of workers 0.887 0.002
Manufacture of fabricated Metal products Total number of workers 0.567 0.003 Manufacture of other machinery
And equipment Total number of workers 0.818 0.004
Manufacture of electronic components, computer, radio, television and
communication equipment and apparatuses
Total number of workers 1.017 0.004
Manufacture of motor vehicles, trailers and
semitrailers Total number of workers 0.372 0.002
Manufacture of food products Total number of workers 0.654 0.012
Manufacture of rubber and plastic products Total number of workers 0.534 0.005
Urban characteristics
Population characteristics Number of people 1.487 0.000
Population density 0.375 0.001
Land use type
Proportion of residential areas 0.827 1.112 Proportion of commercial areas 0.051 0.257 Proportion of industrial areas 0.367 -1.084
Proportion of green areas 0.445 -0.484
Topographical feature Proportion of mountain 1.905 -2.082
Elevation of measuring station 1.586 -0.004
Weather characteristics Average annual wind speed 0.187 -0.071
Total annual precipitation 1.268 -0.001
Others Number of vehicles registered 1.314 0.000
Goodness-of-fit statistics R2 0.279
Table 5. PLS regression results of PM10
Fig. 3. Coefficients for PM2.5.
Variables VIP Coefficients
Industrial characteristics
Wholesale and retail trade Total number of workers 1.047 0.003
Accommodation and Food service activities Total number of workers 1.156 0.006
Education Total number of workers 1.143 0.010
Human health and Social work activities Total number of workers 1.221 0.007
Transportation Total number of workers 0.952 0.008
Construction Total number of workers 1.070 0.005
Manufacture of fabricated Metal products Total number of workers 0.473 -0.004 Manufacture of other machinery And equipment Total number of workers 0.430 -0.004 Manufacture of electronic components, computer,
radio, television and communication equipment and apparatuses
Total number of workers 0.134 -0.001
Manufacture of motor vehicles, trailers and
semitrailers Total number of workers 0.370 -0.003
Manufacture of food products Total number of workers 0.749 -0.023
Manufacture of rubber and plastic products Total number of workers 0.762 -0.011
Urban characteristics
Population characteristics Number of people 1.124 0.000
Population density 1.451 0.007
Land use type
Proportion of residential areas 0.996 2.294 Proportion of commercial areas 0.303 2.601 Proportion of industrial areas 0.190 -0.960 Proportion of green areas 1.139 -2.118
Topographical feature Proportion of mountain areas 1.743 -3.262
Elevation of measuring station 2.015 -0.009
Weather characteristics Average annual wind speed 0.517 0.335
Total annual precipitation 0.398 0.001
Others Number of vehicles registered 0.836 0.000
Goodness-of-fit statistics R2 0.226
Table 6. PLS regression results of PM2.5
해당된다.
산업특성의 경우 총 6개 업종이 양의 영향을 미치는 것으로 나타났다. 모두 서비스업에 해당하며, 제조업의 경우 초미세먼지(PM2.5)의 농도에 영향을 주지 않는 것 으로 나타났다. 서비스업은 도심에 위치하며 시민의 생 활과 밀접한 관련이 있으므로 더욱 주의해야 함을 알 수 있다.구체적으로는 교육서비스, 운수업, 보건 및 사회복 지 서비스업, 숙박 및 음식점업, 건설업, 도매 및 소매업 의 종사자 수가 증가할수록 초미세먼지(PM2.5) 농도가 증가함을 알 수 있다(Fig. 3 참조). 도시특성의 경우 주거 지역 면적, 인구밀도가 양의 관계로 나타났다. 반면, 산지 비율, 녹지지역 비율, 측정소의 고도의 경우 음의 관계임 을 확인하였다. 녹지지역의 비율은 미세먼지 배출원 면 적이 감소한 것에 따른 영향으로 추측할 수 있다. 미세먼 지(PM10) 분석 결과와 동일하게 지형‧지리적인 영향이 존재하며, 주거지역 비율이 가장 큰 양의 영향을, 측정소 의 고도가 가장 큰 음의 영향을 주는 것으로 나타났다.
4. 결론
본 연구는 도시의 산업특성이 미세먼지 농도에 영향 을 미치는 중요한 요인임을 분석하였다. 결과를 바탕으 로 도시 특성에 따른 맞춤형 미세먼지 저감정책 수립에 중요한 참고자료로 활용될 수 있다. 주요 결과는 다음 세 가지로 정리할 수 있다. 첫째, 미세먼지(PM10) 농도는 교 육서비스업, 운수업, 보건 및 사회복지서비스업, 기타 기 계 및 장비 제조업, 전자부품‧컴퓨터‧영상‧음향 및 통신장 비 제조업, 숙박 및 음식점업, 건설업, 도매 및 소매업 등 8개의 업종 종사자수의 양의 영향을 받는다. 또한, 주거 지역 면적, 인구밀도, 인구 수가 증가함에 따라 상승한다.
상대적으로 인구가 많거나 인구밀도가 높은 지역에서는 미세먼지 저감대책을 더 적극적으로 마련할 필요가 있다. 공장이 위치한 지역에서는 공장을 가동함에 따라 배출되 는 미세먼지(PM10)에 대한 맞춤 저감대책과 추가적인 분 석이 필요할 것으로 보인다.
둘째, 초미세먼지(PM2.5) 농도는 교육서비스업, 운수 업, 보건 및 사회복지서비스업, 숙박 및 음식점업, 건설 업, 도매 및 소매업 등 6개의 업종 종사자 수에 양의 영향 을 받는다. 이 업종들은 모두 시민의 생활과 밀접한 관련 이 있으며, 주로 도시 중심부에 분포하기 때문에 보다 엄
격한 관리와 운영이 필요한 것으로 판단된다. 더불어 녹 지지역의 비율이 증가할수록 초미세먼지(PM2.5) 농도가 감소하는 결과를 고려하여, 공원과 같은 녹지의 면적을 확대해야 하며 녹지를 감소시키는 행위는 지양해야 할 것으로 판단된다.
셋째, 산업 및 도시특성이 미세먼지(PM10)와 초미세 먼지(PM2.5)의 농도에 공통적으로 양의 영향을 주는 것 으로 나타났다. 도시의 주요 산업을 충분히 고려한 미세 먼지 저감정책이 필요하다. 또한, 지형 및 지리적인 차이 가 미세먼지 농도에 미치는 영향을 확인하였다. 이를 바 탕으로 도시별 지형 및 지리적 특성에 따라 다른 저감정 책과 시스템을 갖춰야 할 것이다.
본 연구의 한계점은 다음과 같다. 첫째, 본 연구에서 다룬 12개의 산업 이외의 산업의 영향이 존재할 수 있다.
둘째, 데이터의 한계로 인해 전국 166개 시‧군‧구 중 141 곳만을 대상으로 분석을 수행하였다. 향후 연구에서는 전국 모든 지역을 대상으로 수행하며, 도시별 산업특성 의 다양한 측면과 관계를 고려할 필요가 있다.
감사의 글
이 논문은 2018년 대한민국 교육부와 한국연구재단 의 지원을 받아 수행된 연구임 (NRF-2018S1A3A20 75332).
REFERENCES
Choe, J. G., Lee, Y. S., 2015, A Study on the impact of PM
2.5emissions on respiratory diseases, Jepa, 23(4), 155-172.
Henderson, S. B., Beckerman, B., Jerrett, M., Brauer, M., 2007, Application of land use regression to estimate long-term concentrations of traffic-related nitrogen oxides and fine particulate matter, Est, 41(7), 2422-2428.
Hong, J. S., Kim, H. Y., Lee, S. J., 2007, An Analysis of the effects of urban characteristics on NO
2concentrations in seoul, Ss, 8(3), 117-130.
Hong, S. Y., 2019, A Study on the relationship between PM
10and the diseases of circulatory system, respiratory system and allergy, M. D. Dissertation, Dongduk Women’s University, Seoul, Korea.
Jang, J. H., Lee, H. W., Lee, S. H., 2012, Spatial and temporal
features of PM
10evolution cycle in the korean peninsula,
Jes, 21(2), 189-202.
Jeong, G. S., 2012, Presumed influence factors of decision-making of mega-projects, Bai, 19, 91-124.
Jeong, G. S., Park, G. Y., Lee, J. H., 2014, Presumed influence factors of user satisfaction of seoul digital industrial complex using pls-regression model, Kais, 15(6), 3931-3943.
Jeong, J. C., Lee, S. H., 2018, Spatial distribution of particulate matters in comparison with land-use and traffic volume in Seoul, Republic of Korea, Jcli, 48, 123-138.
Kang, B. W., Lee, H. S., 2015, Source apportionment of fine particulate matter (PM
2.5) in the Chungju city, Kosae, 31(5), 437-448.
Kim, H. J., Won, J. M., 2012, A Study on examination of effect factors for changes of house price index using pls regression analysis: focused on 31 cityㆍcounties in Gyeonggi-do, Jpss, 7, 67-77.
Kim, J. H., Ghim, Y. S., Han, J. S., Park, S. M., Shin, H. J., Lee, S. B., Kim, J. S., Lee, G. W., 2018, Long-term trend analysis of korean air quality and its implication to current air quality policy on ozone and PM
10, Kosae, 34, 1-15.
Kim, Y. S., 2013, PM
10and PM
2.5source identification study in industrial and commercial region, Ph. D. Dissertation, Dong-A University, Busan, Korea.
Korea Environment Corporation Air Korea, 2017, https://
www.airkorea.or.kr/web/airMatter?pMENU_NO=130 Lee, J. H., Wu, C. F., Hoek, G., de Hoogh, K., Beelen, R.,
Brunekreef, B., Chan, C. C., 2015, LUR models for particulate matters in the Taipei metropolis with high densities of roads and strong activities of industry, commerce and construction, Scitoenv, 514, 178-184.
Lee, J. J., 2019, Research for characteristics and management of the fine particulate matter in the region of Gyeonggi province, M. D. Dissertation, Ajou University, Suwon, Korea.
Lee, Y. H., Lee, J. H., 2012, An Analysis on the affecting factor of subways service satisfaction level using the pls regression analysis: focused on the subway users in Seoul, Jtr, 19(4), 1-16.
Maeng, J. Y., 2014, A study on the correlations between urban variables and air pollutants: focused on SO
2, NO
2and PM
10, Ph. D. Dissertation, Gachon University, Seongnam, Korea.
Ministry of Environment, 2018, Comprehensive plan on fine dust(2020~2024), Seoul, Korea.
Moon, N. K., Kim, S. T., Ha, J. S., Kim, Y. M., Seo, J. H., 2017, Analysis system for regional environmental status to support environmental assessment : source apportionment analysis of air pollutants from major industrial complexes and local governments, 2017-04-01, Korea Environment Institute, Sejong, Korea.
Moon, N. K., Kim, S. T., Seo, J. H., 2011, A Strategic environmental assessment(sea) framework of air quality management for industrial complex planning, Report 2011-14, Korea Environment Institute, Sejong, Korea.
National Institute of Environmental Research, 2018, 2015 National air pollutants emission, NIER-GP2017-210, Incheon, Korea.
Oh, K. S., Chung, H. B., 2007, The influence of urban development density on air pollution, Jkpa, 42(5), 197-210.
Oh, Y. J., Han, Y. D., Kim, Y. J., Jung, S. H., Jung, W. H., Im, J. Y., Lee, J. W., Park, M. K., Son, B. S., 2019, Heavy metals exposure and health risk assessment of PM
10particles in indoor air in industrial area, Joie, 18, 18-27.
Park, J. K., Choi, Y. J., Jung, W. S., 2017, Understanding on regional characteristics of particular matter in Seoul:
distribution of concentration in borough spatial area and relation with the number of registered vehicles, Jesi, 26, 55-65.
Ross, Z., Jerrett, M., Ito, K., Tempalski, B., Thurston, G. D., 2007, A Land use regression for predicting fine particulate matter concentrations in the New York city region, Atmosenv, 41(11), 2255-2269.
Ryu, H. S., Lee, C. S., 2016, A Study on the criterion for residential area adjacent to an industrial complex by considering the dispersion characteristics of PM
10, Jkpa, 51(6), 153-168.
Seo, Y. H., Ku, M. S., Choi, J. W., Kim, K. M., Kim, S. M., Sul, K. H., Jo, H. J., Kim, S. J., Kim, K. H., 2014, Characteristics of PM
2.5emission and distribution in a highly commercialized area in Seoul, Korea, Kosae, 31(2), 97-104.
Yoon, Y. D., 2019, A Study on the relationship between urban characteristics and the concentration of the fine -particle(PM
10) for creating pleasant air-environment, M.
D. Dissertation, Korea University, Seoul, Korea.
Graduate student. Jeong-In Eum
Department of Urban Design and Planning, Hongik University [email protected]
Assistant professor. Hyung-Kyoo Kim
Department of Urban Design and Planning, Hongik University [email protected]