Introduction
Alcohol-induced flushing syndrome (AFS) is the condition commonly found among Asian population groups. It triggers flushing reaction, redness in face and body, even after small volume of alcohol intake. There are numerous studies currently available, exploring the possible cause and mechanism for Asians to develop flushing reaction [1-3]. The ethanol metabolism
pathway is composed of two distinct parts-first, alcohol particles are broken down into acetaldehyde, catalyzed by alcohol dehydrogenase (ADH) family, then acetaldehyde is further oxidized into acetate by aldehyde dehydrogenase (ALDH) [4,5]. However, for any reason, when ADH and ALDH acquire variants in their genes, they fail to break down the byproducts and cause the acetaldehyde to build up in blood. This, as a result, can lead to flushing reaction, which is recognized as https://doi.org/10.7580/kjlm.2019.43.2.71
Single Nucleotide Polymorphisms Associated with Alcohol- Induced Flushing Syndrome in Korean Population
Ji Hyun Lee
1* , Hee Jin Seo
1* , Sohee Cho
2, Moon-Young Kim
1, Soong Deok Lee
1,21
Department of Forensic Medicine, Seoul National University College of Medicine, Seoul, Korea,
2Institute of Forensic and Anthropological Science, Seoul National University College of Medicine, Seoul, Korea
Alcohol-induced flushing syndrome is one of the alcohol hypersensitivity reactions commonly found among Asian population. This study was designed to find markers that can predict this particular propensity among Korean population and to assess the applicability of this finding to build a prediction model as forensic DNA phenotyping tool to operate in practical forensic cases.
Five hundred seventy unrelated Koreans were genotyped using microfluidic technology with 24 possible candidate single nucleotide polymorphism (SNP) markers. Of the 24 candidate SNPs, four markers, rs671, rs2074356, rs4646776, and rs10849915, on chromosome 12 showed statistically significant association with P-values ranging from 1.39×10
-14to 0.004988 among our subjects. All four markers show relatively high specificity values, ranging from 0.804651 to 0.972093, presenting their capabilities as differential SNPs that can distinguish a person with or without alcohol-induced flushing syndrome. Maneuvering these candidate SNPs as well as finding additional potential markers through future studies will help building an appropriate prediction model for Koreans that can be used as supplementary tool for individual identification.
Key Words: Alcohols; Flushing; Aldehyde dehydrogenase;
Single nucleotide polymorphism; Koreans Received: December 21, 2018
Revised: March 14, 2019 Accepted: May 21, 2019
*These authors contributed equally to this work.
Correspondence to Soong Deok Lee
Department of Forensic Medicine, Seoul National University College of Medicine, 103 Daehak-ro, Jongno-gu, Seoul 03080, Korea
Tel: +82-2-740-8353
Fax: +82-2-764-8340
E-mail: [email protected]
one of the alcohol hypersensitivity responses [5-8].
For people with variants in these genetic components often result in the buildup of acetaldehyde in blood, which triggers the facial flushing [5,6,9-11].
Furthermore, a comprehensive family study done regarding alcohol hypersensitivity responses suggested that flushing reaction was inherited as dominant trait [8-10].
This study was designed in order to explore the specific markers associated with AFS in Korean population, hoping to find Korean specific AFS markers that be integrated into developing proper platforms and protocols to establish propensity prediction model. This prediction model is expected to provide supplementary investigative information, which can be utilized in real forensic applications to narrow down the investigative pool in crime scenes as well as mass disaster or even in finding missing persons.
Materials and Methods
1. Participants and sample collection
Subjects volunteered to participate in this study for sample collection. Blood samples were obtained from volunteers, after getting informed consent. The blood samples were extracted using the Maxwell 16 instrument (Promega, Madison, WI, USA), and reagents, following the manufacturer’s protocols. Quantity of DNA was determined by the QuantStudio 5 Real-Time PCR System (Thermo Fisher, Waltham, MA, USA) using the Quantifiler Human DNA Quantification Kit (Thermo Fisher).
Along with blood samples, each participant filled out questionnaire regarding drinking habits, the amount and frequency of alcohol consumption and the presence of flushing and redness after alcohol intake. A drinking habits questionnaire was conducted to categorize those who showed flush even if they drank a little alcohol.
Each subject was asked to provide the frequency and number of drinks per week and whether he/she has experienced flushing responses after alcohol intake.
Based on the survey responses, 255 subjects for AFS positive, 215 for AFS negative and 100 control samples, grand total of 570 participants, were randomly selected
for this experiment. A randomized selection was made for the control group representing the overall distribution of Koreans, regardless of the flushing questionnaires. The following experimental procedure and detailed informed consent process have been reviewed and approved by the Institutional Review Board of Seoul National University College of Medicine (IRB approval No. C-1501-078-641).
2. Marker selection
Genes known to be associated with alcohol metabolism pathways, alcohol dependence, alcohol related pathologic conditions, and drinking behaviors were found in various publications [5,12-16]. Some of the popular alcohol metabolism related genes include ADH4, ADH7, ADH1B, ADH1C, and ALDH2 as well as various others. From the genes found to be related to alcohol metabolism and consumption, only the Tag SNPs have been searched and selected as potential candidates. Tag SNPs were chosen from tagger website provided by NIH (http://manticore.niehs.nih.gov/
snpinfo/snp-tag.php) with linkage disequilibrium threshold set to r
2≥0.8 and minor allele frequency (MAF) range of 0.05-0.5. Because there was no Korean exclusive population pool, Japanese (JPT) and Chinese- Beijing population groups (CHB) were selected; the two population groups assumed to present the highest resemblances to Koreans. Each gene was searched twice, once with Japanese and once with Chinese population pool to verify whether there were any discrepancies in search results. As a result, total of 24 candidate single nucleotide polymorphism (SNP) markers were selected for experiment.
3. Genotyping
DNA from 570 samples was extracted from 300 µL of blood and each extracted DNA was diluted to >50 ng/
µL for reliable experimental results. SNP genotyping
of 570 samples was performed using 192.24 Dynamic
Array Integrated Fluidic Circuits (IFC) (Fluidigm, San
Francisco, CA, USA), a platform that uses IFC is known to
be capable of performing multiple real time polymerase
chain reaction (PCR) reactions in a single run with high
accuracy and call rates. “192” indicates the number of samples that can be loaded on a single batch and “24”
corresponds to the number of markers used in this experiment. The array is mounted on a plastic interface containing 192 sample and 24 assay inlets on the left and right of the array. The array contains a network of fluid lines (IFC) and chambers that are controlled by elastomeric valves. These valves deflect under pressure to create a tight seal, thereby regulating the flow of liquids into the IFC.
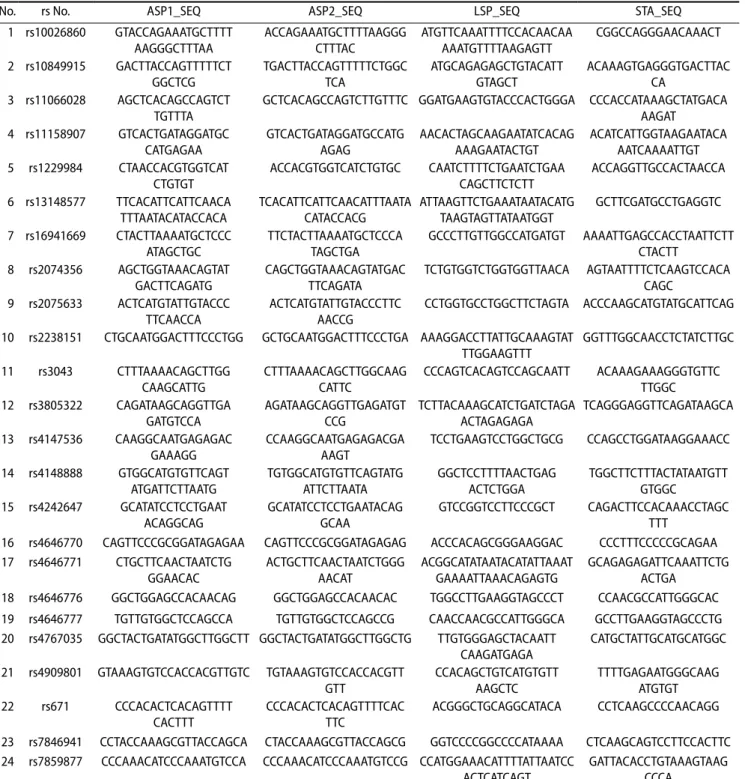
The complete primer sequences for all 24 markers are provided in Table 1. Primers were designed for each SNP including two allele-specific primers (ASP), one locus specific primer (LSP), and one specific target amplification (STA) primer through Fluidigm’s DeltaGene assay design service. 10× SNP type STA Primer Pools were prepared comprised 2 µL SNP type Assay STA Primer (100 µM) for each assay, 2 µL SNP type assay LSP (100 µM) for each assay, and 304 µL DNA suspension buffer. STA was performed using 2.5 µL 2×
Multiplex PCR Master Mix (Qiagen, Hilden, Germany), 0.5 µL 10× SNP type STA Primer Pool, 0.75 µL PCR-certified water, and 1.25 µL of each genomic DNA sample.
GeneAmp PCR System 9700 (Applied Biosystems, Foster City, CA, USA) was used to thermal cycle according to the following protocol: 95°C for 15 minutes followed by 14 cycles of 95°C for 15 seconds and 60°C for 4 minutes. STA products were diluted 1:100 in DNA suspension buffer. SNP type assay mixes were prepared for each SNP type assay combining 3 µL of each 100 µM SNP type assay ASP1/ASP2, 8 µL 100 µM SNP type assay LSP, and 29 µL DNA suspension buffer. To create 10×
assay mixes, 2 µL 2× Assay Loading Reagent (Fluidigm) and 1.2 µL PCR-certified water were blended and then combined with 0.8 µL of each SNP type assay mix. The sample mixes were created as follows: 2.25 µL Biotium 2× Fast Probe Master Mix (Biotium, Fremont, CA, USA), 0.225 µL 20× SNP type Sample Loading Reagent (Fluidigm), 0.075 µL 60x SNP type Reagent (Fluidigm), 0.027 µL ROX (Life Technologies, Carlsbad, CA, USA), and 0.048 µL PCR-certified water were blended and then combined with 1.9 µL of each genomic DNA. Each of the assays and samples was pipetted into separate inlets on the frame of the chip according to the manufacturer's instructions. The assays and samples were loaded
into the reaction chambers and mixed using the IFC Controller MX. Arrays should be run immediately after assays, with samples pipetted into wells. The array was analyzed in the BioMark real-time PCR system (Fluidigm) using a thermal protocol of a hot-start step (95°C, 5 minutes), touchdown step (95°C for 15 seconds, from 64.0ºC to 61.0ºC dropping 1ºC per cycle for 45 seconds, 72°C for 15 seconds), additional PCR step (34 cycles of 95°C, 15 seconds; 54°C, 45 seconds; 72°C, 15 seconds) and cooling step (25°C for 10 seconds). The experimental data was collected using SNP Genotyping Analysis Software and Fluidigm Data Collection Software as indicated in user guide (Fluidigm).
4. Statistical analysis
We tested for the efficacy of associated markers to predict AFS in our samples. The associations of each markers were observed using chi-square test, P-value of <0.05. All experimental data analysis was performed using PLINK software version 1.07 [17].
For further assessment, the experiment data was divided into three groups; AFS positive-AFS negative pair, AFS positive-control pair, AFS negative-control pair.
In order to examine the markers significantly associated with flushing conditions, intergroup comparisons were performed; association analysis for each pair was done.
Results
1. Final candidate markers
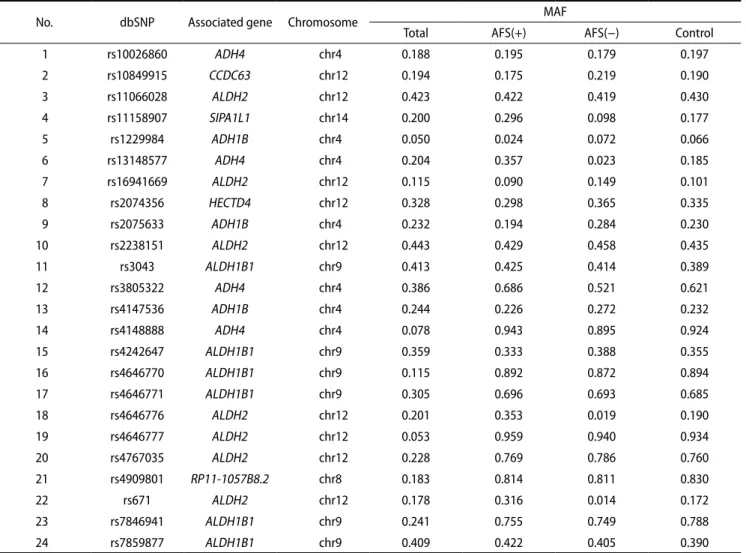
The list of final candidate markers, located genes and MAF is provided in Table 2. The candidate markers were found mostly in chromosome 4, 9 and 12, except one, rs4909801, found in chromosome 8, with the MAF ranging from 0.049 to 0.441. The average MAF was 0.240458±0.11933. MAF values for all markers were obtained via Haploview [18].
2. Association analysis of the candidate markers
Chi-square test was performed to observe the
associations among the tested samples. According
to initial association analysis, combining all samples
from three groups, five were found to show possible association with flushing syndrome: rs671, rs2074356, rs4646776, rs10849915, rs4767035 with P-values ranging from 1.39×10
-14to 0.01886 (Table 3).
According to this analysis, rs671 was found to be the most significantly associated with AFS in our sample population (odds ratio AA vs. GG, 12.37; 95% confidence interval [CI], 5.651 to 27.09). The highest odds ratio was
Table 1. The complete primer sequences used in this experiment
No. rs No. ASP1_SEQ ASP2_SEQ LSP_SEQ STA_SEQ
1 rs10026860 GTACCAGAAATGCTTTT
AAGGGCTTTAA ACCAGAAATGCTTTTAAGGG
CTTTAC ATGTTCAAATTTTCCACAACAA
AAATGTTTTAAGAGTT CGGCCAGGGAACAAACT 2 rs10849915 GACTTACCAGTTTTTCT
GGCTCG TGACTTACCAGTTTTTCTGGC
TCA ATGCAGAGAGCTGTACATT
GTAGCT ACAAAGTGAGGGTGACTTAC
CA 3 rs11066028 AGCTCACAGCCAGTCT
TGTTTA GCTCACAGCCAGTCTTGTTTC GGATGAAGTGTACCCACTGGGA CCCACCATAAAGCTATGACA AAGAT
4 rs11158907 GTCACTGATAGGATGC
CATGAGAA GTCACTGATAGGATGCCATG
AGAG AACACTAGCAAGAATATCACAG
AAAGAATACTGT ACATCATTGGTAAGAATACA AATCAAAATTGT 5 rs1229984 CTAACCACGTGGTCAT
CTGTGT ACCACGTGGTCATCTGTGC CAATCTTTTCTGAATCTGAA
CAGCTTCTCTT ACCAGGTTGCCACTAACCA 6 rs13148577 TTCACATTCATTCAACA
TTTAATACATACCACA TCACATTCATTCAACATTTAATA
CATACCACG ATTAAGTTCTGAAATAATACATG
TAAGTAGTTATAATGGT GCTTCGATGCCTGAGGTC 7 rs16941669 CTACTTAAAATGCTCCC
ATAGCTGC TTCTACTTAAAATGCTCCCA
TAGCTGA GCCCTTGTTGGCCATGATGT AAAATTGAGCCACCTAATTCTT CTACTT
8 rs2074356 AGCTGGTAAACAGTAT GACTTCAGATG
CAGCTGGTAAACAGTATGAC TTCAGATA
TCTGTGGTCTGGTGGTTAACA AGTAATTTTCTCAAGTCCACA CAGC
9 rs2075633 ACTCATGTATTGTACCC TTCAACCA
ACTCATGTATTGTACCCTTC AACCG
CCTGGTGCCTGGCTTCTAGTA ACCCAAGCATGTATGCATTCAG 10 rs2238151 CTGCAATGGACTTTCCCTGG GCTGCAATGGACTTTCCCTGA AAAGGACCTTATTGCAAAGTAT
TTGGAAGTTT
GGTTTGGCAACCTCTATCTTGC 11 rs3043 CTTTAAAACAGCTTGG
CAAGCATTG
CTTTAAAACAGCTTGGCAAG CATTC
CCCAGTCACAGTCCAGCAATT ACAAAGAAAGGGTGTTC TTGGC 12 rs3805322 CAGATAAGCAGGTTGA
GATGTCCA AGATAAGCAGGTTGAGATGT
CCG TCTTACAAAGCATCTGATCTAGA
ACTAGAGAGA TCAGGGAGGTTCAGATAAGCA 13 rs4147536 CAAGGCAATGAGAGAC
GAAAGG CCAAGGCAATGAGAGACGA
AAGT TCCTGAAGTCCTGGCTGCG CCAGCCTGGATAAGGAAACC 14 rs4148888 GTGGCATGTGTTCAGT
ATGATTCTTAATG TGTGGCATGTGTTCAGTATG
ATTCTTAATA GGCTCCTTTTAACTGAG
ACTCTGGA TGGCTTCTTTACTATAATGTT GTGGC
15 rs4242647 GCATATCCTCCTGAAT
ACAGGCAG GCATATCCTCCTGAATACAG
GCAA GTCCGGTCCTTCCCGCT CAGACTTCCACAAACCTAGC
TTT 16 rs4646770 CAGTTCCCGCGGATAGAGAA CAGTTCCCGCGGATAGAGAG ACCCACAGCGGGAAGGAC CCCTTTCCCCCGCAGAA 17 rs4646771 CTGCTTCAACTAATCTG
GGAACAC
ACTGCTTCAACTAATCTGGG AACAT
ACGGCATATAATACATATTAAAT GAAAATTAAACAGAGTG
GCAGAGAGATTCAAATTCTG ACTGA
18 rs4646776 GGCTGGAGCCACAACAG GGCTGGAGCCACAACAC TGGCCTTGAAGGTAGCCCT CCAACGCCATTGGGCAC 19 rs4646777 TGTTGTGGCTCCAGCCA TGTTGTGGCTCCAGCCG CAACCAACGCCATTGGGCA GCCTTGAAGGTAGCCCTG 20 rs4767035 GGCTACTGATATGGCTTGGCTT GGCTACTGATATGGCTTGGCTG TTGTGGGAGCTACAATT
CAAGATGAGA CATGCTATTGCATGCATGGC 21 rs4909801 GTAAAGTGTCCACCACGTTGTC TGTAAAGTGTCCACCACGTT
GTT CCACAGCTGTCATGTGTT
AAGCTC TTTTGAGAATGGGCAAG
ATGTGT 22 rs671 CCCACACTCACAGTTTT
CACTTT CCCACACTCACAGTTTTCAC
TTC ACGGGCTGCAGGCATACA CCTCAAGCCCCAACAGG
23 rs7846941 CCTACCAAAGCGTTACCAGCA CTACCAAAGCGTTACCAGCG GGTCCCCGGCCCCATAAAA CTCAAGCAGTCCTTCCACTTC 24 rs7859877 CCCAAACATCCCAAATGTCCA CCCAAACATCCCAAATGTCCG CCATGGAAACATTTTATTAATCC
ACTCATCAGT GATTACACCTGTAAAGTAAG CCCA
ASP stands for allele specific primers, LSP primer indicates locus specific primers, and STA is the primers representing specific target
amplification, providing unbiased target enrichment and sufficient template.
seen with rs2074356 (odds ratio AA vs. GG, 14.65; 95%
CI, 0.4701 to 0.9351).
Followed by the combined association analysis, the
samples were divided into grouped pairs and inter- group comparisons were performed for each pair. In AFS positive-AFS negative group, total of 10 SNP markers
Table 2. List of 24 final candidate markers selected with gene location and MAF values
No. dbSNP Associated gene Chromosome MAF
Total AFS(+) AFS(-) Control
1 rs10026860 ADH4 chr4 0.188 0.195 0.179 0.197
2 rs10849915 CCDC63 chr12 0.194 0.175 0.219 0.190
3 rs11066028 ALDH2 chr12 0.423 0.422 0.419 0.430
4 rs11158907 SIPA1L1 chr14 0.200 0.296 0.098 0.177
5 rs1229984 ADH1B chr4 0.050 0.024 0.072 0.066
6 rs13148577 ADH4 chr4 0.204 0.357 0.023 0.185
7 rs16941669 ALDH2 chr12 0.115 0.090 0.149 0.101
8 rs2074356 HECTD4 chr12 0.328 0.298 0.365 0.335
9 rs2075633 ADH1B chr4 0.232 0.194 0.284 0.230
10 rs2238151 ALDH2 chr12 0.443 0.429 0.458 0.435
11 rs3043 ALDH1B1 chr9 0.413 0.425 0.414 0.389
12 rs3805322 ADH4 chr4 0.386 0.686 0.521 0.621
13 rs4147536 ADH1B chr4 0.244 0.226 0.272 0.232
14 rs4148888 ADH4 chr4 0.078 0.943 0.895 0.924
15 rs4242647 ALDH1B1 chr9 0.359 0.333 0.388 0.355
16 rs4646770 ALDH1B1 chr9 0.115 0.892 0.872 0.894
17 rs4646771 ALDH1B1 chr9 0.305 0.696 0.693 0.685
18 rs4646776 ALDH2 chr12 0.201 0.353 0.019 0.190
19 rs4646777 ALDH2 chr12 0.053 0.959 0.940 0.934
20 rs4767035 ALDH2 chr12 0.228 0.769 0.786 0.760
21 rs4909801 RP11-1057B8.2 chr8 0.183 0.814 0.811 0.830
22 rs671 ALDH2 chr12 0.178 0.316 0.014 0.172
23 rs7846941 ALDH1B1 chr9 0.241 0.755 0.749 0.788
24 rs7859877 ALDH1B1 chr9 0.409 0.422 0.405 0.390
Most of the potential candidates were found in chromosome 4, 9, and 12, except one marker (rs4909801) found in RP11-1057B8.2 gene in chromosome 8.
MAF, minor allele frequency; AFS, alcohol-induced flushing syndrome.
Table 3. List of five significant markers through initial association studies within three groups (all samples were combined for preliminary analysis)
CHR SNP P-value OR CHI SQ
12 rs671 1.39×10
-1412.37 59.25
12 rs2074356 5.39×10
-1414.65 56.58
12 rs4646776 6.37×10
-139.534 51.73
12 rs10849915 0.004988 1.984 7.884
12 rs4767035 0.01886 0.663 5.514
The corresponding P-value, OR, and chi-square values for five markers were as follows. Among those, rs671 showed the strongest possible association (P-value of 1.39×10
-14) and rs2074356 presented the highest OR (OR of 14.65).
CHR, chromosome; SNP, single nucleotide polymorphism; OR, odds ratio.
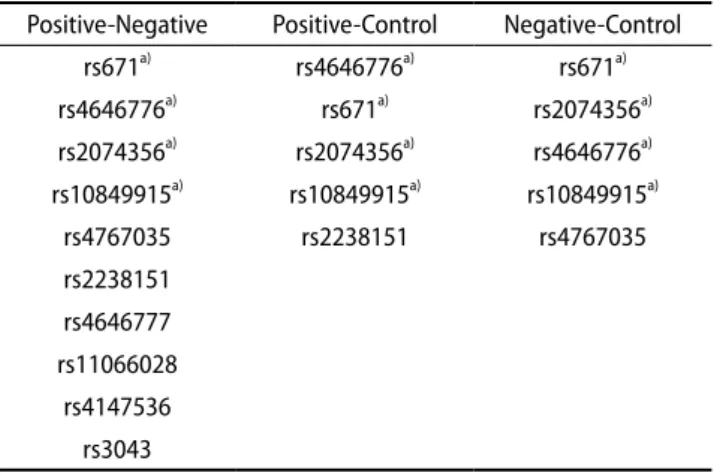
showed statistically significant P-value (P<0.05), and both AFS positive-control and AFS negative-control pairs showed statistically significant (P<0.05) markers that may have significant association with flushing.
Of those markers with significant P-values, four SNP markers were commonly found in all grouped pairs:
rs671, rs4646776, rs2074356, and rs10849915 (Table 4). Although each pair showed those mentioned four markers with statistically significant P-values, each group showed slight variations in markers with the strongest association; AFS positive-AFS negative presented and AFS negative-control group showed rs671 as the marker with the strongest possible association, the lowest P-value, while AFS positive- control group pair had rs4646776 as the candidate marker with the highest statistical significance (Table 5).
Moreover, the major and minor alleles with frequency values for each candidate SNPs are indicated in Table 6. The risk allele for rs671 is A, for rs207436 is also A, rs4646776 and rs10849915 are both C. Major and minor frequency among AFS negative and control show relatively clear distinction, while the frequency for AFS positive group presents rather ambiguous values for definite prediction. This may be due to the fact that even one allele carriers in AFS positive group exhibited flushing responses. For instance, rs671 has risk allele of
‘A’ and both subjects with ‘AA’ and ‘AG’ genotype would present flushing reactions.
3. Sensitivity, specificity, and accuracy
In order to evaluate differential power for the candidate SNPs, sensitivity, specificity and accuracy for each marker were calculated (Table 7). The average values for sensitivity, specificity, and accuracy were 0.602941±0.03866, 0.923256±0.079434, and 0.749468±0054809, respectively. rs4646776 presented the highest sensitivity, while the highest specificity value was observed in rs2074356, a marker in which also presented the largest gap between sensitivity and specificity. The highest accuracy was found in rs671.
rs10849915 had the lowest values for all sensitivity, specificity and accuracy among those four markers.
Meanwhile, in order to examine whether the sex difference could act as another factor for provoking AFS
incidence, additional statistical assessment analysis was done assigning the sex as possible covariant.
According to analysis data, no statistically significant
Table 4. Significant SNPs found within each comparison pair Positive-Negative Positive-Control Negative-Control
rs671
a)rs4646776
a)rs671
a)rs4646776
a)rs671
a)rs2074356
a)rs2074356
a)rs2074356
a)rs4646776
a)rs10849915
a)rs10849915
a)rs10849915
a)rs4767035 rs2238151 rs4767035
rs2238151 rs4646777 rs11066028
rs4147536 rs3043
SNP, single nucleotide polymorphism.
a)