An Application of Fuzzy AHP and TOPSIS Methodology for Ranking the Factors Influencing FinTech Adoption
Intention: A Comparative Study of China and Korea
Hong-Lei Mu*, Young-Chan Lee**
Content Abstract
1. Introduction
2. Literature Review about UTAUT2 3. Fuzzy Sets and Fuzzy Numbers 3.1 Fuzzy Sets
3.2 Fuzzy Numbers
4. Fuzzy Analytic Hierarchy Process(FAHP) 4.1 Fuzzy Analytic Hierarchy Process (FAHP)
4.2 Methodology of FAHP
5. TOPSIS Method
6. UTAUT2-based Hierarchy 6.1 Perceived Credibility 6.2 Performance Expectancy 6.3 Price Value
6.4 Social Influence 7. Application 8. Conclusion Reference 요약
Abstract
ㄴ
Financial technology (FinTech) is an emerging financial service sector include innovations in financial literacy and investment, retail banking, education, and crypto-currencies like bitcoin. One of the crucial branch of financial technology—third-party payment (TPP) is undergoing rapid growth, with online/mobile systems replacing offline financial systems. System quality and user attitudes are key perceptions driving third-party payment usage, the importance of these perceptions, however, may be different with countries as users’ thinking varies from country to country. Thus, the purpose of this study is to elaborate how factors differ from China to Korea by drawing on the unified theory of acceptance and use of technology (UTAUT2). Additionally, this study also aims to propose a multi-attribute evaluation of the third-party online payment system based on analytic hierarchy process (AHP), fuzzy sets and technique for order performance by similarity to ideal solution (TOPSIS), to examine the relative importance of the perceptions influencing new technology adoption intention. The results showed that the price value has the most significant influence on Chinese perceptions, while the perceived credibility has the most significant effect on Korean perceptions.
Sub-criteria also performs different results to Chinese and Korean third-party online payment system.
Keywords: UTAUT, Multi-Criteria Decision Making, AHP, TOPSIS, Fuzzy, FinTech 접수일(2017년 10월 12일), 수정일(1차: 2017년 12월 17일), 게재확정일(2017년 12월 22일)
* Ph.D. Student, International Business Cooperate Course, Graduate School of Dongguk University, [email protected], First Author
** Professor, Dept. of Business Administration, Dongguk University, [email protected], Corresponding Author
1. Introduction
Financial technology (FinTech) is an emerging financial services sector that includes third-party payment (TPP), insurance products, risk management, and P2P lending (Barberis, 2014). With the development of information and communications technology ecosystem, TPP has undergone rapid growth, with online systems replacing offline financial systems (Shim & Shin, 2015). System quality and user attitudes are key perceptions driving third-party payment usage, the importance of these perceptions, however, may be different with countries as users’ thinking varies from country to country. For example, Korean prefer credit cards to make online/offline purchase, while Chinese like cash payment better, which has made TPP unique. Due to the cultural difference, the perspective of adopting TPP will be different between Chinese and Korean. Also, although a growing body of system usage research has examined important factors influencing user intention, to date, little research has been directed at explaining these factors by integrating fuzzy Analytical Hierarchy Process (FAHP) approach and Technique for Order Preference by Similarity to Ideal Solution (TOPSIS) methodology. What is more, factors in the UTAUT2 model has been proved to be vital for user’s use intention. However, each study obtained different outcomes on the importance of these factors even in the same country. Thus, it is important to rank the relative importance of the determinants of use intention to achieve competitive advantage, which is multi-criteria decision-making (MCDM). Accordingly, the objective of this study is to rank the factors
influencing use intention of TPP based on UTAUT2 model via a unique methodology by integrating fuzzy Analytical Hierarchy Process (AHP) and Technique for Order Preference by Similarity to Ideal Solution (TOPSIS) methodology. And then compare the outcome of China and Korea to give useful implications for researchers and managers of TPP companies.
The remainder of this paper is structured as follows: Section 2 does a literature review of UTAUT model. Section 3 explains the fuzzy logic and fuzzy numbers, algebraic operations with fuzzy numbers. In Section 4, FAHP method is summarized.
TOPSIS method is proposed in Section 5. In Section 6, the proposed model is demonstrated. Then the application is conducted in Section 7. In Section 8, conclusion is discussed.
2. Literature Review about UTAUT2
Prior research on new technology adoption has employed some theoretical models to investigate user’s use intention of technologies. This stream of research process has brought about the unified theory of acceptance and use of technology (UTAUT; Venkatesh et al., 2003) that contain previous adoption models like TAM. UTAUT presents four main determinants of user’s acceptance and use: performance expectancy, effort expectancy, social influence, and facilitating conditions. According to Venkatesh et al. (2003), performance expectancy is defined as the degree to which an individual believes that using the IS will help him/her to attain goals in job performance.
Effort expectancy is defined as the degree of ease
associated with the use of the IS. Social influence is the degree to which an individual perceives other people believe surround him that he/she should use the new IS. Finally facilitating conditions is the degree to which an individual believes that organizational and technical infrastructure exists to support the use of IS. These four determinants have been demonstrated widely on the adoption of different technologies, such as mobile services and e-marketplaces (Wang et al., 2006). The more important thing is that these four determinants have been found to have a significant influence on behavior intention/use. Building on UTAUT model, Venkatesh et al. (2012) add three constructs that are hedonic motivation, price value, and habit into UTAUT to generate UTAUT 2 to examine user’s technology use intention. Hedonic motivation is defined as the fun or pleasure derived from using technology (Brown & Venkatesh, 2005). Price value is defined as consumer’s cognitive tradeoff between the monetary cost and the perceived benefits of the technology (Dodds et al., 1991). The habit has been defined as the extent to which people tend to perform learning behaviors automatically (Limayem et al., 2007). The study proved that UTAUT 2 produced a substantial improvement in explaining the behavioral intention and new technology use.
Also, Yu (2012) added one trust-based construct
“perceived credibility,” two resource-based constructs “perceived financial cost” and
“perceived self-efficacy” to the UTAUT. In this study, perceived credibility is defined as the extent to which a person believes that the use of technology will have no security or privacy threats (Yu, 2012). The results notice that social influence,
performance expectancy are not the only most significant factors, perceived credibility was also verified to be a salient factor in predicting user’s intention to adopt mobile banking.
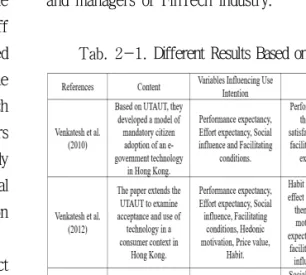
Most of the previous studies demonstrated the importance of determinants of UTAUT. However, we found that the outcome or the significance of determinants would vary with each study, even in the same country. <Tab. 2-1> shows the different results based on UTAUT model. Thus, to make a clear ranking order of the factors that influence use intention of the financial technology based on UTAUT2, we adopted a unique method which integrates fuzzy AHP and TOPSIS methodology. At the same time, we compared the perspective of Chinese and Korean on adopting TPP, Few studies have employed this kind of method; we believe our study can provide particular insights to researchers and managers of FinTech industry.
Tab. 2-1. Different Results Based on UTAUT
3. Fuzzy Sets and Fuzzy Numbers
3.1 Fuzzy Sets
Fuzzy set theory was first introduced by Zadeh (1965) in order to deal with human thought. The classical set theory is built on the ideas of which is either a member or not a member. Zadeh (1965) proposed to use values ranging from 0 to 1 for indicating the membership. Complete non-membership is represented by 0, and complete membership is represented by 1. Fuzzy sets theory has provided a more widely frame than classic theory and has been making a contribution to the real world. Fuzzy sets and fuzzy logic are powerful tools for modeling uncertain systems in industry or decision making in the absence of precise information. Their role is significant when applied to a complex situation that not easily described by traditional methods (Bojadziev, 1998).
3.2 Fuzzy Numbers
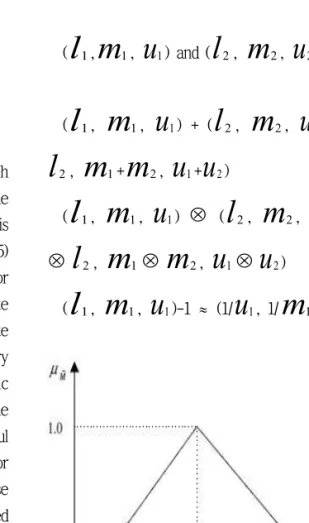
In this study, fuzzy triangular members (FTN) are adopted. FTNs are useful in promoting information processing in a fuzzy environment. FTNs can be expressed as (l, m, u). L, m, and u indicate the smallest possible value, the most promising value, and the largest possible value that describe a fuzzy event, respectively. A TFN M~ is shown in <Fig 3-1> (Deng, 1999). There are various operations on TFNs, but in this study, three important operations are illustrated. If we define, two positive TFNs
(
l
1,m
1,u
1) and (l
2,m
2,u
2) then:(
l
1,m
1,u
1) + (l
2,m
2,u
2) = (l
1+l
2,m
1+m
2,u
1+u
2)(
l
1,m
1,u
1) Ä (l
2,m
2,u
2) = (l
1Ä
l
2,m
1 Äm
2,u
1Äu
2)(
l
1,m
1,u
1)-1 » (1/u
1, 1/m
1, 1/l
1)Fig. 3-1 Triangular Fuzzy Number,
~
M
4. Fuzzy Analytic Hierarchy Process (FAHP)
4.1 Concepts of FAHP
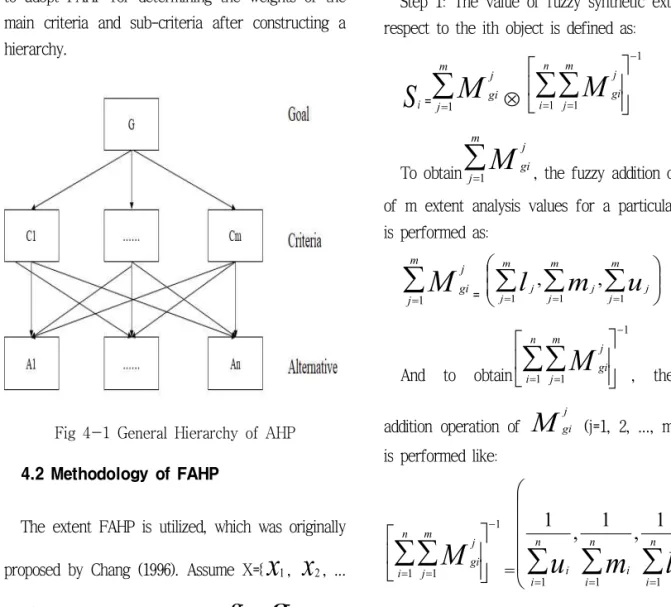
Analytic Hierarchy Process (AHP) is a widely used multi-criteria decision-making tool and proposed by Saaty (1980). Usually, a hierarchy has three levels demonstrated in <Fig 4-1> Overall goal of the problem at the top; multiple criteria related to the goal; and decision alternatives at the bottom
(Albayrak & Erensal, 2004). Despite this, AHP still has limit ability to reflect the human thinking (Kahrman et al., 2003). In addition, AHP method is often criticized due to the unbalanced scale of judgments and imprecision in the pairwise comparison process (Deng, 1999). To overcome all these flaws, FAHP was developed. Decision makers find that it is more confident to give interval judgments than fixed value judgments since decision makers are unable to explicit his/her preference (Kahraman et al., 2003). In this study, we intended to adopt FAHP for determining the weights of the main criteria and sub-criteria after constructing a hierarchy.
Fig 4-1 General Hierarchy of AHP 4.2 Methodology of FAHP
The extent FAHP is utilized, which was originally proposed by Chang (1996). Assume X={
x
1,x
2, ...,
x
n} an object set, and G={g
1,g
2, ... ,g
n} be a goal set. According to the method, each object is taken, and extent analysis for each goal is performed respectively. Therefore, m extent analysis values for each object can be acquired, with the following signs:M
1gi,M
2gi, ...M
ngi ,i = 1, 2, ..., n,Where
M
gij (j = 1, 2... m) all are TFNs. The steps of Chang’s extent analysis can be obtained as follows:Step 1: The value of fuzzy synthetic extent with respect to the ith object is defined as:
S
i=å
= mj j
M
gi1 Ä
1
1 1
-
= = úú
û ù ê
ë é
åå
n
i m
j j
M
gi (1)To obtain
å
= m
j j
M
gi1 , the fuzzy addition operation of m extent analysis values for a particular matrix is performed as:
å
= m
j j
M
gi1 = çç
è æ
÷÷ ø
å å å
ö= = =
m
j
m
j
m
j j j
j
m u
1
l
1 1,
, (2)
And to obtain
1
1 1
-
= = úú
û ù ê
ë é
åå
n
i m
j j
M
gi , the fuzzyaddition operation of
M
gij (j=1, 2, ..., m) values is performed like:1
1 1
-
= = úú
û ù ê
ë é
åå
n
i m
j j
M
gi = ççç ç
è æ
÷
÷
÷
÷
ø ö
å å
å
=
=
=
n
i i n
i i n
i
i
m l
u
1 1 1, 1 , 1
1
(3)
Step 2: As
M
1= (l
1,m
1,u
1) andM
2=(
l
2,m
2,u
2) are two fuzzy triangular numbers,the degree of possibility of
M
2= (l
2,m
2,u
2) ≧M
1= (l
1,m
1,u
1) is defined as:V (
M
2≧M
1) =sup
y³x [min (u
M1(x),u
M2(y)] (4)And can be expressed as:
V (
M
2≧M
1) = hgt (M
1ÇM
2) =u
M2(d) (5)(6) Step 3: The degree possibility for a convex fuzzy number to be greater than k convex fuzzy
M
i(i=1, 2 ..., k) numbers can be defined by:
V (
M
≧M
1,M
2...M
k) = V[(M
≧M
1) and ... and (M
≧M
k)] = Min V (M
≧
M
i), i= 1, 2...k (7) Assume that d (A
i) = min V (S
i≧S
k) fork = 1, 2...n; k≠i. Then the weight vector is given by:
W
'= (d
'(A
1),d
'(A
2)...d
'(A
n))
T (8)Where
A
i(i=1, 2... n) are n elements.Step 4: Via normalization, the normalized weight vectors are:
W
= (d
(A
1) ,d
(A
2) . . .d
(
A
n))
T ( 9 ) Where,W
is a non-fuzzy number.5. TOPSIS Method
TOPSIS is one of the useful MADM techniques to manage real-world problems (Yoon & Hwang, 1985).
According to TOPSIS, the best alternative would be the one that is nearest to the positive-ideal solution and farthest the negative-ideal solution (Benitez et al., 2007). The positive-ideal solution minimizes the cost criteria and maximizes the benefit criteria, while negative-ideal solution maximizes the cost criteria and minimizes the benefit criteria, which has all worst values acquired from the criteria (Wang, 2008). In this study, we use TOPSIS methodology for determining the final ranking of the alternatives.
Step 1: Decision matrix is normalized via Eq. (10):
r
ij=å
= J
j ij
ij
w w
1 2
, j= 1, 2... J; i=1, 2... n. (10) Step 2: Weighted normalized decision matrix is formed:
v
ij=w
i Är
ij, j= 1, 2... J; i=1, 2... n. (11) Step 3: Positive-ideal solution (PIS) and negative-ideal solution (NIS) are determined:A
*={ v v v
n}
*
* 2
*
1, ,..., maximum values (12)
A
={ v
1-,v
-2,...,v
n-}
minimum values (13) Step 4: The distance of each alternative from PISand NIS are calculated:
d
i*=å ( )
=
-
n
j
v
ijv
j1
* 2
, j= 1, 2... J; (14)
d
i-=å ( )
=
- - n
j
v
ijv
j1
2
, i= 1, 2... J. (15) Step 5: The closeness coefficient of each alternative is calculated as:
CC
i =d d d
i i
i - -
*+
, i= 1, 2... J. (16)
Step 6; by comparing
CC
i values, the ranking of alternatives can be determined.6. UTAUT2-based Hierarchy
UTAUT2 (Venkatesh et al., 2012) not only underscores the main determinants influencing use intention but also allows researchers to analyze the unpredictable moderators that would amplify the effects of main determinants. Since UTAUT has been widely tested to be superior to other competing models (Park et al., 2007; Venkatesh &
Zhang, 2010), this study developed a hierarchy based on UTAUT2 theory.
6.1 Perceived Credibility
Several mobile banking studies related to use intention have verified that people refuse or are unwilling to use mobile banking mainly because of perceived credibility (Luarn & Lin, 2005; Dasgupta et al., 2011) or perceived risk (Riquelme & Rios, 2010; Dasgupta et al., 2011). Perceived credibility
was defined as the extent to which a person believes that the use of mobile banking will have no security or privacy threats (Yu, 2012). Through reviewing user’s attitudes toward online or mobile banking, perceived credibility has been empirically supported not only in mobile banking adoption studies but also in Internet banking studies. For example, Yu (2012) examined influencing factors to mobile banking use intention based on UTAUT, and the results showed that perceived credibility has a positive and significant effect on intention. Wang et al. (2003) introduced perceived credibility as a new factor to impact user’s acceptance of Internet banking. According to the results, perceived usefulness, perceived ease of use, and perceived credibility all had a significant effect on behavioral intention. Amin (2009) investigated the factors influencing online banking acceptance by adopting perceived credibility, perceived enjoyment, and social norm based on TAM model. Research results suggested that perceived credibility, perceived ease of use, and perceived usefulness were statistically significant to influence online banking use intention.
In addition, Dasgupta et al. (2011) investigated the antecedents to the behavioral intention of mobile banking usage in India by employing TAM and perceived credibility, perceived value. The results indicated that perceived credibility had a significant effect on mobile banking usage. Therefore, this study adopted perceived credibility as one of the main criteria.
Luarn & Lin (2005); Amin et al. (2008) proposed that security and privacy are two important dimensions of the structure of perceived credibility.
Security means that users believe their transactions through third-party payment are secured (Luarn &
Lin, 2005). Privacy represents that users believe that their privacy would not be divulged (Luarn &
Lin, 2005). Laforet & Li (2005) used security to express perceived risk and indicated that perceived risk was the most significant factors influencing the adoption intention of mobile banking. Thus, this study employed perceived credibility as the main criteria of TPP use intention and adopted security and privacy as two sub-criteria under the structure of perceived credibility.
6.2 Performance Expectancy
In UTAUT2, performance expectancy is driven by perceived usefulness, relative advantage, etc. It is defined as the degree to which using technology will provide benefits to consumers in performing certain activities (Venkatesh et al., 2003). Brown et al. (2003) empirically demonstrated that the greater the relative advantage, the more likely mobile banking would be adopted. Sripalawat et al. (2011), Dasgupta et al. (2011) also identified perceived usefulness as an important factor influencing individual intention to adopt mobile banking. Park et al. (2007) proved that performance expectancy significantly influences on user’s adoption intention of mobile technologies. Lu et al. (2009) employed UTAUT model and illustrated that performance expectancy significantly influence people to use mobile services. Therefore, we adopt performance expectancy as one of the main criteria for the goal.
Compatibility is the degree to which an innovation is perceived as being consistent with user’s values, needs, and past experiences of potential users (Moore & Benbasat, 1991). A
literature review of the IS suggests that compatibility is an important dimension that positively effects perceived usefulness or we say, performance expectancy, of the technology (Chau
& Hu, 2002; Wu & Wang, 2005). Effectiveness means the innovation would enhance user’s effectiveness in accessing work/services (Davis et al., 1989). And according to measurements of performance expectancy, Davis et al. (1989) illustrated it as “using a new technology would enhance my effectiveness in daily life or work efficiency.” Convenience was defined as a user’s perception of the time and effort required to use a new technology (Berry et al., 2002). According to (Venkatesh & Zhang, 2010) the measurements of performance expectancy is “using mobile banking would save my time.” Obviously, convenience is also viewed as another dimension of performance expectancy. Thus, we employed compatibility, effectiveness, and convenience as three sub-criteria under the structure of performance expectancy.
6.3 Price Value
Users usually are not willing to bear the monetary cost of a new technology (Venkatesh et al., 2012). The cost and pricing structure may have a significant effect on user’s technology use.
According to Dodds et al. (1991), price value is defined as consumer’s cognitive trade-off between the monetary cost and perceived benefits of the applications. Venkatesh et al. (2012) extend the UTAUT to examine acceptance and use of technology in a consumer context, in which they integrated hedonic motivation, price value, and habit into UTAUT for the first time. And the
results demonstrated that price value has a direct positive influence on behavioral intention. Until nowadays, even though few previous studies that examined price value variable in the context of mobile banking or online banking, due to the cultural difference, we believe that price value variable will present different results in Chinese TPP group and Korean TPP group. Thus, we adopted price value as the third main criteria.
In this study, we define monetary cost as “The actual money user cost when making a transaction through third-party payment (Dodds et al., 1991)”
and perceived benefits as “User’s perception of the time and effort required to use third-party payment (Berry et al., 2002).” If the benefits of using technology are perceived to be greater than the monetary cost, then the price value is positive and has a positive impact on the use intention.
Therefore, we employed monetary cost and perceived benefits as two sub-criteria under the structure of price value.
6.4 Social Influence
Social influence is the extent to which users perceived that important people (e.g., families and friends) believe he/she should use a particular technology (Venkatesh et al., 2003). Many previous studies have verified that social influence has a significant influence on behavior intention. For example, Zhou et al., (2010) proposed a mobile banking user adoption model by integrating TIF and UTAUT. They found that performance, social influence, task-technology fit, and facilitating conditions have significant impacts on user adoption.
Amin et al. (2008) found that individual intention to
use mobile banking was significantly affected by people surrounding them. Singh et al. (2010) discovered that friends or family members gave influence on user’s decisions to adopt mobile services. Thus, in this study, social influence is the fourth main criteria.
Awareness refers to the extent to which users are aware of the introduction of a particular technology (Charbaji & Mikdashi, 2003). Brown et al. (2005) indicated that increase of awareness could increase users’ belief that they should use the particular technology. According to Venkatesh et al.
(2003), the measurement of social influence is like
“People who are important to me gave me advice that I should use mobile banking.” Accordingly, in this study, awareness and advice were regarded as sub-criteria of social influence variable.
Based on the literature review of UTAUT2 and perceived credibility, we made a hierarchical structure model under one of the financial technology recently which is TPP environment that shown in <Fig 6-1>. The model includes four main criteria which are perceived credibility (C1), performance expectancy (C2), price value (C3), and social influence (C4), respectively. Under main criteria, there are nine sub-criteria under each of the constructs of main criteria, which is security, privacy for perceived credibility; compatibility, effectiveness, and convenience for performance expectancy; monetary cost and perceived benefits for price value; awareness and advice for social influence. <Tab. 6-1> demonstrates the operational definition of criteria as well the sub-criteria. Also, due to the cultural difference, Korean customers prefer to use credit cards to make online/offline purchase, while Chinese customers prefer cash
payment which has made the TPP unique. We believe that Chinese and Korean perspective about the use of TPP will be different. What is more, few studies have examined user’s adoption intention by conducting a comparative study between China and Korea; we conducted this research.
Tab. 6-1 Operational Definition of Criteria and Sub-Criteria
Fig 6-1 TPP Hierarchy for China and Korea
7. Application
In this study, we invited six experts from e-commerce related background, and all of them have used TPP for more than five years, three Chinese experts and three Korean experts, respectively. Experts from China are professors majored in marketing at Harbin Financial University in Harbin, China. Experts from Korea are professors majored in global business at Dongguk University in Korea. They were invited to define different weight vectors of the TPP system which possess a large market share in China and Korea. Systems in China are Alipay, WeChat Pay, Yifubao. Systems in Korea are Payco, K Pay, Kakao Pay. FAHP was proposed to consider the expert’s subjective judgments and to reduce the uncertainty and vagueness in the decision process. The first step was that each decision maker (
D
p), individually carry out pairwise comparison by using Saaty’s 1-9 scale (Chen, 2004), the results for Chinese professors were shown in <Tab. 7-1>.Tab. 7-1 Decision Maker’s Pairwise Comparison for China
Then, a comprehensive pairwise comparison matrix was built as shown in <Tab. 7-2> by integrating three decision makers’ evaluation through Eq. (17) (Chen et al., 2006). Through this method, decision makers’ pairwise comparison value were performed into fuzzy triangular members.
x
ij~
= (
a
ij,b
ij,c
ij)l
ij={ aijk}
min
k ,m
ij=å
= K
k
b
ojkk 1 1
,
u
ij={ dijk}
max
kTab. 7-2 Fuzzy Pairwise Comparison Matrix for China
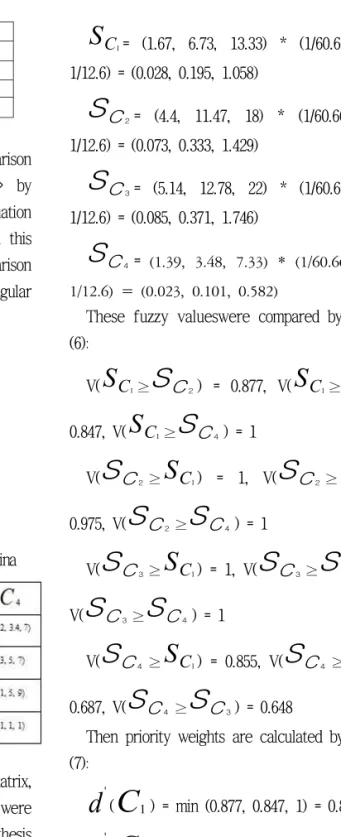
After acquiring fuzzy pairwise comparison matrix, weights of all criteria and sub-criteria were determined via FAHP method. First of all, synthesis values should be calculated. According to <Tab.
7-2>, synthesis values respect to main goal were calculated through Eq. (1):
S
C1= (1.67, 6.73, 13.33) * (1/60.66, 1/34.46, 1/12.6) = (0.028, 0.195, 1.058)S
C2= (4.4, 11.47, 18) * (1/60.66, 1/34.46, 1/12.6) = (0.073, 0.333, 1.429)S
C3= (5.14, 12.78, 22) * (1/60.66, 1/34.46, 1/12.6) = (0.085, 0.371, 1.746)S
C4= (1.39, 3.48, 7.33) * (1/60.66, 1/34.46, 1/12.6) = (0.023, 0.101, 0.582)These fuzzy valueswere compared by using Eq.
(6):
V(
S
C1≥S
C2) = 0.877, V(S
C1≥S
C3) =0.847, V(
S
C1≥S
C4) = 1V(
S
C2≥S
C1) = 1, V(S
C2≥S
C3) =0.975, V(
S
C2≥S
C4) = 1V(
S
C3≥S
C1) = 1, V(S
C3≥S
C2 ) = 1,V(
S
C3≥S
C4) = 1V(
S
C4≥S
C1) = 0.855, V(S
C4≥S
C2) =0.687, V(
S
C4≥S
C3) = 0.648Then priority weights are calculated by using Eq.
(7):
d
'(C
1) = min (0.877, 0.847, 1) = 0.847d
'(C
2) = min (1, 0.975, 1) =0.975d
'(C
3) = min (1, 1, 1) = 1d
'(C
4) = (0.855, 0.687, 0.648) = 0.648Priority weights form
W
'= (0.847, 0.975, 1, 0.648) vector. After the normalization of these values priority weights respect to main goal were calculated as (0.243, 0.280, 0.287, and 0.186). Then, the weights of sub-criteria were calculated similarly.Weights of sub-criteria for China were shown in
<Tab. 7-3>
Tab. 7-3 Normalized Weights Vectors of Sub-Criteria for China
After calculating weights of main criteria and sub-criteria of China, the weights of criteria and sub-criteria for Korea can be calculated using the same process in China. The pairwise comparison of three Korean decision-makers is shown in <Tab.
7-4>:
Tab. 7-4 Decision Makers’ Pairwise Comparison for Korea
Then weights of main criteria and sub-criteria can be obtained through the same process with China. The results were shown in <Tab. 7-5>.
Finally, <Tab. 7-6> shows a comparison results about weight between China and Korea.
Tab. 7-5 Normalized Weights Vectors of Main Criteria and Sub-criteria for Korea
CriteriaMain Sub-criteria Normalized Weights of sub-criteria Perceived
Credibility Security 0.543
Privacy 0.457
Performance Expectancy
Compatibility 0.331 Effectiveness 0.331
Convenience 0.338
Price Value Monetary Cost 0.521 Perceived
Benefits 0.479
Social
Influence Awareness 0.513
Advice 0.487
Tab. 7-6 A Comparison of Weights between China and Korea
After weights of criteria and sub-criteria were calculated, normalization of these values was made via Eq. (10). Then, the weighted normalized matrix was formed by multiplying each value by their weights. The weights of each main criterion for China and Korea were shown in <Tab. 7-7>
Positive and negative ideal solution are determined by taking the maximum and minimum values for each criterion:
Positive and negative ideal solution for China:
A
*= {0.2965, 0.3612, 0.2899, 0.1934} maximum valuesA
-= (0.0989, 0.1792, 0.1636, 0.0688) minimum valuesPositive and negative ideal solution for Korea:
A
*= {0.3864, 0.2390, 0.2506, 0.2419} maximum valuesA
-= (0.1484, 0.1194, 0.1252, 0.1037) minimum valuesThen the distance of each TPP company from PIS and NIS with respect to each criterion were calculated with the help of Eqs. (14) and (15). Then closeness coefficient of each company was calculated by using Eq. (16) and the ranking of the companies were determined according to these values. The ranking of the TPP companies were shown in <Tab. 7-8>.
Tab. 7-7 Total Weighted Values of Main Criteria
Tab. 7-8 Ranking of TPP According to CCi Values
8. Conclusion
Comparing the results of <Tab. 7-6> we can conclude that, there exist differences about the perspective on the TPP adoption intention between Chinese and Korean. For Chinese, price value was the most significant factor when considering using a particular technology. Then followed by performance expectancy, perceived credibility and social influence in order. This may because most of
the TPP platform are charging transaction fee nowadays that lead to the competition more fiercely. In addition, when shopping on Internet, the more the consumers get, such as coupon, the greater use intention they will acquire. While for Korean, perceived credibility was the most important reason. That means their security and privacy are much more vital than any other things.
Then followed by price value, social influence and performance expectancy. For both of Chinese and Korean, security is more important than privacy because they care about the direction in which their transaction went. The perspectives on compatibility, effectiveness, and convenience were similar to each other. For social influence, Korean were significantly influenced by way of thinking by themselves.
The proposed methodology is used in determining the ranking of the factors influencing use intention of third-party payment platform and the firms in the same sector. Different from other studies is that we conducted a unique comparative study of Chinese perspective and Korean perspective. The results may give a new insight to both of the researchers and managers in the third-party payment companies.
This paper contributes to the academic research by providing a unique methodology for determining the importance of factors influencing use intention in the TPP context. We obtained different ranking orders of the determinants as well as the TPP systems. Also, since a little research has examined use intention by comparing countries, the comparative study of China and Korea that conducted in this study provided a new insight for both of the researchers in the e-commerce field
and managers in the TPP companies and mobile banking aspect. Despite the contributions, this study exists some limitations. First of all, three decision makers determined to conduct pairwise comparison by from two countries, respectively, it may exist personal bias and may not represent all of the user’s perspective. Secondly, according to previous studies, there are many important influencing factors when considering behavior intention, but we only adopted four criteria in this study. It is better to employ more other criteria. Thirdly, we only adopted three TPP companies which possess relative more market share, it may not respond the real situation of the small companies. Thus, future studies should consider more companies that possess small market share.
Reference
[1] Albayrak, E., and Erensal, Y. C. (2004), Using Analytic Hierarchy Process (AHP) to improve human performance. An application of multiple-criteria decision making problem, Journal of Intelligent Manufacturing, 15(4), 491-503.
[2] Amin, H. (2009). An analysis of online banking usage intentions: An extension of the Technology Acceptance Model, International Journal of Business and Society, 10(1), 27-40.
[3] Amin, H. M., Hamid, R., A., Lada, S., and Anis, Z.
(2008). The adoption of mobile banking in Malaysia:
The case of Bank Islam Malaysia Berhad, International Journal of Business and Society, 9(2), 43-53.
[4] Barberis, J. (2014), The Rise of FinTech: Getting Hong Kong to Lead the Digital Financial Transition in APAC, FinTech Report, FinTech HK.
[5] Benitez, J. M., Martin, J. C., and Roman, C. (2007), Using Fuzzy number for measuring quality of service in the hotel industry, Tourism Management, 28(2), 544-555.
[6] Berry, L. L., Seiders, K., and Grewal, D. (2002), Understanding service convenience, Journal of Marketing, 66(3), 1-17.
[7] Bojadziev, G., and Bojadziev, M. (1998), Fuzzy Sets Fuzzy Logic Applications, Singapore: World Scientific Publishing.
[8] Brown, I. Cajee, Z., Davies, D. (2003), Cell phone banking: Predictors of adoption in South Africa-An exploratory study, International Journal of Information Management, 23(5), 381-394.
[9] Brown, S. A., and Venkatesh, V. (2005), Model of adoption of technology in the Household: A baseline model test and extension incorporating Household life cycle, MIS Quarterly, 29(4), 399-426.
[10] Chang, D. Y. (1996), Applications of the extent analysis method on Fuzzy AHP, European Journal of Operational Research, 95(3), 649-655.
[11] Charbaji, A., Mikdashi, T. (2003), A path analytic study of the attitude toward e-government in Lebanon, Corporate Governance, 3(1), 76-82.
[12] Chau, P. Y. L., and Hu, P. J. (2002), Examining a model of information technology acceptance by individual professionals: An exploratory study, Journal of Management Information Systems, 18(4), 191-229.
[13] Chen, C. T., Lin, C. T., and Huang, S. F. (2006), A Fuzzy approach for supplier evaluation and selection in supply chain management, International Journal of Production Economics, 102(2), 289-301.
[14] Davis, F. D., Bagozzi, R. P., and Warshaw, P. R.
(1989), User acceptance of computer technology: A comparison of two theoretical models, Management
Science, 35(8), 982-1003.
[15] Dasgupta, S., Paul, R. I. K., Fuloria, S. (2011), Factors affecting behavioral intentions towards mobile banking usage: Empirical evidence from India, Romanian Journal of Marketing, 3(1), 6-28.
[16] Deng, H. (1999), Multi-criteria analysis with Fuzzy pairwise comparison, International Journal of Approximate Reasoning, 21(2), 726-731.
[17] Dodds, W. B., Monroe, K. B., and Grewal, D. (1991), Effects of price, brand, and store information on buyers, Journal of Marketing Research, 28(3), 307-319.
[18] Gilbert, D., Balestrini, P., and Littleboy, D. (2004), Barriers and benefits in the adoption of e-government, International Journal of Public Sector Management, 17(4), 286-301.
[19] Kahraman, C., Ruan, D., and Dogan, I. (2003), Fuzzy group decision making for facility location selection, Information Sciences, 157, 135-153.
[20] Laforet, S., and Li, X. (2005), Consumers’ attitudes towards online and mobile banking in China, International Journal of Bank Marketing, 23(5), 362-380.
[21] Limayem, M., Hirt, S. G., and Cheung, C. M. K.
(2007), How habit limits the predictive power of intentions: The case of IS continuance, MIS Quarterly, 31(4), 705-737.
[22] Luarn, P., and Lin, H. H. (2005). Toward an understanding of the behavioral intention to use mobile banking, Computers Human Behavior, 21(6), 873-891.
[23] Lu, J., Yu, C. S., and Liu, C. (2009), Mobile data service demographics in Urban China, The Journal of Computer Information Systems, 50(2), 117-126.
[24] Moore, G. C., Benbasat, I. (1991), Development of an instrument to measure the perceptions of
adopting an information technology innovation, Information Systems Research, 2(3), 192-222.
[25] Park, J. K., Yang, S. J., and Lehto, X. (2007).
Adoption of mobile technologies for Chinese consumers, Journal of Electronic Commerce Research, 18(3), 196-206.
[26] Riquelme, H., Rios, R. E. (2010), The moderating effect of gender in the adoption of mobile banking, International Journal of Bank Marketing, 28(5), 328-341.
[27] Saaty, T. L. (1980). The analytic hierarchy process, New York: McGraw-Hill.
[28] Shim, Y., Shin, D. H. (2015), Analyzing the development of 4th generation mobile network in China: Actor network theory perspective, Digital Policy, Regulation and Governance, 17(1), 22-38.
[29] Singh, S., Srivastava, V., and Srivastava, R. K.
(2010), Customer acceptance of mobile banking: A conceptual Framework, SIES Journal of Management, 7(1), 55-64.
[30] Sripalawat, J., Thongmak, M., and Ngramyarn, A.
(2011), M-banking in metropolitan Bangkok and a comparison with other countries, The Journal of Computer Information Systems, 51(3), 67-76.
[31] Venkatesh, V., Morris, M. G., Davis, G. B., Davis, F. D. (2003), User acceptance of information technology: Toward a unified view, MIS Quarterly, 27(3), 425-478.
[32] Venkatesh, V., and Zhang, X. (2010), Unified Theory of Acceptance and Use of Technology: U.S. vs.
China, Journal of Global Information Technology Management, 13(1), 5-27.
[33] Venkatesh., V., Thong, Y. L., and Xu, X. (2012).
Consumer acceptance and use of information technology: Extending the Unified Theory of Acceptance and Use of Technology, MIS Quarterly,
36(1), 157-178.
[34] Wang, Y. S., Wang, Y. M., Lin, H. H., and Tang, T. I. (2003), Determinants of user acceptance of Internet banking: An empirical study, International Journal of Service Industry Management, 14(5), 501-519.
[35] Wang, S., Archer, N. P., and Zheng, W. (2006). An exploratory study of electronic marketplace adoption: A multiple perspective view, Electronic Markets, 16(4), 337-348.
[36] Wang, Y. J. (2008), Applying FMCDM to evaluate financial performance of domestic airlines in Taiwan, Expert Systems with Applications, 34(3), 1837-1845.
[37] Wu, J. H., and Wang, S. C. (2005). What drives mobile commerce? An empirical evaluation of the Revised Technology Acceptance Model, Information
& Management, 5(5), 719-729.
[38] Yoon, K., Hwang, C. L. (1985). Manufacturing plant location analysis by multiple attribute decision making: Part II. Multi-plant strategy and plant relocation, International Journal of Production Research, 23(2), 361-370.
[39] Yu, C. S. (2012), Factors affecting individuals to adopt mobile banking: Empirical evidence from the UTAUT model, Journal of Electronic Commerce Research, 13(2), 104-121.
[40] Zadeh, L. A. (1965), Fuzzy Sets, Information and Control, 8(3), 338-353.
[41] Zhou, T., Lu, Y., Wang, B. (2010), Integrating TIF and UTAUT to explain mobile banking users adoption, Computers in Human Behavior, 26(4), 760-767.
Mu, Hong-Lei ([email protected])
Mu, Hong-Lei is a doctoral degree student at the Global Business Cooperate Course, graduate school of Dongguk University, Korea. She received the degree of master of business administration from Dongguk University, too. Her research interests include FinTech, data mining, and social media etc.
Lee, Young-Chan ([email protected])
Dr. Young-Chan Lee is a Professor of Department of Business Administration at Dongguk University, GyeongJu, Korea. Dr. Lee received a Ph.D. degree in Management Science in Department of Business Administration from Sogang University, Seoul, Korea. Dr. Lee has published papers in top international journals such as Human Factors in Ergonomics and Manufacturing, Information Systems Management, Knowledge-Based Systems, Expert Systems with Applications, European Journal of Operational Research, and so on. And he also has published tens of books, and won a lot of research fund and participated in various governmental projects. He was awarded as Most Cited Papers in Expert Systems with Applications in 2010 and also was awarded as Best Paper of Korea Association of Information Systems in 2009 and 2010 successively and Korea Academic Society of Business Administration in 2016. His research interests are in the system dynamics, big data, data mining, artificial intelligence, and multi-criteria decision making.
* 동국대학교 경주캠퍼스 글로벌비즈니스 전공, 박사과정. [email protected]
**동국대학교 경주캠퍼스 경영학부 교수. [email protected]
FinTech 채택 의도에 영향을 미치는 요소의 순위 결정을 위한 Fuzzy AHP 및 TOPSIS 방법론의 적용
: 중국과 한국의 비교 연구
무홍레이*, 이영찬**
요약
ㄴ
핀테크는 금융 문맹 퇴치 및 투자, 소매 금융, 그리고 비트코인 (bitcoin)과 같은 암호 화폐 등 혁신적인 정보기술을 활용한 새로운 금융 서비스 분야이다. 특히 온라인/모바일 시스템이 오프라인 금융 시스템을 대체하면서 제 3 자 온라 인 지불 서비스가 빠르게 성장하고 있다. 한편, 시스템 품질 및 사용자 태도는 제 3 자 지불 서비스 사용을 유도하는 핵심 요인이지만 이러한 요인의 중요성에 대한 인식은 국가마다 상이할 수 있다. 본 연구의 목적은 기술의 수용과 사 용에 대한 통합 이론 (UTAUT2)을 바탕으로 중국과 한국의 제3자 온라인/모바일 지불 서비스 채택 요인이 어떻게 다른 지를 밝히는 것이다. 이를 위해 본 연구에서는 계층분석과정(analytic hierarchy process: AHP), 퍼지 집합 및 TOPSIS를 활용하여 제 3 자 온라인/모바일 지불 시스템 채택 요인들을 파악하고 상대적인 중요도를 평가하고자 한다. 분석 결과 중국인의 경우 가격이 채택 의도에 가장 큰 영향을 미치는 반면, 한국인의 경우 지각된 신뢰가 채택 의도에 가장 중 요한 영향을 미친다는 것을 알 수 있었으며 하위 기준에서도 역시 중국과 한국에 차이가 있음을 확인할 수 있었다.
표제어: UTAUT, 다기준 의사 결정, 계층분석과정, AHP, TOPSIS, 퍼지, Fuzzy, 핀테크, FinTech