ISSN 2234-3806 • eISSN 2234-3814
https://doi.org/10.3343/alm.2019.39.4.381
Comparison of Six Automated Immunoassays With
Isotope-Diluted Liquid Chromatography–Tandem Mass Spectrometry for Total Thyroxine Measurement
Songlin Yu, M.D.1*, Weiyan Zhou, Ph.D.2*, Xinqi Cheng, M.D.1, Qinghui Meng, M.D.3, Honglei Li, B.D.1, Li’an Hou, B.D.1, Jun Lu, B.D.1, Shaowei Xie, B.D.1, Qian Cheng, B.D.1, Chuanbao Zhang, M.D.2, and Ling Qiu , M.D.1
1Department of Clinical Laboratory, Peking Union Medical College Hospital, Chinese Academy of Medical Sciences, Beijing, China; 2National Center for Clinical Laboratories, Beijing Hospital, National Center for Gerontology, Beijing Engineering Research Center of Laboratory Medicine, Beijing, China;
3Department of Clinical Laboratory, The Affiliated Hospital of Qingdao University, Qingdao, China
Background: Accurate serum total thyroxine (TT4) measurement is important for thyroid disorder diagnosis and management. We compared the performance of six automated im- munoassays with that of isotope-diluted liquid chromatography-tandem mass spectrome- try (ID-LC-MS/MS) as the reference method. We also evaluated the correlation of thyroid stimulating hormone (TSH) with TT4 measured by ID-LC-MS/MS and immunoassays.
Methods: Serum was collected from 156 patients between October 2015 and January 2016. TT4 was measured by immunoassays from Abbott (Architect), Siemens (ADVIA Centaur XP), Roche (E601), Beckman-Coulter (Dxi800), Autobio (Autolumo A2000), and Mindray (CL-1000i), and by ID-LC-MS/MS. Results were analyzed using Passing–Bablok regression and Bland–Altman plots. Minimum requirements based on biological variation were as follows: a mean bias of ≤4.5% and total imprecision (CV) of ≤3.7%.
Results: All immunoassays showed a correlation >0.945 with ID-LC-MS/MS; however, the slope of the Passing–Bablok regression line varied from 0.886 (Mindray) to 1.23 (Siemens) and the intercept from -12.8 (Siemens) to 4.61 (Mindray). Only Autobio, Beckman-Coul- ter, and Roche included the value of one in the 95% confidence interval for slope. The mean bias ranged from -10.8% (Abbott) to 9.0% (Siemens), with the lowest value noted for Roche (3.5%) and the highest for Abbott (-10.8%). Only Abbott and Roche showed within-run and total CV ≤3.7%.
Conclusions: Though all immunoassays correlated strongly with ID-LC-MS/MS, most did not meet the minimum clinical requirement. Laboratories and immunoassay manufactur- ers must be aware of these limitations.
Key Words: Immunoassay, Isotope-diluted liquid chromatography tandem mass spectrom- etry, Thyroxine, Evaluation, Performance
Received: May 20, 2018
Revision received: October 22, 2018 Accepted: January 29, 2019 Corresponding author: Ling Qiu, M.D.
https://orcid.org/0000-0002-0734-8144 Department of Clinical Laboratory, Peking Union Medical College Hospital Chinese Academy of Medical Sciences, No. 1 Shuaifu Yuan, Dongsheng, Beijing 100730, China
Tel: +86-01069159707 Fax: +86-01069159712 E-mail: [email protected]
* These authors contributed equally to this study.
© Korean Society for Laboratory Medicine This is an Open Access article distributed under the terms of the Creative Commons Attribution Non-Commercial License (http://creativecom- mons.org/licenses/by-nc/4.0) which permits unrestricted non-commercial use, distribution, and reproduction in any medium, provided the original work is properly cited.
INTRODUCTION
Thyroid hormones are important for regulating biological pro- cesses, including growth, metabolism, and neural development [1-4]. Thyroxine (T4) is secreted by the thyroid gland and acts
as a prohormone that is transported in the bloodstream to pe- ripheral tissues, where it is converted into other forms, such as 3,3’,5-triiodo-L-thyronine (T3). In serum, most T4 is bound to proteins, and only about 0.02% circulates in the free form (FT4) [4]. Although FT4 measurements are considered more impor-
2017-03-16 https://crossmark-cdn.crossref.org/widget/v2.0/logos/CROSSMARK_Color_square.svg
tant than total (T)T4 measurements as FT4 is the active form, TT4 measurements are useful for detecting subclinical hypothy- roidism or cases of severe hyperthyroidism [4]. Serum TT4 may be more diagnostically relevant than FT4 for evaluating diseased patients and is associated with disease severity [4]. The total rather than the free hormone fraction is acknowledged as the ideal diagnostic measure [5] because of the significant bias of results among FT4 detection methods (-42%) [6]. Moreover, for economical and traditional reasons, TT4 is still widely used in clinical practice, and even the most recently developed auto- mated test systems include TT4.
Since 1970s, various TT4 detection methods, including radio- immunoassay, ELISA, and the most commonly used chemilumi- nescent immunoassay, have been developed by major manu- facturers, such as Abbott, Beckman-Coulter, Roche, and Sie- mens. Some large Chinese in-vitro diagnostics manufacturers, such as Autobio and Mindray, have also developed TT4 detec- tion systems. However, all these methods are antigen–antibody- based, and interference from non-specific reaction may lead to false results [7]. Moreover, little attention was paid to harmoni- zation or standardization of TT4 detection systems previously [6, 8-10]. Only Thienpont et al. [8] compared 11 immunoassays for TT4 in 2010. However, there have been major developments on the standardization of TT4 tests since then. The Joint Commit- tee for Traceability in Laboratory Medicine has established refer- ence materials and methods based on isotope-diluted liquid chromatography-tandem mass spectrometry (ID-LC-MS/MS) [11, 12]. However, it is unknown whether these have improved the performance of TT4 immunoassays from different manufac- turers. One study reported a weak correlation between log thy- roid-stimulating hormone (TSH) and TT4 (R=0.25) [10]; how- ever, FT4 measured by ID-LC-MS/MS showed a stronger corre- lation with log TSH than that measured by immunoassays [13, 14]. Hence, we compared the performance of six automated immunoassays with that of ID-LC-MS/MS as a reference method and assessed the correlation of TT4 with log TSH measured by ID-LC-MS/MS and the immunoassays.
METHODS
Subjects and sample collection
This was a cross-sectional study. Between October 2015 and January 2016, serum samples were collected from 156 inpa- tients, including 31 males and 125 females (median age: 40 years, range: 9–91 years), who requested TT4 measurement, at Peking Union Medical College Hospital, Beijing, China. The sam-
ples were from cases of hyperthyroidism (N=40), postoperative thyroid cancer (N=18), hypothyroidism (N=15), thyroid nodule (N =14), pregnant women (N =14), and others (N =55). The study was approved by the Ethics Committee of Peking Union Medical College Hospital (ZS-984). All patients involved were made aware of the intended use of their samples and provided written consent. Experiments were carried out in accordance with the Declaration of Helsinki (2013 revision).
Serum was collected in VACUETTE tubes with separator gel and clot activator (Greiner Bio-One, Kremsmunster, Austria). Each sample was divided into seven aliquots, which were stored at -80°C until analysis within a month. A freshly thawed aliquot was used for each analytical run. ADVIA Centaur XP (Siemens, Munich, Germany) was employed to select samples that had TT4 concentrations evenly distributed between 1.3 and 387 nmol/L, and without hemolysis, icterus, or lipemia.
Assays
TT4 was measured using six automated chemiluminescent im- munoassays—Architect 4000 (Abbott Diagnostics, Lake Forest, IL, USA), DXI800 (Beckman-Coulter, Brea, CA, USA), E601 (Ro- che Diagnostics, Basel, Switzerland), ADVIA Centaur XP (Sie- mens, Munich, Germany), Autolumo A2000 (Autobio, Zheng- zhou, China), and CL-1000i (Mindray, Shenzhen, China)—as well as ID-LC-MS/MS. All immunoassays were carried out in the clinical laboratory of Peking Union Medical College Hospital in a blinded manner, with different experienced operators for each.
ID-LC-MS/MS was carried out at the National Center for Clinical Laboratory in China, on an API 4000 triple quadrupole mass spectrometer (AB Sciex, Framingham, MA, USA) coupled with an Agilent 1200 LC system (Agilent Technologies, Santa Clara, CA, USA) and equipped with Analyst 1.4.2 software (AB Sciex) [13].
TT4 measurement
Serum samples or calibrators were sampled by weight, and
13C6-T4 internal standards were added volumetrically using au- tomated diluters, followed by equilibration. Then, 1 mL of meth- anol (0.1% formic acid) was added to precipitate the protein, and the mixture was centrifuged at 3,000 ×g for 15 minutes.
The upper layer was transferred to the cation exchange column.
Cation exchange solid-phase extraction was performed using a mixed-mode cation exchange column (Oasis MCX 1 mL, 30 mg;
Waters, Milford, MA, USA). The solid-phase extraction cartridge was conditioned by washing with methanol and water. Then, it was washed with 1 mL of a 2% aqueous solution of formic acid
and 1 mL of methanol. Next, T4 and the internal standard were eluted from the cartridge with 1 mL of 5% ammonium hydrox- ide. The eluates were evaporated to dryness under nitrogen, and the residues were reconstituted in 400 µL of mobile phase, 20 µL of which was loaded into the ID-LC-MS/MS system. HPLC sepa- ration was carried out with a Zorbax Eclipse XDB C18 column (5 µm, 2.1 ×150 mm; Waters) and a mobile phase consisting of 0.05% formic acid in water–methanol (30:70) at a flow rate of 0.3 mL/min. MS detection was carried out using the positive electrospray ionization mode with multiple reaction monitoring.
Quantitative ion pair transitions were m/z 777.7→731.6 and m/z 783.7→737.6 for T4 and 13C6-T4, respectively. Qualitative ion pair transitions at m/z 783.7→639.8 and m/z 783.7→639.8 for T4 and 13C6-T4, respectively, were monitored for confirmation.
Each sample was injected three times, and average peak area ratios were calculated to quantify T4 concentration in the un- known sample by bracketing calibrations.
Certified reference materials for TT4 (CRM21201 and CRM- 20202) were provided by Professor Lothar Siekmann of the Ger- man Society of Clinical Chemistry and Laboratory Medicine (DGKL).
The CRMs were lyophilized human serum samples and were dissolved in 3 mL deionized water. The CRMs were measured in three runs, and with triplicate measurements in each run.
Immunoassays were carried out with the following reagent lots for TT4: 55935UI00 (Abbott), 527911 (Beckman-Coulter), 188364 (Roche), 04003169 (Siemens), 20151121 (Autobio), and 150701 (Mindray). The calibrator lots were: 7K66-01 (Abbott), 2015101503 (Autobio), 33805 (Beckman-Coulter), 20150901 (Mindray), 18150202 (Roche), and 53803A86 (Siemens). Detailed infor- mation on the immunoassays is presented in Supplemental Data Table S1. TSH concentration was measured by the Cen- taur assay (Siemens) using the TSH reagent produced by Sie- mens.
In addition, three serum pools from Bio-Rad (Hercules, CA, USA; lot 40300, levels 40301, 40302, and 40303) that were used as quality control materials were prepared for assessing immunoassay imprecision prior to comparisons. Following the CLSI EP15-A [15], on five consecutive days, one freshly thawed aliquot of each pool was measured four times by all immunoas- says. We ensured that measurement performance met the qual- ity control standard before proceeding with measurements.
Performance criteria
Performance criteria were set on the basis of biological variation, which is often used to evaluate whether an assay is analytically acceptable [16]. With this approach, using the within- and be-
tween-subject biological variation (CVw=within-subject biologi- cal variation, CVg=between-subject biological variation) for TT4 from Westgard [17] (4.9 and 10.9, respectively), the minimum requirements for TT4 assays were as follows: a mean bias of
≤4.5% [0.375 (CVw2+CVg2)1/2] and imprecision of ≤3.7% (0.75CVw) [18].
Statistical analysis
The TT4 results analyzed by different methods were summa- rized as mean±SD, and CV of the methods was calculated us- ing a one-way ANOVA. In addition, TT4 results from different methods were analyzed using Passing–Bablok regression and Bland–Altman plots. Passing–Bablok regression, which was used to evaluate method agreement, calculates a regression equation (y =ax+b), including 95% confidence intervals (CIs), for the proportional (a, slope) and constant (b, intercept) errors [19]. If the 95% CI for intercept includes the value zero, there is no constant difference between two methods; if the 95% CI for slope includes the value one, there is no proportional difference between two methods [19]. The bias between two methods was evaluated using Bland–Altman plots, which quantify agreement between two quantitative measurements by constructing limits of agreement [20]. Linearity was tested using the cumulative sum (Cusum) linearity test, which is used to evaluate whether residuals are randomly scattered around the regression line with- out a significant trend. The correlation between TT4 and TSH was evaluated using linear regression. P <0.05 indicated a sig- nificant deviation from linearity. Statistical analyses were carried out using MedCalc v. 13.3.3 (MedCalc Software, Ostend, Bel- gium) and Microsoft Excel 2007 (Microsoft Corporation, Red- mond, WA, USA).
RESULTS
Performance of ID-LC-MS/MS
We evaluated the imprecision of ID-LC-MS/MS by measuring left-over serum samples in three analytical runs, with triplicate measurements in each run. The samples were from seven patients with T4 concentrations ranging from 20.87 to 245.55 nmol/L.
For each concentration, the within-run, between-run, and total CVs were 0.60% (0.35–0.89%), 0.54% (0.27–1.23%), and 0.84% (0.57–1.37%), respectively.
For CRM21201 and CRM20202, the mean TT4 concentra- tion measured by ID-LC-MS/MS was 120.74 nmol/L and 88.70 nmol/L, and the bias against target values (120.90 nmol/L and 88.05 nmol/L) was -0.13% and 0.73%, respectively.
This method was used to participate in the 2011, 2012, 2014, and 2016 International Federation of Clinical Chemistry and Lab- oratory Medicine (IFCC) reference measurement comparison (Ring trials or Rela) schemes. Our laboratory code was 18. In the four-time comparison, the average difference between the results of our method, and the results from the DGKL reference measurement laboratory (code 1) was <1%.
Three vials of 57.55 nmol/L frozen serum samples were com- bined, and twelve 0.2 mL aliquots were taken for testing the ac- curacy of the method. Unlabeled TT4 was added to nine of the 12 aliquots: three each with 29, 58, and 116 nmol/L TT4. No TT4 was added to the other three aliquots. The aliquots were then processed and tested by ID-LC-MS/MS. The amounts of TT4 added and recovered were in very good agreement for all
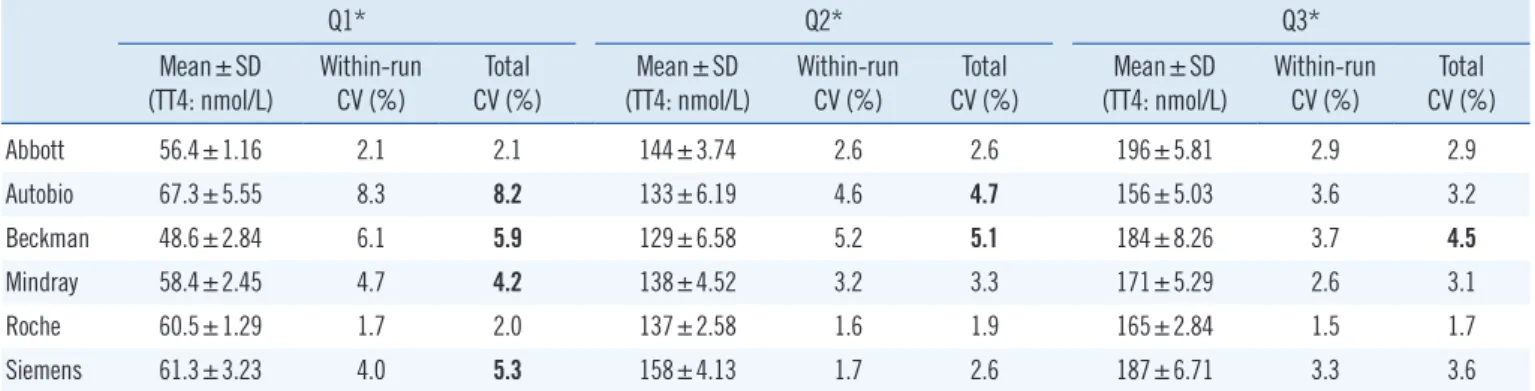
Table 1. Imprecision evaluation for TT4 (measured four times per day for five consecutive days)
Q1* Q2* Q3*
Mean±SD
(TT4: nmol/L) Within-run
CV (%) Total
CV (%) Mean±SD
(TT4: nmol/L) Within-run
CV (%) Total
CV (%) Mean±SD
(TT4: nmol/L) Within-run
CV (%) Total CV (%)
Abbott 56.4±1.16 2.1 2.1 144±3.74 2.6 2.6 196±5.81 2.9 2.9
Autobio 67.3±5.55 8.3 8.2 133±6.19 4.6 4.7 156±5.03 3.6 3.2
Beckman 48.6±2.84 6.1 5.9 129±6.58 5.2 5.1 184±8.26 3.7 4.5
Mindray 58.4±2.45 4.7 4.2 138±4.52 3.2 3.3 171±5.29 2.6 3.1
Roche 60.5±1.29 1.7 2.0 137±2.58 1.6 1.9 165±2.84 1.5 1.7
Siemens 61.3±3.23 4.0 5.3 158±4.13 1.7 2.6 187±6.71 3.3 3.6
*Q1, Q2, and Q3 were quality controls based on serum pools purchased from Bio-Rad (Hercules, CA, USA; lot 40300, levels 40301, 40302, and 40303).
CVs that exceeded the defined criterion (3.7%) are shown in bold [22].
Abbreviations: TT4, total thyroxine; CI, confidence interval.
Fig. 1. Passing–Bablok regression analyses between immunoassays (A, Abbott; B, Autobio; C, Beckman-Coulter; D, Mindray; E, Roche; F, Siemens) and ID-LC-MS/MS. Solid black line: Passing–Bablok regression line, dashed brownish red lines: 95% CI for the regression line, dotted blue line: identity line (x=y).
Abbreviations: TT4, total thyroxine; ID-LC-MS/MS, isotope-diluted liquid chromatography-tandem mass spectrometry; CI, confidence interval.
350 300 250 200 150 100 50 0
0 50 100 150 200 250 300 350 400 TT4 (nmol/L) ID-LC-MS/MS
TT4 (nmol/L) Abbott
y=0.936x-7.42 95% CI for slope: 0.904 to 0.966;
95% CI for intercept: -12.1 to -3.17;
Cusum test for linearity: P <0.01
A
350 300 250 200 150 100 50 0
0 50 100 150 200 250 300 350 400 TT4 (nmol/L) ID-LC-MS/MS
TT4 (nmol/L) Autobio
y=1.00x-7.58 95% CI for slope: 0.967 to 1.04;
95% CI for intercept: -11.8 to -4.06;
Cusum test for linearity: P =0.01
B
400 350 300 250 200 150 100 50 0
0 100 200 300 400 TT4 (nmol/L) ID-LC-MS/MS
TT4 (nmol/L) Beckman-Coulter
y=1.05x+1.41 95% CI for slope: 1.00 to 1.11;
95% CI for intercept: -4.04 to 5.39;
Cusum test for linearity: P =0.39
C
350 300 250 200 150 100 50 0
0 50 100 150 200 250 300 350 400 TT4 (nmol/L) ID-LC-MS/MS
TT4 (nmol/L) Mindray
y=0.889x+4.61 95% CI for slope: 0.864 to 0.916;
95% CI for intercept: 2.60 to 7.17;
Cusum test for linearity: P =0.21
D
350 300 250 200 150 100 50 0
0 50 100 150 200 250 300 350 400 TT4 (nmol/L) ID-LC-MS/MS
TT4 (nmol/L) Roche
y=0.978x+3.22 95% CI for slope: 0.957 to 1.00;
95% CI for intercept: 0.956 to 5.54;
Cusum test for linearity: P =0.30
E
400 350 300 250 200 150 100 50 0
0 50 100 150 200 250 300 350 TT4 (nmol/L) ID-LC-MS/MS
TT4 (nmol/L) Siemens
y=1.23x-12.8 95% CI for slope: 1.19 to 1.25;
95% CI for intercept: -16.4 to -10.2;
Cusum test for linearity: P =0.01
F
three concentrations, with mean recoveries of 100.7% (100.1–
101.0%), 99.6% (99.2–100.5%), and 99.9% (99.5–100.7%), respectively.
Performance of the six immunoassays
Imprecision evaluation showed that all methods had within-run CV and total CV for TT4<10% (Table 1). However, only Abbott
and Roche showed acceptable CV (≤3.7%) in all samples, Au- tobio and Mindray produced relatively high CVs at the lower con- centrations, and Beckman-Coulter assay results exceeded the criteria for all three concentrations (Table 1).
Comparison of TT4 detection results
To compare the results of immunoassays and ID-LC-MS/MS, we
Table 2. Correlation between TT4 and TSH
TSH Log TSH
Correlation (R) 95% CI P Correlation (R) 95% CI P
TT4 ID-LC-MS/MS -0.371 -0.516− -0.206 <0.001 -0.743 -0.813− -0.651 <0.001
Abbott -0.347 -0.496− -0.178 <0.001 -0.777 -0.840− -0.694 <0.001
Autobio -0.387 -0.530− -0.222 <0.001 -0.778 -0.840− -0.695 <0.001
Beckman -0.391 -0.534− -0.227 <0.001 -0.738 -0.819− -0.643 <0.001
Mindray -0.382 -0.524− -0.218 <0.001 -0.771 -0.835− -0.687 <0.001
Roche -0.389 -0.531− -0.226 <0.001 -0.779 -0.841− -0.698 <0.001
Siemens -0.394 -0.537− -0.229 <0.001 -0.750 -0.820− -0.658 <0.001
Abbreviations: TT4, total thyroxine; CI, confidence interval; ID-LC-MS/MS, isotope-diluted liquid chromatography-tandem mass spectrometry; TSH, thyroid stimulating hormone.
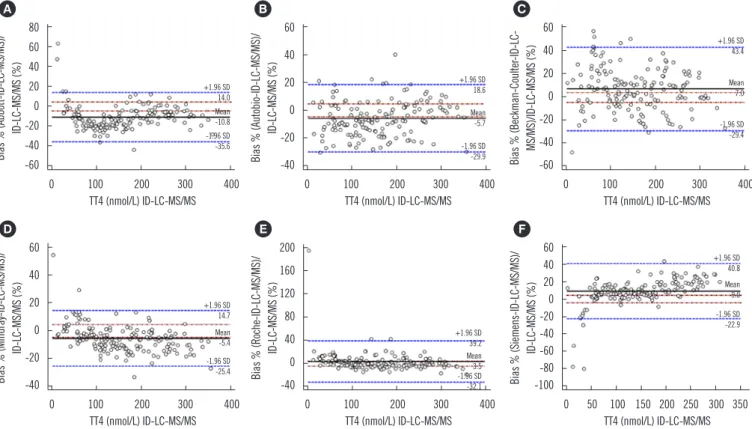
Fig. 2. Bland–Altman plots for assessing agreement between immunoassays (A, Abbott; B, Autobio; C, Beckman-Coulter; D, Mindray; E, Roche; F, Siemens) and ID-LC-MS/MS. Solid black line: mean difference, dashed brownish red dotted line: allowable limits (from −4.5% to 4.5%), dashed blue line: limits of agreement (from -1.96 SD to +1.96 SD).
Abbreviations: see Fig. 1.
80 60 40 20 0 -20 -40 -60
0 100 200 300 400 TT4 (nmol/L) ID-LC-MS/MS Bias % (Abbott-ID-LC-MS/MS)/ ID-LC-MS/MS (%)
+1.96 SD 14.0
-1.96 SD -35.6 Mean -10.8
A
60 40 20 0 -20 -40
0 100 200 300 400 TT4 (nmol/L) ID-LC-MS/MS Bias % (Autobio-ID-LC-MS/MS)/ ID-LC-MS/MS (%)
+1.96 SD 18.6
-1.96 SD -29.9 Mean -5.7
B
60 40 20 0 -20 -40 -60
0 100 200 300 400 TT4 (nmol/L) ID-LC-MS/MS Bias % (Beckman-Coulter-ID-LC- MS/MS)/ID-LC-MS/MS (%)
+1.96 SD 43.4
-1.96 SD -29.4 Mean 7.0
C
60 40 20 0 -20 -40
0 100 200 300 400 TT4 (nmol/L) ID-LC-MS/MS Bias % (Mindray-ID-LC-MS/MS)/ ID-LC-MS/MS (%)
+1.96 SD 14.7
-1.96 SD -25.4 Mean -5.4
D
200 160 120 80 40 0 -40
0 100 200 300 400 TT4 (nmol/L) ID-LC-MS/MS Bias % (Roche-ID-LC-MS/MS)/ ID-LC-MS/MS (%)
+1.96 SD 39.2
-1.96 SD -32.1 Mean 3.5
E
60 40 20 0 -20 -40 -60 -80 -100
0 50 100 150 200 250 300 350 TT4 (nmol/L) ID-LC-MS/MS Bias % (Siemens-ID-LC-MS/MS)/ ID-LC-MS/MS (%)
+1.96 SD 40.8
-1.96 SD -22.9 Mean 9.0
F
used low, medium, and high TT4 concentrations that covered the analytical measurable range in each immunoassay. Pass- ing–Bablok regression (Fig. 1) revealed that the results obtained by each immunoassay strongly correlated with those obtained by ID-LC-MS/MS, with correlation coefficients (R) >0.945. No proportional error (slope) was observed for Autobio, Beckman- Coulter, and Roche, and the 95% CIs for slope comprised. How- ever, constant error was observed for most immunoassays, ex- cept Beckman-Coulter, with a 95% CI for intercept comprising zero. The highest constant bias was noted for Siemens, at -12.8 nmol/L (Fig. 1). Bland–Altman plots showed that the mean bias relative to ID-LC-MS/MS was the lowest for Roche (3.5%) and the highest for Abbott (-10.8%) (Fig. 2).
Correlation between TT4 and TSH results
R was -0.371 (-0.516 to -0.206, P <0.001) between TT4 (ID- LC-MS/MS) and TSH (with 121 samples having a TSH concen- tration higher than the lower limit of 0.008 μIU/mL). The corre- lations between log TSH and TT4 measured by immunoassays are presented in Table 2. The correlation between log TSH and TT4 results from ID-LC-MS/MS was not stronger than that be- tween log TSH and TT4 results from immunoassays.
DISCUSSION
The relatively small biological variation in TT4 concentrations necessitates a high standard for analytical methods. Burtis et al.
[21] stated that when TT4 is used to diagnose thyroid disease, the suggested criteria for maximum bias and imprecision are 2.9% and 5.7%, respectively, and when the TT4 assay is used to monitor changes in an individual over time, bias and impreci- sion criteria should be 1.3% and 2.6%, respectively. We used performance criteria (a mean bias of ≤4.5% and imprecision of
≤3.7%) based on biological variation, which is used to evaluate whether an assay is analytically acceptable [16]. Applying these criteria, we found that though the immunoassays showed a good overall performance with imprecision <10%, most still did not meet the minimum clinical requirement of CV ≤3.7%.
Method agreement evaluation revealed that the results ob- tained by each method strongly correlated with those obtained by ID-LC-MS/MS; however, the 95% CIs for slope for Abbott, Mindray, and Siemens did not include one, indicating dispro- portional differences between these immunoassays and ID-LC- MS/MS [19]. Moreover, a constant error was observed for all im- munoassays (95% CI for intercept did not include the value zero) except Beckman-Coulter, and the highest constant bias was
found for Siemens.
With the criterion of mean bias of ≤4.5%, only the Roche as- say showed acceptable mean bias relative to ID-LC-MS/MS. How- ever, if the 10% mean bias criterion, as outlined in the report of the IFCC working group for standardization of thyroid function tests [8], is considered, only the Abbott assay showed a slightly higher deviation, with an average of 10.8%. The ratio of manu- facturers who meet the 10% bias was higher than that in the IFCC report. However, when the proficiency testing criterion for TT4 of ±20% or 12.9 nmol/L from Clinical Laboratory Improve- ment Amendments [22] is considered, Autobio, Abbott, Beck- man-Coulter, Mindray, Roche, and Siemens exceeded the crite- rion by 11.8%, 18.3%, 28.1%, 3.8%, 3.9%, and 17.1%, re- spectively.
Nonetheless, all methods showed a strong correlation with ID- LC-MS/MS for TT4 detection. Thus, it is possible to achieve stan- dardization between these methods and ID-LC-MS/MS, which would allow obtaining consistent results from different immuno- assays. However, differences exist among all TT4 immunoas- says, and efforts to standardize TT4 detection are still required.
Importantly, log TSH and FT4 showed a weak correlation when thyroid disease patients were included in the analysis, and FT4 measured by LC-MS/MS showed a stronger correlation with log TSH than did FT4 measured by immunoassays [13, 14]. One study reported a weak correlation between log TSH and TT4 [10]. We obtained R>0.7 with all immunoassays; however, this did not equate to a stronger correlation with ID-LC-MS/MS.
One limitation of this study is that we did not evaluate the per- formance of immunoassays for FT4 detection, due to the lack of a reference method and reference materials in China. Another potential limitation was that the presence of plasma components such as binding proteins and drugs that might affect immuno- assay results was not investigated, which must be addressed in future studies [23, 24]. Further, we did not evaluate whether blood collection devices or storage at -80°C affected immuno- histochemical TT4 detection. A previous study using VACUETTE tubes with separator gel and clot activator from Greiner Bio-One showed that the tubes did not affect TT4 results [25]; however, the study evaluated the effect of the tubes on TT4 detection only for Immulite 1000 (Siemens). Burtis et al. [21] reported that gel barrier collection devices do not have an apparent adverse effect on TT4 detection, and TT4 is stable up to 30 days when frozen.
In conclusion, though all the immunoassays tested in this study correlated strongly with ID-LC-MS/MS, most did not meet the minimum clinical requirements derived from biological vari- ation. Thus, efforts to reduce imprecision and standardize TT4
detection remain necessary. Laboratories and manufacturers must be aware of the assay limitations and improve the perfor- mance of these assays.
Authors’ Disclosures of Potential Conflicts of Interest
No potential conflicts of interest relevant to this article were re- ported.
Acknowledgment
This work was funded by research grants from the National Nat- ural Science Foundation of China (81702060, 81201337), and by the Scientific Research Project of Capital Health Development (2016-2-4017). The funders had no role in study design, data collection and analysis, decision to publish, or preparation of the manuscript. The authors have no additional financial disclo- sures.
REFERENCES
1. Goemann IM, Romitti M, Meyer ELS, Wajner SM, Maia AL. Role of thy- roid hormones in the neoplastic process: an overview. Endocr Relat Cancer 2017;24:R367-85.
2. Williams GR and Bassett JHD. Thyroid diseases and bone health. J En- docrinol Invest 2018;41:99-109.
3. Soh SB and Aw TC. Laboratory testing in thyroid conditions - pitfalls and clinical utility. Ann Lab Med 2019;39:3-14.
4. Baloch Z, Carayon P, Conte-Devolx B, Demers LM, Feldt-Rasmussen U, Henry JF, et al. Laboratory medicine practice guidelines. Laboratory support for the diagnosis and monitoring of thyroid disease. Thyroid 2003;13:3-126.
5. Mendel CM. The free hormone hypothesis: a physiologically based math- ematical model. Endocr Rev 1989;10:232-74.
6. Thienpont LM, Van Uytfanghe K, Beastall G, Faix JD, Ieiri T, Miller WG, et al. Report of the IFCC Working Group for Standardization of Thyroid Function Tests; Part 2: Free thyroxine and free triiodothyronine. Clin Chem 2010;56:912-20.
7. Després N and Grant AM. Antibody interference in thyroid assays: a potential for clinical misinformation. Clin Chem 1998;44:440-54.
8. Thienpont LM, Van Uytfanghe K, Beastall G, Faix JD, Ieiri T, Miller WG, et al. Report of the IFCC Working Group for Standardization of Thyroid Function Tests; Part 3: Total thyroxine and total triiodothyronine. Clin Chem 2010;56:921-9.
9. Steele BW, Wang E, Klee GG, Thienpont LM, Soldin SJ, Sokoll LJ, et al.
Analytic bias of thyroid function tests: analysis of a College of American Pathologists fresh frozen serum pool by 3900 clinical laboratories. Arch Pathol Lab Med 2005;129:310-7.
10. Jonklaas J, Sathasivam A, Wang H, Gu J, Burman KD, Soldin SJ. Total and free thyroxine and triiodothyronine: measurement discrepancies, particularly in inpatients. Clin Biochem 2014;47:1272-8.
11. Tai SS, Sniegoski LT, Welch MJ. Candidate reference method for total thyroxine in human serum: use of isotope-dilution liquid chromatogra- phy-mass spectrometry with electrospray ionization. Clin Chem 2002;
48:637-42.
12. Joint Committee for Traceability in Laboratory Medicine. Database of higher order reference materials, measurement methods/procedures and services. https://www.bipm.org/jctlm/ (Updated on Oct 2017).
13. Serdar MA, Ozgurtas T, Ispir E, Kenar L, Senes M, Yücel D, et al. Com- parison of relationships between FT4 and log TSH in Access DXI 800 Unicel, Modular E170 and ADVIA Centaur XP Analyzer. Clin Chem Lab Med 2012;50:1849-52.
14. Jonklaas J, Kahric-Janicic N, Soldin OP, Soldin SJ. Correlations of free thyroid hormones measured by tandem mass spectrometry and immu- noassay with thyroid-stimulating hormone across 4 patient populations.
Clin Chem 2009;55:1380-8.
15. CLSI/NCCLS. User demonstration of performance for precision and true- ness; Approved Guideline, NCCLS document EP15-A (ISBN 1-56238- 451-1) Wayne, PA. 2001.
16. Perich C, Minchinela J, Ricós C, Fernández-Calle P, Alvarez V, Domé- nech MV, et al. Biological variation database: structure and criteria used for generation and update. Clin Chem Lab Med 2015;53:299-305.
17. Minchinela J, Ricós C, Perich C, Fernández-Calle P, Alvarez V, Domé- nech MV, et al. Desirable specifications for total error, imprecision, and bias, derived from intra- and inter-individual biologic variation. http://
www.westgard.com/biodatabase-2014-update.htm (Updated on 2014).
18. Petersen PH, Fraser CG, Jørgensen L, Brandslund I, Stahl M, Gowans E, et al. Combination of analytical quality specifications based on biological within- and between-subject variation. Ann Clin Biochem 2002;39:543- 50.
19. Bilić-Zulle L. Comparison of methods: Passing and Bablok regression.
Biochem Med (Zagreb) 2011;21:49-52.
20. Giavarina D. Understanding Bland Altman analysis. Biochem Med (Za- greb) 2015;25:141-51.
21. Burtis CA, Ashwood ER, et al. eds. Tietz textbook of clinical chemistry and molecular diagnostics. 5th ed. Saint Louis, MO: Elsevier, 2012:1931-3.
22. Medicare, Medicaid and CLIA programs; Regulations Implementing the Clinical Laboratory Improvement Amendments of 1988 (CLIA)–HCFA.
Final rule with comment period. Fed Regist 1992;57:7002-186.
23. Nelson JC, Wang R, Asher DT, Wilcox RB. Underestimates and overes- timates of total thyroxine concentrations caused by unwanted thyroxine- binding protein effects. Thyroid 2005;15:12-5.
24. Stockigt JR and Lim CF. Medications that distort in vitro tests of thyroid function, with particular reference to estimates of serum free thyroxine.
Best Pract Res Clin Endocrinol Metab 2009;23:753-67.
25. Bowen RA, Sattayapiwat A, Gounden V, Remaley AT. Blood collection tube-related alterations in analyte concentrations in quality control ma- terial and serum specimens. Clin Biochem 2014;47:150-7.
Supplemental Data Table S1. Immunoassays used in this study Manufacturer PrincipleInstruction for use
approval or modification date
Measurement range (nmol/L)
Limit of detection
(nmol/L)
Cross reactivity with T3 (%)
Cross reactivity with rT3 (%)
Reference range (nmol/L)
Manufacturer declared precision (%)
Calibrator
lot Reagent lot
Abbott CMIA 2014/12/22 12.9–309.6 NA <3.2 NA 62.82–151.19 ≤7.3 7K66-01 55935UI00
Autobio CMIA 2014/6/18 6.45–30.00 NA <2.3 <2.3 58.05–154.8 ≤15 2015101503 20151121
Beckman-Coulter CLIA 2012/9/29 6.45–387 6.45 1.24 19.95 78.56–157.77 ≤10 33805 527911
Mindray CMIA 2013/4/12 6.45–387 ≤6.45 0.94 6.07 64.5–146.93 ≤10 20150901 150701
Roche ECLIA 2014/9/25 5.42–320.69 5.42 <1.53 NA 65.79–181.89 ≤6.9 18150202 188364
Siemens CLIA 2015/1/26 3.87–387 3.87 1.20 2.70 58.05–140.61 ≤5.5 53803A86 4003169
Abbreviations: T3, 3,3',5-triiodo-L-thyronine; rT3, reverse T3; CMIA, chemiluminescence microparticle immunoassay; CLIA, chemiluminescence immunoas- say; ECLIA, electrochemiluminescence immunoassay.