http://dx.doi.org/10.12925/jkocs.2016.33.3.521
Effects of Various Extracts from Turmeric ( Curcuma longa L.) on Antioxidant Activity
Gyeong-Hwuii Kim
1․Yishan Duan
2․Han-Soo Kim
2,✝1
Department of Biological Science and Technology, Yonsei University, Seoul 03722, Korea
2
Department of Food Science and Technology, Pusan National University, Miryang 50463, Korea (Received May 1, 2016; Revised September 13, 2016; Accepted September 26, 2016)
Abstract : The antioxidant activity of 70% methanol, 70% ethanol and chloroform-methanol (CM, 2:1, v/v) extracts from turmeric ( Curcuma longa L.) was investigated in this study. The antioxidant potential of various extracts of turmeric was evaluated by using different antioxidant tests, namely DPPH (2,2-diphenyl-1-picrylhydrazyl) radical scavenging activity, ABTS [2,2′
-azino-bis (3-ethylbenzothiazoline-6-sulfonic acid) diammonium salt] radical scavenging activity, ferric reducing antioxidant power and β-carotene bleaching assays as well as total phenol content and total flavonoid content. All extracts exhibited abundant total phenol content, total flavonoid content and strong antioxidant activity. Particularly, higher activity was exhibited by CM extract with 46.32±0.35 mg CAE/g and 15.58±0.39 mg QE/g of total phenol content and total flavonoid content. Generally, antioxidant activity of various extracts from turmeric increased in the following order: 70% methanol extract, 70% ethanol extract and CM extract, respectively. Results suggested that turmeric could be widely used as a source of antioxidant and a kind of functional material in food.
Keywords : turmeric (Curcuma longa L.), total phenol, flavonoid, antioxidant activity
1. Introduction
Turmeric ( Curcuma longa L.) belongs to the Zingiberaceae family, which is a perennial and tropical herb [1]. Turmeric has also attracted considerable attention over the years due to its use in the food industry as a flavor, color, and preservative [2,3]. And it has been widely used in indigenous medicine for the treatment of a variety of inflammatory conditions and
✝
Corresponding author
(E-mail: [email protected])
other diseases [4]. Curcumin (diferuoyl
methane) is a phenolic compound and a major
pigment component of turmeric. The biological
effects of curcumin were summarized as
antioxidant, anti-inflammatory, anti-cancer,
anti-viral, anti-bacterial and
immunomodulatory activities. It also acts as a
potential therapeutic agent in enhancement of
wound healing and modulation of angiogenesis
[4]. Oxygen free radicals or, more generally,
reactive oxygen species (ROS) including free
radicals such as superoxide anion radicals,
hydroxyl radicals, singlet oxygen and non-free
radical species such as hydrogen peroxide,
which are various forms of active oxygen and usually generated by oxidation product of biological reactions or exogenous factors [5].
Free radicals are known to be unstable and highly reactive as the energized molecules having unpaired electrons. Free radicals react quickly with other compounds, trying to capture the electrons needed to gain its stability. These radicals through initiating lipid peroxidation and a chain reaction to result in destabilization and disintegration of the cell membranes or oxidation of other cellular components like proteins and DNA [6].
Fruit and vegetables contain not only essential nutrients needed for daily life but also a wide variety of bioactive compounds (antioxidant phytochemicals) for health promotion and disease prevention [7,8]. There are several previous studies have conducted that people who have diets rich in natural water-soluble antioxidants such as fresh fruits and vegetables can improve the antioxidant activity and reduce the risk of chronic diseases [9].
Currently, a very promising way to overcome oxidative degradation is to increase the consumption of diets rich in fruit or vegetable.
In this study, the effects of 70% methanol, 70% ethanol and chloroform-methanol (CM, 2:1, v/v) turmeric extracts from turmeric on antioxidant activities in vitro were investigated.
We examined the total phenol content, total flavonoid content as well as antioxidant activity including DPPH radical, ABTS radical scavenging activity, ferric reducing antioxidant power and β-carotene bleaching assays.
2. Materials and Methods 2.1. Materials
Turmeric ( Curcuma longa L.) was purchased from Jindo (Jeonnam, Korea). After grounded with a blender (HMF-3250S, Hanil Electric Co., Seoul, Korea), the turmeric flours were stored at –80℃ (SW-UF-400, Sam-Won Co., Busan, Korea) for further analyses.
2.2. Preparation of turmeric extracts Turmeric flours and extraction solvents including 70% methanol, 70% ethanol and chloroform–methanol mixture (CM, 2:1, v/v) were mixed in a ratio of 1:10 and kept in the dark about 24 h, and then used the Advantec No. 1 filter paper (Tokyo, Japan) to filter.
The process of extraction was repeated 3 times. The filtrate was evaporated by rotary vacuum evaporator (EYELA, N-N series, Tokyo, Japan) until the solvents were completely removed. The extracts were collected and sealed in brown reagent bottles and frozen at –80℃ until required for further analyses.
2.3. Measurement of total phenol contents (TPC)
The total phenol contents were determined by using Folin–Denis’ phenol reagent and caffeic acid was used as a standard for the calibration curve [10,11]. In brief, samples (0.5 mL) were mixed with 3.0 mL of distilled water and 0.5 mL of Folin–Denis’ phenol reagent in the test tubes. After incubated for 3 min, 0.5 mL of 10% sodium carbonate (w/v) was added. Then the mixture was incubated in the temperature for 60 min. The absorbance of the reaction mixture was measured at 700 nm using uv/vis-spectrophotometer (Specord 200, Analytikjena, Jena, Germany). Total phenol contents were expressed as mg of caffeic acid equivalents per g of extracts (mg CAE/ g extract).
2.4. Measurement of total flavonoids content (TFC)
Total flavonoid content was determined by aluminum chloride colorimetric method [12]
with some modifications. Samples (0.5 ml)
were mixed with 0.5 ml of 10% aluminum
nitrate enneahydrate, 0.5 ml of 1 M sodium
acetate and 2.0 ml of 80% ethanol (v/v). After
this step, reaction mixture was incubated at
room temperature for 40 min, and then the
absorbance was read at 415 nm. Quercetin
was used as a standard. Total flavonoids contents were expressed as mg of quercetin equivalents per g of extracts (mg QE/g extract).
2.5. DPPH radical scavenging activity assay
DPPH radical scavenging activity was measured according to the method of Blois MS [13] and Duan et al [14]. Samples (2.0 mL) were mixed with 0.2 mM DPPH (2.0 mL) and then vigorously shaken. The mixture solution was stood in the dark for 30 min at 37℃ water bath. Ascorbic acid was used as positive control. Then the absorbance of the reaction mixture was read with spectrophotometer at 517 nm. The percentage inhibition of DPPH radical scavenging activity was calculated based on the control reading using the following calculation:
DPPH radical scavenging activity (%) =
where A
sis the absorbance in the presence of sample or BHA, and A
cis the absorbance of control reaction.
2.6. ABTS radical scavenging activity assay
ABTS radical scavenging activity was evaluated according to the method of Sun et al [15]. The mixture of 15 mL of 7 mM ABTS and 15 mL of 2.45 mM potassium persulfate was stored at room temperature in the dark for 16 h to get the green–blue free radical ABTS˙
+. Then the solution was diluted with ethanol until the absorbance was 0.7±0.02 at 734 nm. Samples (0.2 mL) were mixed with 2.8 mL of ABTS working solution.
After 6 min of reaction, the absorbance was taken at 734 nm. Ascorbic acid was used as positive control. The percentage of ABTS radical scavenging effect was calculated as follow:
ABTS radical scavenging effect (%) =
where A
sis the absorbance in the presence of sample or BHA, and A
cis the absorbance of control reaction.
2.7. β-carotene bleaching assay
The β-carotene bleaching assay was performed as previously described by Elzaawely et al [16] and Duan et al [17]. Antioxidant activity (AOA) was calculated using the following formula:
A
0and A′
0are the initial absorbance of sample and control, whereas A
120and A′
120are the absorbance of sample and control after 120 min.
2.8. Ferric reducing antioxidant power (FRAP) assay
The working FRAP reagent was prepared by mixing 10 mL of 0.3 M sodium acetate buffer (pH 3.6), 1 mL of 10 mM TPTZ in 40 mM hydrochloride acid and 1 mL of 20 mM ferric chloride. The freshly prepared FRAP reagent (3.0 mL) was mixed with 0.5 mL of sample solution. After incubated at 37℃ water bath for 30 min, the absorbance was read at 593 nm. Ascorbic acid was used as the positive control. The FRAP values were expressed as the absorbance of samples [18].
2.9. Statistical analysis
The experimental data in triplicate were subjected to analysis of variance (ANOVA) and expressed as mean±standard deviation ( n =3). ANOVA was performed by using the one-way analysis of variance procedures.
Duncan’s multiple-range test was used to
analysis the significant difference of means,
and p <0.05 was considered to be statistically
significant for all statistic procedures. IBM
SPSS statistic 21 program was used for data
analysis.
Assays 70% methanol 70% ethanol CM
2)Extraction yields (%) 18.4 21.34 8.36
Total phenol content (mg GAE/g) 25.78±0.29
a3)30.27±0.33
b46.32±0.35
cTotal flavonoid content (mg QE/g) 8.24±0.17
a14.14±0.23
b18.58±0.39
cDPPH
1)(IC
50, mg/mL) 0.40±0.00
c0.37±0.01
b0.29±0.00
aABTS (IC
50, mg/mL) 0.78±0.04
b0.84±0.03
c0.60±0.02
aβ-carotene bleaching (IC
50, mg/mL) 0.55±0.02
c0.53±0.03
b0.20±0.01
a1)
DPPH radical scavenging activity (DPPH), ABTS radical scavenging activity (ABTS) and β -carotene bleaching assays.
2)CM : chloroform–methanol mixture (2:1, v/v).
3)
The values are means±standard deviation ( n =3). Values with the different letters in the same row are significantly different ( p <0.05) by Duncan’s multiple range tests.
Table 1. Extraction yields, total phenol contents, total flavonoid contents and IC
50values in the antioxidant activity evaluation assays of turmeric ( Curcuma longa L.)
3. Results and Discussion
3.1. Yields
The various extraction yields of turmeric by 70% methanol, 70% ethanol and chloroform–
methanol (CM, 2:1, v/v) were shown in Table 1. The extraction yield by 70% ethanol exhibited the maximum value (21.34%), CM was found to be the lowest (8.36%).
Additionally, the extraction yield by 70%
methanol was found to be 18.40%.
3.2. Total phenol contents (TPC)
The scavenging ability of phenols is mainly due to the phenolic structure of hydroxyl substituent on the aromatic ring [19].
Furthermore, a positively and highly significant relationship between total phenolics and antioxidant activity was documented by Velioglu et al [20], which implied a compound with higher content of phenol possessed higher antioxidant activity. Total phenol contents were determined by according to the colorimetric Folin–Denis’ method with caffeic acid as a stand compound (y=0.1141x+0.0076, R
2=0.9941). The total phenol contents of turmeric by different extraction solvents (70%
methanol, 70% ethanol and CM) were showed in Table 1. Total phenol contents of various extracts increased in the order: 70% methanol extract (25.78±0.29 mg CAE/g), 70% ethanol extract (30.27±0.33 mg CAE/g) and CM extract (46.32±0.35 mg CAE/g), respectively.
3.3. Total flavonoid contents (TFC)
Flavonoids family includes flavones,
isoflavones, flavanones, anthocyanins, flavans,
proanthocyanidins, and catechins, which have
long been recognized to show antioxidant
capacity and antiallergic, antiinflammatory,
antiviral, antiproliferative and anticarcinogenic
activities [8,21]. Flavanoids with potential
antioxidant activity are of particular interest
among naturally occurring substances. The
content of flavonoid in extracts from various
extraction solvents were calculated in
accordance with the calibration curve of
quercetin (y=0.1092x+0.0034, R
2=9996). As
can be seen in Table 1, total flavonoid
contents of various extracts increased in the
order: 70% methanol extract (8.24±0.17 mg
QE/g), 70% ethanol extract (14.14±0.23 mg
QE/g) and CM extract (18.58±0.39 mg
QE/g), respectively.
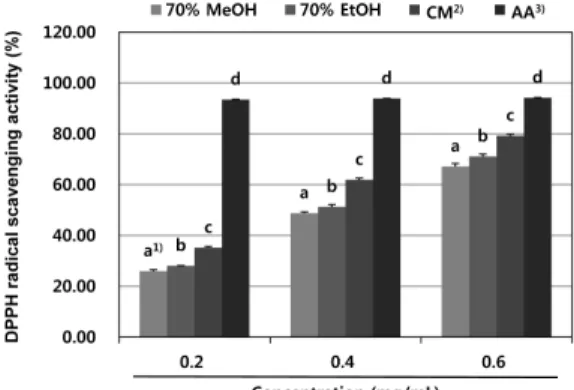
3.4. DPPH radical scavenging activity DPPH is a stable free radical and can be scavenged by antioxidants through donating hydrogen. The discoloration from purple to yellow induces the absorbance of reaction mixture decreases at 517 nm [22]. Various fractions obtained by using different extraction solvents indicated different DPPH scavenging capacity (Fig. 1 and Table 1). The DPPH radical scavenging abilities of various extracts appeared to be associated with increasing concentrations (0.2 mg/mL, 0.4 mg/mL and 0.6 mg/mL). All extracts exhibited excellent DPPH radical scavenging ability even if their effects were lower than that of ascorbic acid.
Results showed that CM extract (IC
50=0.29±
0.00 mg/mL) and 70% methanol extract (IC
50=0.40±0.00 mg/mL) possessed the highest and lowest activity upon the elimination of DPPH radical, respectively. At a concentration of 0.6 mg/mL, the DPPH radical scavenging activity of various extracts increased in the following order: 70% methanol extract (67.11±1.19%), 70% ethanol extract (71.08±
0.93%) and CM extract (79.24±0.61%),
Fig. 1. DPPH radical scavenging activity of various solvent extracts from turmeric ( Curcuma longa L.).
1)
The values are means±standard deviation ( n =3). Bars with the different letters are significantly different ( p <0.05) by Duncan’s multiple range tests.
2)CM : chloroform–
methanol mixture (2:1, v/v).
3)
AA : ascorbic acid.
respectively. Remarkable correlation between total phenol contents, total flavonoid contents and DPPH radical scavenging activities can be found clearly, which were in keeping with the results of Hsu et al [23]. The strong scavenging capacities of the extracts on DPPH radical were most likely on account of the hydrogen donating ability of the phenol and flavonoid compounds presented in the extracts [22,23].
3.5. ABTS radical scavenging activity The radical–cation ABTS˙
+is produced by the oxidation of ABTS. In the absence of antioxidants, ABTS is rather stable, but it reacts actively with an H-atom donor (i.e.
phenolics). Therefore, the blue/green chromophore would discolor gradually or be converted into a non-colored form of ABTS up to the antioxidant capacity of antioxidants [24]. Fig. 2 and Table 1 showed the inhibitory effect of various extracts on ABTS radical. As can be seen from results, ABTS radical scavenging activity was marked and concentration-related. The IC
50values of
Fig. 2. ABTS radical scavenging activity of various solvent extracts from turmeric ( Curcuma longa L.).
1)
The values are means±standard deviation ( n =3). Bars with the different letters are significantly different ( p <0.05) by Duncan’s multiple range tests.
2)CM : chloroform–
methanol mixture (2:1, v/v).
3)
AA : ascorbic acid.
different fractions decreased in the following order: 70% ethanol extract (IC
50=0.84±0.03 mg/mL), 70% methanol extract (IC
50=0.78±
0.04 mg/mL) and CM extract (IC
50=0.60±
0.02 mg/mL), respectively. Obviously, the CM extract exhibited the strongest scavenging activity against ABTS radical. However, 70%
ethanol extract showed the lowest ABTS radical scavenging activity. There was a positive correlation between scavenging effect of CM extract against ABTS radical and its amounts of total phenol and total flavonoid contents. And our results were consistent with the finding of Velioglu et al [20].
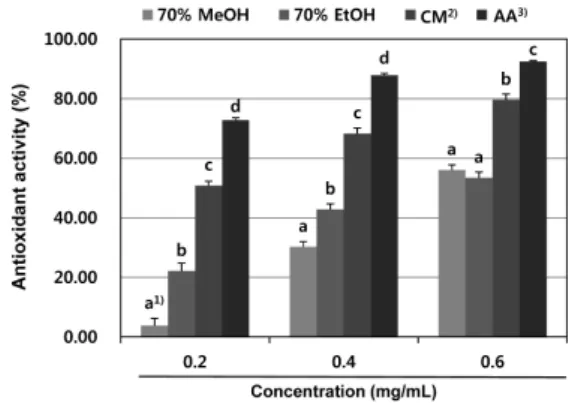
3.6. β -carotene bleaching assay
The antioxidant activities of various extracts at 0.2 mg/mL to 0.6 mg/mL concentrations were compared with ascorbic acid measured by the bleaching of β-carotene were presented in Fig. 3. The highly unsaturated β -carotene molecules in this system can be attacked by free radicals generating from the oxidation of linoleic acid, and as a consequence, the characteristic orange color disappears. The presence of antioxidant can avoid the destruction of the β-carotene by neutralizing the free radicals formed in the system to keep the orange color [16]. As depicted in Fig. 3, the results exhibited concentration-dependent antioxidant activity by β-carotene bleaching method in all the tested concentrations of various extracts. The antioxidant activity of various extracts was found to decrease in the following order: CM extract (IC
50=0.20±0.01 mg/mL), 70% ethanol extract (IC
50=0.53±0.03 mg/mL) and 70%
ethanol extract (IC
50=0.55±0.02 mg/mL).
Although ascorbic acid always showed the most effective antioxidant activity, CM extract displayed stronger antioxidant activity compared with other extracts. And this result showed a well correlation with total phenol contents and total flavonoid contents [16]. It was probable that the antioxidative components in extracts can reduce the extent
of β-carotene destruction by neutralizing the linoleate free radical and other free radicals in this system.
Fig. 3. Antioxidant activity of various solvent extracts from turmeric ( Curcuma longa L.) by β-carotene bleaching assay.
1)
The values are means±standard deviation ( n =3). Bars with the different letters are significantly different ( p <0.05) by Duncan’s multiple range tests.
2)CM : chloroform–
methanol mixture (2:1, v/v).
3)
AA : ascorbic acid.
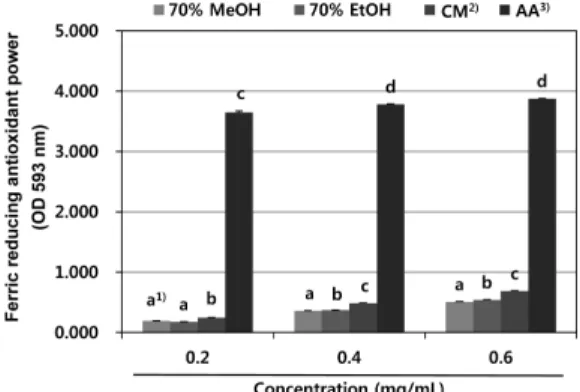
3.7. Ferric reducing antioxidant power (FRAP)
Antioxidant potential of different fractions
from turmeric was estimated from their ability
to reduce the ferric-tripyridyltriazine (Fe
Ⅲ-TPTZ) complex to ferrous-tripyridyltriazine
(Fe
Ⅱ-TPTZ) at low pH, forming an intense
blue color with an absorption maximum at
593 nm develops [18]. The antioxidant
activities through the ferric reducing
antioxidant power model system of turmeric
extracts at 0.2 to 0.6 mg/mL concentrations
compared with ascorbic acid were presented in
the Fig. 4. The results exhibited concentration-
dependent ferric reducing antioxidant activities
in all the tested concentrations of various
extracts. At a concentration of 0.6 mg/mL, the
FRAP values of various extracts increased in
the following order: 70% methanol extract
(0.51±0.01), 70% ethanol extract (0.54±0.00)
and CM extract (0.69±0.01), respectively. The
CM extract showed pronounced ferric reducing antioxidant power values compared with other extracts although lower than that of ascorbic acid. Significant differences in ferric reducing antioxidant power values between various extracts could be found. Similar to the results obtained from DPPH radical and ABTS radical scavenging activity, correlation between FRAP values, total phenol contents and total flavonoid contents could also be observed from our research. This significant correlation was in accordance with the reports of the Bertoncelj et al [25], who found total phenol content strongly correlated with antioxidant activity evaluated by FRAP assay in the honey.
Fig. 4. Ferric reducing antioxidant power of various solvent extracts from turmeric ( Curcuma longa L.).
1)
The values are means±standard deviation ( n =3). Bars with the different letters are significantly different ( p <0.05) by Duncan’s multiple range tests.
2)CM : chloroform–
methanol mixture (2:1, v/v).
3)