VERIFICATION OF THE GEOSTATIONARY OCEAN COLOR SATELLITE DATA PROCESSING SYSTEM
Hee-Jeong Han*, Joo-Hyung Ryu, Seongick CHO, Chan-Su Yang, Yu-Hwan Ahn
Korea Ocean Satellite Center, Korea Ocean Research & Development Institute, Ansan P.O.Box 29, 425-600 KOREA E-mail:[email protected]
KEY WORDS: Data processing, GOCI, Ocean Color, Ocean Monitoring, Sensor, Verification, Remote Sensing
ABSTRACT: Geostationary Ocean Color Imager(GOCI), as the world’s first sensor to observe the ocean in geostationary orbit, has been developed with eight VIS/NIR bands, two mega pixel CMOS detector array. The GOCI has acquired 16 slot images in 2,500km x 2,500km area centered at 36˚ N and 130˚ E during 30 minutes. GOCI Level 1B data, that is total radiance detected by GOCI and processed by Image Pre-processing System(IMPS), should be applied to derive ocean analysis products as GOCI Level 2 by GOCI Data Processing System(GDPS) in eight times per day. GDPS has the atmospheric correction algorithms and several Case-II underwater algorithms. Also, GDPS has the functionality to generate the value added products and the daily composite and the animation of time-series data.
During in-orbit test period, GDPS will be verified with respect to the requirements, its interface, functionality and accuracy of outputs by pre-defined test procedure. And those configuration parameters will be tuned for correct processing of ocean color data. All processing of GDPS is performed automatically within 30 minutes after GOCI Level 1B injection. Its outputs are moved and registered immediately to Data Management System(DMS) in KOSC.
For GOCI atmospheric correction algorithms, the output water leaving radiance(Lw) is compared with the existed polar-orbit ocean color satellite’s one. The demonstration of each algorithm will be shown its input/output data analysis results. The study of various candidate of standard algorithm will be performed by comparison with in-situ data.
1. INTRODUCTION 1.1 COMS/GOCI
The communication, ocean and meteorological satellite (COMS), was launched successfully in 26 June 2010 and located at 128.2degree east longitude, has been performed the in-orbit test(IOT) about six months after launch(end of 2010). It has three payloads for communication technology evaluation and ocean color monitoring and operational meteorological observation (Han, 2009). The geostationary ocean color imager (GOCI) has been developed to remotely sense the ocean signal covered visible and near- infrared band that was radiated from ocean surface in geostationary orbit (Kang, 2004).
GOCI have several mission objectives.
x Detecting, monitoring and predicting short term biophysical phenomena
x Focus on biological and biogeochemical interests
x Detecting notable extension of harmful algal blooms
x Monitoring the health of marine ecosystem x Resource management in coastal zone x Producing an improved marine fisheries
information to the fisherman communities The requirement of this sensor was derived to satisfy the mission objectives. The requirement was like 8 spectral band(VIS/NIR), 2,500 km x 2,500km (centered at 130˚ E, 36˚ N) coverage, 500m ground sampling distance, high signal to noise ratio(SNR) (Cho, 2010).
1.2 KOSC
Korea Ocean Satellite Center(KOSC) is located in Ansan, Korea. KOSC is specified as GOCI data center although it has functionality of multi satellite receiving.
KOSC always can be received the spacecraft transmitted signal by GOCI data acquisition system (GDAS) and processing by Image pre-processing system(IMPS) and GOCI data processing system(GDPS). In the in-orbit test period, GDAS can receive the ocean remote sensing data from GOCI/COMS using 9m L-band antenna and RF equipments. IMPS can retrieve the LTOA to make GOCI L0, L1A, L1B file. And then the GDPS will be worked and verified its algorithms using validation data.
1.3 GDPS
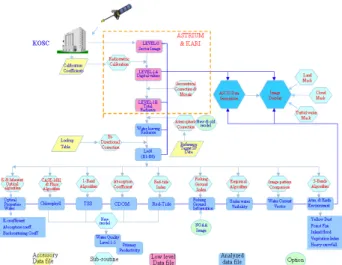
The GOCI data processing system (GDPS) has been developed from 2003. It can extract ocean geophysical products as Chlorophyll concentration, suspended sediment, red-tide index, etc from the radiance of top of atmosphere (LTOA) using some correction algorithms for atmosphere and bidirectional problem and using each local region specified algorithms (Han, 2010). The primitive result like image data was generated in IOT period and could be analyzed to the verification of GDPS algorithms. Figure 1 shows the specified algorithms and level products and data processing flow designed for GDPS.
Figure 1. GDPS algorithm and flow design of data processing (KORDI, 2003)
Figure 2. GOCI first image acquired in 13 Jul 2010 05:15:20(UTC) ©KOSC.
1.4 Data products of GDPS
Figure 2 shows the GOCI first image that is Level 1A (L1A). The GOCI L1A data is already corrected in the point of radiometric correction but is not performed geometric correction yet. The geometric correction is out of scope of GDPS.
The GOCI Level 1B(L1B) data, as the input file of GDPS, is composed of the total radiance data corrected the radiometric and geometric point of view. It is almost 1GB sized huge file. The GOCI Level 2(L2) is the ocean signal and environmental products induced by specific algorithms. GOCI sends the signal from space to ground each hour each hour (8 times/day) and its data will be processed to L2 data in near-real time. And Level 3(L3) data is secondary derived data from L2 like fishery
ground information and primary productivity. Daily composited data as level 3 has expected to be good products in cloud-free (or cloud-reduced) condition.
GOCI level 2 data is consist of L2A and L2B hourly regular files. The size of L2 files is over 3.5GB but the size of each product of L2 is about 100MB. In L2A file, the water leaving radiance(Lw), normalized water leaving radiance(nLw), chlorophyll(CHL), total suspended sediment(TSS), colored dissolved organic matter(CDOM), diffuse attenuation coefficient(Kd), red tide index(RI), visibility(VIS) and land/atmospheric applications like NDVI/EVI and yellow dust/aerosol is contained. In L2B file, the inheritance optical properties (IOP) related products like absorption coefficient(A) and backscattering coefficient(Bb) is contained. GOCI Level 3 daily data file is composed of the daily composite of L2A, fishery information, primary productivity, and water quality level. The water current vector as L3 is stored separated text file. The file format of GOCI L1B/L2/L3 is HDF-EOS5.
2. DATA & METHODS 2.1 Dataset
GOCI Level 1B files acquired at KOSC during 20 aug 2010 are used sample test dataset. These files have composed by 8 bands total radiance value. Using GDPS, the GOCI L2 files are generated. Sample MODIS data as matchup polar-orbit ocean color satellite is searched with same similar acquisition time from OceanColor homepage.
2.2 Verification Method
Firstly, GDPS source code level verification is performed to enhance the integrity of the algorithms. After that we run GDPS to make L2 data from L1B data within required time.
In the L2 data, cloud and land masking is first step to check.
Then, we can compare with GOCI L2 and MODIS information in few point of match up for verifying atmospheric correction. In GDPS, five chlorophyll algorithms are implemented. So we can compare the result of these algorithms each other. GOCI browsing image can be made from GOCI L1B 6, 4, 1 band. We can compare this image with MODIS browsing image. After 8 times daytime image acquisition and data processing, daily composite processing is occurred . the l2 daily composite will be verified its cloud-reducing performance.
3. RESULT & DISCUSSION
3.1 Implementation Check
We found some mistakes of software programmer like the trigonometrically miscalculation by degree unit not radian and the usage of wrong initial configuration value. We could fix it except the atmospheric correction algorithm’s coefficients.
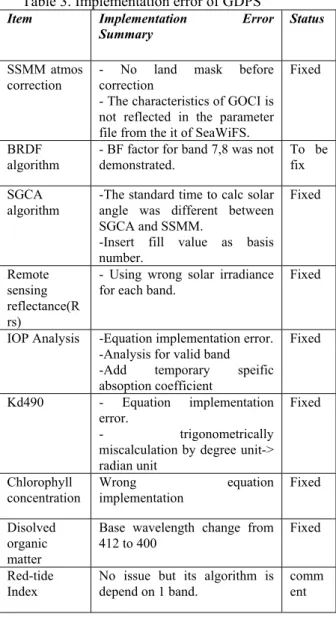
The summary of implementation error is listed in Tavle 3.
Table 3. Implementation error of GDPS
Item Implementation Error
Summary Status
SSMM atmos correction
- No land mask before correction
- The characteristics of GOCI is not reflected in the parameter file from the it of SeaWiFS.
Fixed
BRDF
algorithm - BF factor for band 7,8 was not
demonstrated. To be
fix SGCA
algorithm
-The standard time to calc solar angle was different between SGCA and SSMM.
-Insert fill value as basis number.
Fixed
Remote sensing reflectance(R rs)
- Using wrong solar irradiance for each band.
Fixed
IOP Analysis -Equation implementation error.
-Analysis for valid band
-Add temporary speific absoption coefficient
Fixed
Kd490 - Equation implementation error.
- trigonometrically miscalculation by degree unit->
radian unit
Fixed
Chlorophyll concentration
Wrong equation implementation
Fixed
Disolved organic matter
Base wavelength change from
412 to 400 Fixed
Red-tide Index
No issue but its algorithm is depend on 1 band.
comm ent
3.2 Running performance check
GDPS near-real time processing timeliness requirement is 30 minutes. The result of running time is 24 minutes averagely and is meted the requirement successfully.
3.3 L2 products check
3.3.1 Cloud mask: the most important thing of cloud masking is the threshold of cloud satulation level. We determined that values for each band from sample GOCI data inspection using ENVI software. That is similar to cloud saturation level of instrument’s user requirements.
3.3.2 Atmospheric Correction: for this correction algorithm verification, we compare the result of MODIS and GDPS. GDPS will has to modify its algorithm for ocean signal to belonging to the correct range.
3.3.3 Chlorophyll concentration: the five algorithms are empirical band ratio algorithm, fluorescence difference algorithm, fluorescence area algorithm, seadas OC2,amd OC4 algorithm.. the result could not compare each other because the input of algorithm, that is Rrs value, is not correct by wrong calculation of atmospheric correction.
3.3.4 Browsing Image: although GOCI is located 50 times far from earth , the result of GOCI browsing image is similar to MODIS browsing image . But expression of color of GOCI browsing image is better than MODIS 1km BI.
3.3.5 L2 Daily Composite: the result of daily composite is good but there is some distortion in the edge of cloud. The cloud detection threshold should be more fine tuning for the L2 daily composite, too.
Some verification steps are successful insight from result but others are not performed yet.
4. CONCLUSION
In here, we have checked the GDPS functionalities and performance using GOCI sample data & in-situ data. The GDPS can generate L2/ L3 automatically and manually.
It can show and analyze L1B/L2/L3 with interactive stretch and color mapping. Though some problems are still remained in GDPS, we shall be totally verified this software to be released as GDPS version 1.0 in next year for official data processing software of GOCI. We need to collect more matchup data and to compare both satellite data and to modify it correctly. KOSC will distribute the GOCI L1B ~ L3 data with GDPS software to the user in next year.
References
References from Journals:
Cho, S., Y.H. Ahn, J.H. Ryu, G.S Kang, H.S. Youn, 2010. Development of Geostationary Ocean Color Imager(GOCI). Korean Journal of Remote Sensing, 26(2), pp157-165.
Han, H.J., Y.H.Ahn, J.H Ryu, C.S Yang, 2009.
Development of the data generation, management, and distribution system for geostationary ocean color imager in korea ocean satellite center. IGARSS 2009 Abstracts, 1(1), pp. 1-2.
Han, H.J., J.H. Ryu, and Y.H. Ahn, 2010. Development of Geostationary Ocean Color Imager(GOCI) Data Processing System(GDPS). Korean Journal of Remote Sensing, 26(2), pp239-249.
Kang, G., S. Kang, S. Yong, J. Kim, Y. Chang, and H. Youn, 2004. Korea Geostationary Ocean Color Imager(KGOCI).
IGARSS 2004 Procedings, 5(1), pp.3261-3263.
Moon, J.E., Y.H. Ahn, J.H. Ryu, P. Shanmugam, 2010.
Development of Ocean Environmental Algorithms for Geostationary Ocean Color Imager(GOCI). Korean Journal of Remote Sensing, 26(2), pp189-207.
References from Books:
KORDI, 2003. the report of “Development of GOCI data processing system(I)”, BSPM 24400-1624-1, MLTM, pp.33-40.
Acknowledgements
This study has been sponsored by MEST(PE98492) and MLTM(PM55660). Thanks to Mr. Jeong-eun Moon for checking the corrected L2 generation algorithms. Thanks to Jae-Hyun Ahn to check the atmospheric correction algorithms. Thanks to Saeasoft, Inc for their kind support.