Genetic Diversity and Phylogenetic Relationship of Genus Phyllostachys by RAPD Markers
Song Jin Lee*, Man Kyu Huh
1, Hyun Cheol Shin
2and Hong Wook Huh
3 Damyang-gun Office, Damyang 517-802, Korea1Department of Molecular Biology, Dongeui University 995 Eomgwangno, Busan 614-714, Korea
2Foest Research Institute, Southern Forest Center
3Department of Biology, Pusan National University, 30 Jangjeon-dong, Geumjeong-gu, Busan 609-735, Korea Received February 19, 2010 /Accepted March 13, 2010
Genus Phyllostachys is a long-lived woody species primarily distributed throughout South East Asia.
Many species of this genus has been regarded as medically and ecologically important in the world.
We evaluated representative samples of the four taxa with RAPD to estimate genetic relationships within the genus Phyllostachys. The percentages of polymorphic loci were 8.9-33.3% at the species level. P. bambusoides was found to show lower genetic diversity (H=0.018) than other species. Total genetic diversity (HT) was 0.315, genetic diversity within populations (HS) was 0.043, the proportion of total genetic diversity partitioned among populations (GST) was 0.659 and the gene flow (Nm) was 0.0263. As some Korean populations were isolated and patchily distributed, they exhibited low levels of genetic diversity. The four taxa of the genus Phyllostachys analyzed were distinctly related to a monophyletic. P. nigra var. henonis. Stapf was found to be more closely related to P. pubescens than to P. nigra. P. bambusoides was quite distinct from the remaining species.
Key words : Genetic diversity, genus Phyllostachys, phylogenetic relationships, RAPD
*Corresponding author
*Tel:+82-61-380-3473, Fax:+82-61-380-3371
*E-mail : [email protected]
Introduction
Increased effort to broaden our understanding of molec- ular variation in different plant species from South East Asia is needed. One important species of liliopsida is bamboo.
Bamboos have been useful plants for thousands of years.
Bamboo is much easier to produce and equally versatile.
Producing four to five times more biomass than the trees felled for wood production, bamboo grows almost every- where in the world and in enormous variety. In both the tropics and sub-tropics, it achieves great height and thick- ness in a very short time. Economically the bamboo is one of the most important plants to humans. Bamboos are a cheap and sustainable source of building materials, food, and of a source of decorative ornamental garden plants. The woody bamboos are used for matting, thatch, baskets, bam- boo wires, bamboo boxes and scaffolding [11].
The genus Phyllostachys is comprised of about 4~5 species in Korea [14]. The taxonomy of Phyllostachys has been de- scribed mainly through morphological characteristics.
However morphological characteristics are restricted in their
resolving power mainly because of the small number of vari- ables available. Efficient methods to clarify the taxonomic status of several species are much needed. Until recently, much of the Korean forest has been disturbed by the cutting of trees and shrubs for medicine in rural areas [9].
Typical populations of many Phyllostachys species except P. bambusoides are small and distributed in patches. The main concern relative to persistence of Phyllostachys is continued habitat destruction and fragmentation. Consequently, wild Phyllostachys populations have suffered loss individuals, loss of and reduction of populations and fragmentation of re- maining populations by human activities such as over-gath- ering medicinal plants. Thus insights into the relative gene diversity among and within wild populations of Phyllostachys would be useful in plant breeding and also for the develop- ment of strategies for ex situ conservation of plant genetic resources [1].
RAPD assay has been useful in determining genetic rela- tionships among closely related species [2,4]. RAPD analysis is quick, robust, and requires minimal preliminary work [13]. We expected that the RAPD analyses assess the amount and structure of genetic diversity within and between natu- ral populations and more finely discriminate all the tested genotypes than the allozymes [16]. Hence, we successfully
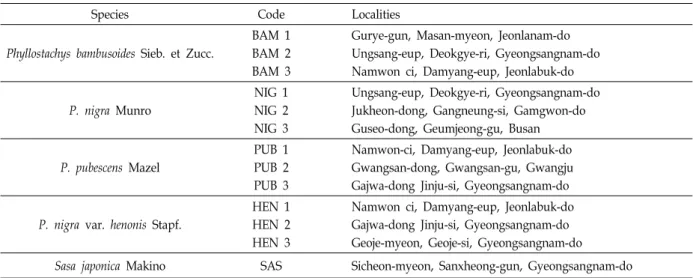
Table 1. Code and locations of the genus Phyllostachys and the standards in this study
Species Code Localities
Phyllostachys bambusoides Sieb. et Zucc.
BAM 1 BAM 2 BAM 3
Gurye-gun, Masan-myeon, Jeonlanam-do Ungsang-eup, Deokgye-ri, Gyeongsangnam-do Namwon ci, Damyang-eup, Jeonlabuk-do
P. nigra Munro
NIG 1 NIG 2 NIG 3
Ungsang-eup, Deokgye-ri, Gyeongsangnam-do Jukheon-dong, Gangneung-si, Gamgwon-do Guseo-dong, Geumjeong-gu, Busan
P. pubescens Mazel
PUB 1 PUB 2 PUB 3
Namwon-ci, Damyang-eup, Jeonlabuk-do Gwangsan-dong, Gwangsan-gu, Gwangju Gajwa-dong Jinju-si, Gyeongsangnam-do
P. nigra var. henonis Stapf.
HEN 1 HEN 2 HEN 3
Namwon ci, Damyang-eup, Jeonlabuk-do Gajwa-dong Jinju-si, Gyeongsangnam-do Geoje-myeon, Geoje-si, Gyeongsangnam-do
Sasa japonica Makino SAS Sicheon-myeon, Sanxheong-gun, Gyeongsangnam-do
assess the genetic relationships among the local populations of Phyllostachys in Korea.
Molecular markers, like RAPD, AFLP, and ISSR are exam- ples of polymerase chain reaction (PCR)-based genetic mark- ers for rapid screening of genetic diversity. These markers have been found to be effective in analyses of genetic varia- tion below the species level, particularly in investigations of population structure and differentiation of sub- populations [18].
The genus Phyllostachys (Bambusaceae) has been an abun- dant plant over its range in Korea. But, reduction of pop- ulations is a serious problem. Many manufacturers sub- stitute bamboos for plastic or iron goods. Korea is a develop- ing country. So fields of bamboo are used for the purposing agricultural land to raise products for industry. Population are reproductively isolated may gradually exhibit genetic differentiation [8]. The rapid loss of new plants results in the permanent loss of gene pools with potential for species conservation. The purposes of this paper are: 1) to estimate how much total genetic diversity is maintained in the spe- cies, and 2) to describe how genetic variation is distributed within and among populations [3].
Materials and Methods
Plant materials
All of the 12 populations were collected from four species in Korea (Table 1). The plant materials consisted of various populations belonging to four species of the genus Phyllostachys. One young leaf per mature tree (≥5 yr) was
sampled. Fifteen plants were randomly collected from each population. In addition, one species of the same family, Sasa japonica was used as standard to compare the phylogenetic relationships.
DNA extraction
The genomic DNA of the 90 samples including standard was extracted from fresh leaves using the plant DNA Zol Kit (Life Technologies Inc., Grand Island, New York, U.S.A.) according to the manufacturer’s protocol.
RAPD analysis
Twenty arbitrarily chosen 10-mer primers, the kit D (OPD-01 to 20) of Operon Technologies (Alameda, Colo.) were used. All the reactions were repeated twice and only reproducible bands were scored for analyses. To analyze the DNA of individuals, we selected nine decamer primers that produced RAPD bands in four species in a preliminary test (Table 2).
Amplification reactions were performed in 0.6 ml tubes containing 25 µl of the reaction buffer; 10 mM Tris-HCl, pH 8.8, 50 mM MgCl2, 100 µM each of dATP, dCTP, dGTP, dTTP, 0.2 mM primer, 2.1 units Taq DNA polymerase, and 25 ng of genomic DNA. The amplification products were separated by electrophoresis on 1.5% agarose gels, stained with ethidium bromide, and photographed under UV light using Polaroid 667 film. A 100 bp ladder DNA marker (Pharmacia) was used in an adjacent lane for the estimation of fragment size.
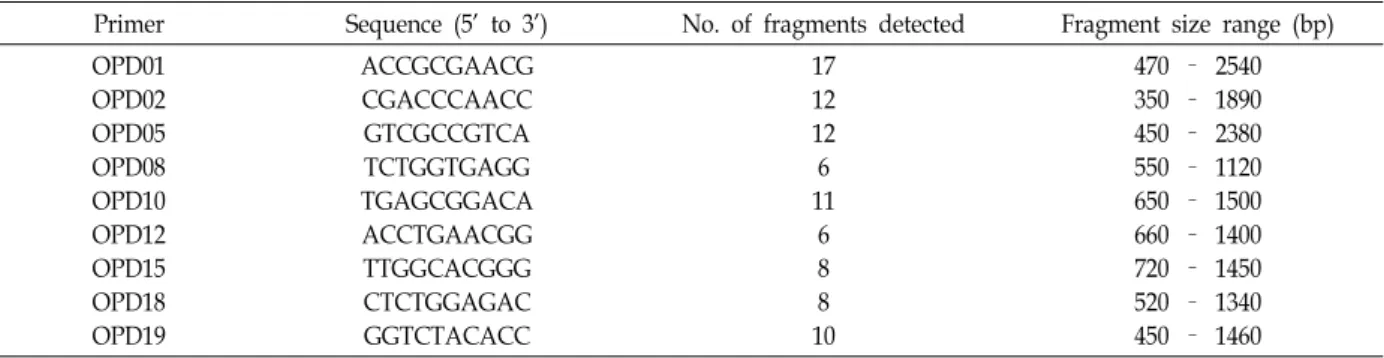
Table 2. List of decamer oligonucleotide utilized as RAPD primers, their sequences, and associated polymorphic fragments amplified in the genus Phyllostachys
Primer Sequence (5’ to 3’) No. of fragments detected Fragment size range (bp) OPD01
OPD02 OPD05 OPD08 OPD10 OPD12 OPD15 OPD18 OPD19
ACCGCGAACG CGACCCAACC GTCGCCGTCA TCTGGTGAGG TGAGCGGACA ACCTGAACGG TTGGCACGGG CTCTGGAGAC GGTCTACACC
17 12 12 6 11
6 8 8 10
470 – 2540 350 – 1890 450 – 2380 550 – 1120 650 – 1500 660 – 1400 720 – 1450 520 – 1340 450 – 1460
Table 3. Measures of genetic variation for RAPD generated among taxa
Species NP PP A Ae H I
P. bambusoides P. nigra P. pubescens P. nigra var. henonis Mean
8 30 26 8 18
8.9 33.3 28.9 8.9 20.0
1.044 1.167 1.144 1.044 1.100
1.031 1.118 1.120 1.037 1.077
0.018 0.074 0.064 0.020 0.044
0.026 0.098 0.092 0.028 0.061 The number of polymorphic loci (Np), percentage of polymorphism (Pp), mean number of alleles per locus (A), effective number of alleles per locus (Ae), gene diversity (H), and Shannon’s information index (I)
Statistical analyses
All RAPD bands were scored by eye and only un- ambiguously scored bands were used in the analyses.
Because RAPDs are dominant markers, it was assumed that each band corresponded to a single character with two al- leles, presence (1) and absence (0) of the band.
The following genetic parameters were calculated using a POPGENE computer program ver. 1.31 [21]. The percent- age of polymorphic loci (PP); mean numbers of alleles per locus (A); effective number of alleles per locus (Ae); and gene diversity (H) [17]. The degree of polymorphism was quanti- fied using Shannon’s diversity index (I) [20].
To analyse the organization of variability within the ge- nus Phyllostachys, we examined the genetic variation by par- titioning the total genetic diversity (HT) to within species components (HS), and the differentiation among species (GST). Furthermore, gene flow (Nm) between the pairs of populations was calculated from GST values by Nm = 0.5(1/GST-1) [15].
The degree of polymorphism was quantified using Shannon’s index of phenotypic diversity [3].
H = –∑ pi log pi
where pi is the frequency of a particular phenotype i [12].
Ho can be calculated and compared for different pop- ulations [18].
HPOP = 1/n ∑ HO
be the average diversity over the n different species and let HSP = –∑ p log p
be the diversity of species calculated from the phenotypic frequencies p in all the species considered together [18]. Then the proportion of diversity presented within species, HPOP/HSP, can compared with that of between species (HSP
– HPOP)/ HSP.
To elucidate the extent of genetic departure of pop- ulations from each other, Nei’s genetic identity (GI) and ge- netic distance (GD) were calculated for each pairwise combi- nation of populations [17]. Homogeneity of variance among species was tested by Bartlett’s statistics.
A phylogenetic tree was constructed by the neighbor-join- ing (NJ) method [19] using the NEIGHBOR program in PHYLIP version 3.57 [5].
Results
From the 20-decamer primers used for a preliminary RAPD analysis, nine primers produced good amplification products both in quality and variability (Table 3). Overall, 90 fragments were generated among the tested Phyllostachys array. Invariant fragments ranged from 6-17 per primer. In a simple measure of intraspecies variability by the percent- age of polymorphic bands, the P. bambusoides and P. nigra var. henonis exhibited the lowest variation (8.9%). The P. ni-
Table 4. Estimates of genetic diversity statistics and polymorphic loci in Phyllostachys species by RAPD
Locus HT HS GST Nm
OPD01 OPD02 OPD05 OPD08 OPD10 OPD12 OPD15 OPD18 OPD19 Mean
0.401 0.303 0.196 0.247 0.326 0.333 0.358 0.372 0.294 0.315
0.067 0.057 0.039 0.053 0.036 0 0.049 0.055 0.027 0.043
0.831 0.601 0.318 0.496 0.678 0.833 0.737 0.787 0.650 0.659
0.161 0.140 0.495 0.301 0.311 0 0.123 0.484 0.354 0.263
Total genetic diversity (HT), genetic diversity within species (HS), proportion of total genetic diversity partitioned among population (GST) and gene flow (Nm) between the pairs of populations.
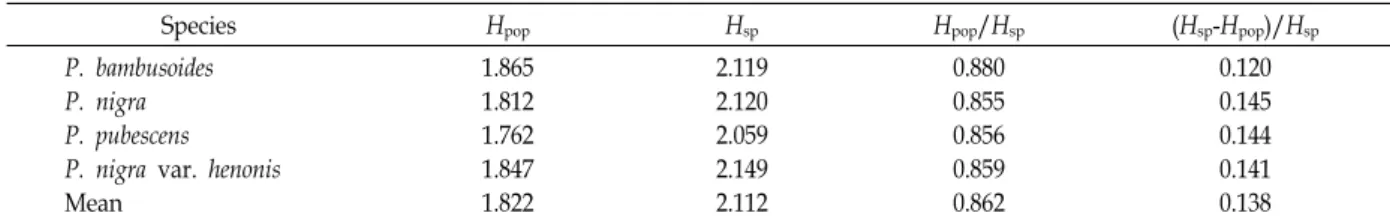
Table 5. Partitioning of the genetic diversity into within and among Phyllostachys species by RAPD
Species Hpop Hsp Hpop/Hsp (Hsp-Hpop)/Hsp
P. bambusoides P. nigra P. pubescens P. nigra var. henonis Mean
1.865 1.812 1.762 1.847 1.822
2.119 2.120 2.059 2.149 2.112
0.880 0.855 0.856 0.859 0.862
0.120 0.145 0.144 0.141 0.138
Compared for different populations (HPOP), the average diversity over the n different species (HSP), the proportion of diversity presented within species (HPOP/HSP), compared with that of between species (HSP–HPOP)/ HSP.
gra showed the highest (33.3%).
The phenotypic frequency of each band was calculated and used in estimating genetic diversity (I) within populations. The mean I of P. nigra (0.098) was highest of all species and was significantly differen (paired t test) from the others. As the typical populations of Phyllostachys were small, isolated, and patchily distributed for natural pop- ulations, they maintained a low level of genetic diversity (mean HT=0.315) (Table 4).
An assessment of the proportion of diversity present within species, HPOP/HSP, indicated that about 13.8% the to- tal genetic diversity was among species (Table 5). Thus, the majority of genetic variation (86.2%) resided within species.
The average number of individuals exchanged between pop- ulations per generation (Nm) was estimated to be very low (0.263).
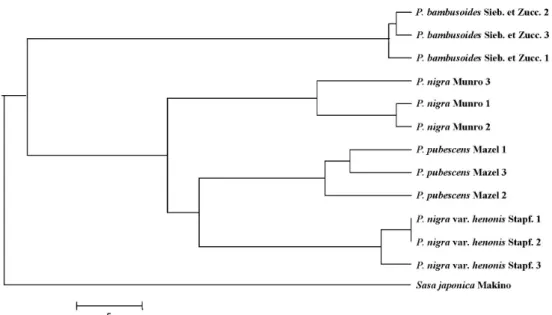
Clustering of three populations per species, using the NJ algorithm, was performed based on the matrix of calculated distances (Fig. 1). The four taxa of genus Phyllostachys ana- lyzed were distinctly related to a monophyletic. P. nigra var.
henonis Stapf was found to be more closely related to P. pu- bescens than to P. nigra. P. bambusoides was quite distinct from remaining species.
Discussion
Genetic diversity and population structure
Genetic diversity of genus Phyllostachys can be com- parable with that of allozyme analysis and other species, al- though the use of different methods (e.g., the number of loci, populations sampled, and the enzyme systems studied) may preclude meaningful direct comparisons. For example, its genetic diversity of 0.044 is lower than that for temper- ate-zone species (0.146), monocots (0.181), species with a sex- ual and asexual reproduction mode (0.120), and long-lived woody habit (0.177) [6].
In this study, RAPDs were used to determine the genetic relationships among 12 populations and the results were compared to pedigree relationships where they were available.
The ultimate result of this study is lacking of intra-pop- ulation variation. 34.1% variation was found among species and about 65.9% within species. The genus Phyllostachys in Korea is moderate or more differentiated than the other vegetative and predominant asexual-reproductive mode species [7].
If an Nm value (0.263) can be considered lower than 1,
Fig. 1. A phylogenetic tree for Phyllostachys based on RAPD analysis.
and as a result, genetic drift should be a factor in genus Phyllostachys. Thus, the levels of gene flow we have calcu- lated are not of sufficient magnitude to counterbalance ge- netic drift and may play a major role in shaping the genetic structure of the populations among species. Fruiting of the genus Phyllostachys is exceptionally infrequent event.
Depending on the species of bamboo, flowering cycles vary from 10 to over 100 years and it has been observed that numbers of one bamboo species flower at the same time in large geographical areas. Most of the Korean populations are regenerated artificially. Populations are reproductively isolated. Therefore, most of the populations have small pop- ulation sizes and are isolated from each other.
Phylogenetic relationships within Phyllostachys This position also varied in phylogenetic trees constructed by molecular markers (Fig. 1). In the phylogeny generated, the four taxa of the genus Phyllostachys analyzed were dis- tinctly related to a monophyletic. Since species of Phyllostachys show a wide range of morphological and geo- graphical variation, it is difficult to elucidate phylogenetic relationships with morphological characteristics [10]. P. bam- busoides was quite distinct from remaining species. This is almost agreement concerning the morphological characters.
P. nigra var. henonis Stapf was found to be more closely related to P. pubescens than to P. nigra. However P. nigra and P. pubescens are closely related, previous morphological
taxonomic work was not proposed as the closest relative.
Stem and branches of P. nigra were black, whereas them of P. nigra var. henonis are not black, but only dark blue and originated from China. At present, the phylogenetic position of this species shown in (Fig. 1). It is seem to be the best, judging from morphological, genetic, and distribution data.
This issue will be clarified in future studies. In addition, P.
nigra var. henonis was strongly differentiated in P. nigra, and thus deserve taxonomic treatment at subspecies or even at species level. Although the size of sampling was not large enough for the genus Phyllostachys, the analyses of RAPDs will certainly provide an enhanced view on the phylogeny of this genus. In addition, It is necessary to identify taxa that additional molecular experiments such as AFLP, SSR, and ITS
Acknowledgement
This work was supported for one years by Damyang-gun Office Research Grant.
References
1. Bartish, I. V., L. P. Garkava, K. Rumpunen, and H. Nybom.
2000. Phylogenetic relationships and differentiation among and within populations of Chaenomeles Lindl. (Rosaceae) es- timated with RAPDs and isozymes. Theor. Appl. Genet. 101, 554-563.
2. Beebe, S., P. W. Skroch, J. Tohme, M. C. Duque, F. Pedraza, and J. Nienhuis. 2000. Structure of genetic diversity among common bean landraces of Middle American origin based on correspondence analysis of RAPD. Crop Sci. 40, 264-273.
3. Bowman, K. D., K. Hutcheson, E. P. Odum, and L. R.
Shenton. 1971. Comments on the distribution of indices of diversity. Stat. Ecol. 3, 315-359.
4. Demeke, T., R. P. Adams, and R. Chibbar. 1992. Potential taxonomic use of random amplified polymorphic DNA (RAPD): a case study in Brassica. Theor. Appl. Genet. 84, 990-994.
5. Felsenstein, J. 1993. PHYLIP (Phylogeny Inference Package) version 3.5s. Distributed by the author. Department of Genetics, Univ. Washington, Seattle.
6. Hamrick, J. L. and M. J. W. Godt. 1989. Allozyme diversity in plant species, pp. 304-319, In Brown, A. H. D., M. T.
Clegg, A. L. Kahler, and B. S. Weir (eds.), Plant population genetics, breeding and genetic resources, Sinauer Associates, Sunderland/MA.
7. Hamrick, J. L., M. J. W. Godt, and S. L. Sherman-Broyles.
1992. Factors influencing levels of genetic diversity in woody plant species. New Forests 6, 95-124.
8. Hongtrakul, V., G. M. Huestis, and S. J. Knapp. 1997.
Amplified fragment length polymorphisms as a tool for DNA fingerprinting sunflower germplasm: genetic diver- sity among oilseed inbred lines. Theoretiocal and Applied Genetics 95, 400-407.
9. Huh, M. K. 1999. Genetic diversity and population structure of Korean Alder (Alnus japonica : Betulaceae). Can. J. For.
Res. 29, 1311-1316.
10. Huh, M. K. and H. W. Huh. 2001. Genetic diversity and phylogenetic relationships in alder, Alnus firma, revealed by AFLP. Korean J. Plant Biol. 44, 33-40.
초록:RAPD분자 마커를 이용한 왕대속 대나무의 유전적 다양성 및 계통 관계
이송진*․허만규1․신현철2․허홍욱
(부산대학교 생물학과, 1동의대학교 분자생물학과, 2국립산림과학원 남부산림연구원)
왕대속 대나무들은 대부분 동남아시아에 분포한다. 전세계적으로 왕대속에 속하는 4종은 의학적, 생태학적으 로 중요시 되어 왔다. 이번 연구에서 우리나라에 자생하고 있는 왕대속 4종을 RAPD마커를 이용하여 유전적 관 계 분석하였다. RAPD분석결과 왕대속에 속하는 4종의 대나무는 명확하게 분류가 되었고 8.9~33.3%로 다형현상 이 나타났다. 특히 왕대는 다른 종들 보다 유전적 다양성이 0.018로 가장 낮게 나왔다. 그리고 집단 내 유전적 다양성(Hs)은 0.315, 집단간 다양성(Gst)은 0.659 그리고 유전자 유동(Nm)은 0.0263로 나타났다. 이는 한국의 왕대 속 집단은 지리적 및 환경적 요인을 받아 유전적 다양성이 낮게 나타났으며 본 연구는 대나무 유전적 다양성 연구에 중요한 기초자료가 될 것으로 사료된다.
11. Huh, M. K. and H. W. Huh. 2002. Genetic diversity and population structure of Pseudosasa japonica (Bambusaceae) in Korea. Bamboo Sci. & Culture 16, 9-17.
12. King, L. M. and B. A. Schaal. 1989. Ribosomal DNA varia- tion and distribution of Rudbeckia missouriensis. Evolution 42, 1117-1119.
13. Kresovich, S., J. G. K. Williams, J. R. MaFerson, E. J.
Routman, and B. A. Schaal. 1992. Characterization of genetic identities and relationships of Brassica oleraceae L. via a ran- dom amplified polymorphic DNA assay. Theor. Appl. Genet.
85, 190-196.
14. Lee, Y. N. 1997. Flora of Korea. Kyo-Hak Publishing Co, Seoul, Korea.
15. McDermott, J. M. and B. A. McDonald. 1993. Gene flow in plant pathosystems. Ann. Rev. Phytopathy. 31, 353-373.
16. Molnar, S. J., L. E. James, and K. J. Kasha. 2000. Inheritance and RAPD tagging of multiple genes for resistance to net blotch in barley. Genome 43, 224-231.
17. Nei, M. 1973. Analysis of gene diversity in subdivided populations. Proc. Natl. Acad. Sci. USA 70, 3321-3323.
18. Paul, S. P., F. N. Wachira, W. Powell, and R. Waugh. 1997.
Diversity and genetic differentiation among populations of Indian and Kenyan tea (Camellia sinensis (L.) O. Kuntze) re- vealed by AFLP markers. Theor. Appl. Genet. 94, 255-263.
19. Saitou, N. and M. Nei. 1987. The neighbor- joining method:
a new method for reconstruction phylogenetic trees. Mol.
Biol. Evol. 4, 406-425.
20. Shannon, C. E. 1948. A mathematical theory of communication. The Bell System Technical Journal 27, 379-423, 623-656.
21. Yeh, F. C., R. C. Yang, and T. Boyle. 1999. POPGENE ver- sion 1.31, Microsoft Windows-based Freeware for Population Genetic Analysis.