https://doi.org/10.11110/kjpt.2017.47.1.11
Plant TaxonomyAssessment of genetic diversity of Prangos fedtschenkoi (Apiaceae) and its conservation status based on ISSR markers
Feruza U. Mustafina*, Eun Hye Kim, Sung-Won Son, Orzimat T. Turginov
1, Kae Sun Chang and Kyung Choi
Korea National Arboretum (KNA), Pocheon 11186, Korea
1
Institute of Gene Pool of Plants and Animals of Uzbek Academy of Sciences (IGPA UzSc), Tashkent 100053, Republic of Uzbekistan (Received 8 January 2017; Revised 5 February 2017; Accepted 3 March 2017)
ABSTRACT:
Prangos fedtschenkoi (Regel et Schmalh.) Korovin (Apiaceae) is an endemic species for moun- tainous Middle Asia, which is both a rare and useful plant. Organic extractions from this species are being used in pharmaceutics and cosmetology. In recent years, P. fedtschenkoi distribution area has considerably decreased, presumably, resulting from human activities such as agriculture, construction works, overgrazing and collection from wild for pharmaceutic purposes. Six populations were found in Uzbekistan and their genetic divergence and differentiation were studied with 10 inter-simple sequence repeat (ISSR) markers, selected out of 101.
Totally 166 amplified ISSR fragments (loci) were revealed, of which 164 were polymorphic. Relatively mod- erate level of polymorphism was found at population level with polymorphic bands ranging from 27.71% to 47.59%. Mean P = 39.05%, N
a=1.40,N
e=1.25, S.I. = 0.21, and H
e= 0.14 were revealed for all loci across six populations. AMOVA showed higher variation among populations (62%) than within them (38%). The Bayes- ian model determined 5 clusters, or genetic groups. The posteriori distribution of the Theta II estimator detected full model identifying high inbreeding, intensified by low gene flow (Nm = 0.3954). Mantel test confined pop- ulation 6 as distinct cluster corresponding to geographic remoteness (R = 0.5137, p ≤ 0.005). Results were used as the bases for developing conserve measures to restore populations.
Keywords:
Prangos fedtschenkoi, endangered, rare resource plant, genetic diversity and differentiation, con- servation measures, ISSR molecular markers, population structure
In Central Asia, Apiaceae is represented by around 110 genera with over 458 species (Pimenov and Leonov, 1993;
Kljuykov and Ukrainskaya, 2010). Certain genera have been studied extensively, due to their economic importance as ornamental plants, food items and spices. Little is known, however, regarding the most of those devoid of economic value, such as Prangos species. One of the first attempts to describe and organize the genus Prangos Lindl. was made by Herrnstadt and Heyn (1977), but not all Central Asian and Caucasian species were represented in their monograph. Later Pimenov and Tikhomirov (1983) devoted their works to some problematic aspects of Umbelliferae-Apoideae and reported about 37 species in the genus. Presently, this genus includes
approximately 46 species. Among all Prangos representatives, only P. bucharica B. Fedtsch., P. pabularia Lindl. and P. trifida (Mill.) Herrnst. and Heyn are widely distributed. All of the remaining species are found around two centers, both in Tethyan floristic region: to the West (from Turkey to west Iran, including Syria and Lebanon) comprising the majority of species; and to the East (east Iran, Afghanistan and Central Asia) (Herrnstandt and Heyn, 1977; Şenol et al., 2011).
Thirteen species of Prangos grow in Turkey (Herrnstadt and Heyn, 1977; Davis et al., 1988; Duman and Watson, 1999;
Duman, 2000; Duran et al., 2005), 16 species are recorded in the Flora Iranica (Herrnstadt and Heyn, 1987), 14 species in the Flora of the USSR (Shishkin, 1950), 4 species in the Flora
*Author for correspondence: [email protected], [email protected]
http://e-kjpt.org, © 2017 the Korean Society of Plant Taxonomists. This is an open-access article distributed under the terms of the Creative Commons Attribution Non-Commercial License (http://creativecommons.org/licenses/by-nc/4.0) which permits unrestricted non-commercial use, distribution, and reproduction in any medium, provided the original work is properly cited.
of Syria (Post, 1932), and 3 species in the Flora Europaea (Tutin, 1968). Four new species were described from Anatolia only during last two decades (Davis et al, 1988; Duman, 2000;
Duran et al., 2005; Pimenov et al., 2005). Recently one new species, P. hulusii S. G. Şenol, H. Yildirim O. Seçman sp. nov.
was reported by Şenol et al. (2011) from Turkey.
Prangos fedtschenkoi is a rare endemic species from mountainous Middle Asia (Shishkin, 1950) more common for the Pamir-Alay than Tien Shan. Several populations are met in Kyrgyz Republic and Tajikistan. But no data are available to date about their present distribution in these countries. Very few populations lately described for Uzbekistan, scattered in more or less continuous areas in central and south-east parts of the country and recently have been reported in the northern regions of the Chimgan Mountains which are peripheral to southern populations of the species. Some of the populations are considered as remnants of previously wide presented species, distributed within unequal and highly fragmented areas.
Significant decline of P. fedtschenkoi populations has resulted mainly from human activities such as agriculture, construction works, overgrazing and collection from wild for pharmaceutic purposes (CACILM, 2006; Limin, 2012), as there are no industrial plantations established for this resource plant. P. fedtschenkoi has lost habitat to agriculture, hence requires implementation of conservation activities as endangered species. In spite of its biological importance as edificator in biotic community and endemic plant, as well as economic importance as valuable resource plant of phytocoumarins, only limited information is available on the extent, distribution, and nature of genetic variability in P.
fedtschenkoi. To our knowledge, this species has never undergone population genetic analysis using molecular markers. The present study aims to investigate the patterns and levels of genetic diversity and differentiation in natural populations of a rare and useful resource plant by using inter- simple sequence repeat (ISSR) genetic markers and to provide basic data for in situ and/or ex situ conservation strategies, management, and restoration of the species.
ISSR technique is a polymerase chain reaction (PCR) based method, reported by Zietkiewicz et al. (1994), which involves amplification of DNA segments between two identical microsatellite repeat regions. The technique uses microsatellite primers usually of 16–25 bp long, of di-, tri- , tetra- or pentanucleotide repeats to target multiple genomic loci. The evaluation of genetic variability among individuals and populations of P. fedtschenkoi was encouraging, because many polymorphic loci were identified easily, in a relatively short
time and at low expenses without any prior knowledge of the genome of the species under study.
Besides, assessment of this species according to the International Union for Conservation of Nature (IUCN) criteria based on field research and population genetic study is highly in demand as it allows applying scientifically stipulated conservation, restoration and reintroduction procedures for this species and until now comparatively low number of Central Asian species are estimated against IUCN criteria and none of Prangos genus.
Materials and Methods
Study species
Prangos fedtschenkoi (Regel et Schmalh.) Korovin (Apiaceae) is a perennial herb species with yellow flowers and obovate entire petals bent inside of corolla and incorporated into multiple umbels of 6–10 cm in diameter. This species belongs to the subfamily Apioidea—a well classified group within Apiaceae Lindl. P. fedtschenkoi is an important source of natural coumarin compositions. This organic composition extracted from different Prangos Lindl. species has been subject of several investigations during the past decades as it is used in pharmaceutical industry as a precursor reagent in the synthesis of a number of synthetic anticoagulant pharmaceuticals similar to dicoumarol and as aromatic enhancer in perfumes and fabric conditioners (Kuzmina, 1963;
Kuznetsova and Belenovskaya, 1969).
This species distributes in Uzbekistan between two contrasting ecological zones: the xerothermic desert and the mesothermic mountain regions. The species grow on fine soil, gravel and rocky slopes, on dry riversides in foothills and low mountains between 200–1,000 m altitudes. Floristic composition of natural habitats of P. fedtschenkoi includes species of Ferula, Eremurus, Achillea, Astragalus, Hordeum, Amygdalus and others. Climatic conditions of this area are continental. Central part of the country (Jizzakh region) and north-east (Tashkent region) are characterized by dry, hot summers and mild winter, south part of the country (Surkhandarya and Kashkadarya regions) is also continental but subtropical in spots. The growth period starts early in spring when the soil is not frozen. Seeds distribute presumably by means of natural factors like wind and water, as well as animals and human. The wind dispersal of the fruits is increased by the development of the wing shape ribs as well as cork-like mericarp.
Field work and conservation status assessment
Literature on P. fedtschenkoi distribution and about 100–120
herbarium specimens had been analyzed before field work.
According to the published data and geo-referenced herbarium specimens, this species was well distributed in about 14 spots (Fig. 1B): Zeravshan range and Ziadin-Zirabulak mountains in Samarkand province (Pimenov et al., 23.05.1981, MНА); in Kashkadarya province; Hissar range, Baysun mountains in Surkhandarya province; Malguzar and Nuratau mountains in Jizzakh province (Pimenov, Kljuykov, 04.07.1991, MW) and in Tashkent province (Regel, 17.06.1880, LE) in Uzbekistan;
over Pamir Alay Mountains: Alay Mount, Mogoltau in Tajikistan (Kuzmina, 19.05.1959, LE; Kuzmina. 01.08.1970, LE; Pimenov et al., 23.06.1988, MW); Turkestan, Alay ridge, Osh region in Kyrgyzstan (Baranova, 20.07.1981, MW) (Shishkin, 1950; Zakirov, 1961; Lyzkov, 2015). Field trips were conducted during 2014–2015 and totally six populations of P.
fedtschenkoi were collected in Surkhandarya, Jizzakh and Tashkent regions (Fig. 1A, Table 1). It suggests that historically P. fedtschenkoi was widely distributed and sharply decreased over last decades. Conservation status of P. fedtschenkoi populations was analysed and visualized by using GeoCat Bridge 2.0 (2015): extension for Esri ArcGIS Desktop with use data of field work, literature data and herbarium material.
GeoCat allows comparing the rate of referenced primary occurrence data to present geographic range of taxon: the extent of occurrence (EOO) and the area of occupancy (AOO) accordingly. IUCN category estimated according to IUCN red list categories and criteria (version 3.1, second edition, 2012).
Sampling
We sampled from size populations that cover the extent of the range (Table 1). Voucher specimens of all populations sampled were deposited at the Tashkent Central Herbarium (TASH). Fresh leaves of P. fedtschenkoi were collected from the middle part of healthy individuals that were separated from each other for about 2–3 m. Total of 60 individuals were sampled from six populations from different areas in Uzbekistan; ten individuals from each population were randomly collected. First five populations (Pop 1–5) were distributed in typical habitat for P. fedtschenkoi and were
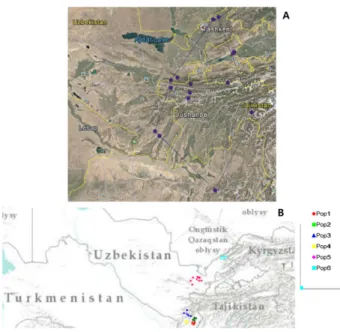
Fig. 1. A. The extent of occurrence of Prangos fedtschenkoipopulations in Central Asia according to reference data. B.
Location of P. fedtschenkoi populations in Uzbekistan. (Map source ArcGIS 10.3.1).
Table 1. Collected samples of Prangos fedtschenkoi populations in Uzbekistan.
No. Populations Coordinates Elevation
(m a.s.l.)
Pop area (m2)
Pop.size/
sample size
Pop density (no. of individuals/ m2) Pop 1 Kizil Naursay village, Left bank of Machay river,
Baysun region, Surkhandarya province.
N38.2092882 E67.2443603
865 20 25/10 1.25
Pop 2 Kizil Naursay village, Baysun region, Surkhandarya province.
N38.2093161 E67.2463478
216 20 25/10 1.25
Pop 3 Fir forest, Kizil Naursay village, Basin of Machay river, Baysun region,
Surkhandarya province.
N38.2094841 E67.2463278
216 30–40 20/10 0.5
Pop 4 Steppe, Kizil Naursay village, Basin of Machay, Baysun region,
Surkhandarya province.
N38.2095241 E67.2461238
216 30–40 25/10 0.62
Pop 5 Turkestan range, Zaamin region, Jizzakh province.
E39.8068151 N68.3883793
846 30 15/10 0.5
Pop 6 Сhimgan Mountain, Pangu river bank, Tashkent province.
N41.439897 E70.0131223
824 30–40 15/10 0.375
considered central range populations, whereas population from Tashkent province were more distinct and peripheral. Healthy leaves were placed into paper bags with small amount of silica gel. DNA extraction was conducted by DNAeasy Plant Mini Kit (Qiagen, Hilden, Germany) and checked by electrophoresis in 1.3% agarose gel, stained with ethidium bromide and run with DNA Ladder (Thermo Scientific, Waltham, MA, USA).
Concentration and quality of DNA were checked with Nanodrop 2000 (Thermo Scientific).
DNA isolation and ISSR-PCR amplification DNA samples of sufficient quality and with high concentration were used in this study. Six natural populations of P. fedtschenkoi were used and 101 primers were screened (Biotechnology Laboratory, University of British Columbia).
From these, ten primers were selected which provided clear and polymorphic bands within all populations. The PCR reaction consisted of 4 μL of DNA (50 ng/μL), 4 μL primer (300 nM), 2 μL of BSA (bovine serum albumin, 0.00025%), 2 μL of 10× PCR reaction buffer (1×), 2 μL dNTP (0.2 mM dNTPs), 2 units of Taq polymerase (Biotherm, Genecreft, UK) and 5.8 μL distilled water for a 20 μL reaction. The amplification was as follows: denature at 94
oC for 1 min 30 s followed by 35 cycles; denature at 94
oC for 40 s; annealing 50
oC for 45 s and extension at 72
oC for 1 min 30 s; ending with final extension at 72
oC for 5 min. The PCR products were checked using gel electrophoresis in 1.3% agarose gel (w/v), with 1× TBE buffer pH 8.0. Bands were sized using DNA Ladder (Thermo Scientific) which was added as 4 μL along with samples. Electrophoresis was run at 160 V, 120–140 mA, during 2 h 30 min. Gel was visualized under UV transilluminator using the gel documentation system (Bio-Rad, Hercules, CA, USA). Bands were considered, if they appeared repeatedly in samples run a minimum of three times.
Genetic diversity and differentiation analysis ISSR fragments are dominant markers and calculated from each plant sample as present (1) or absent (0) for only well- defined bands. Within-population genetic diversity was assessed for each population as (1) percentage of polymorphic loci P; (2) observed number of alleles N
aand effective number of alleles N
e(Kimura and Crow, 1964); (3) geneticdiversity H
eof Nei (1973), or expected heterozygosity; (4) Shannon’s information index (S.I.) (Lewontin, 1972) all implemented in POPGENE 1.32 software (Yeh et al., 1997).
Among population genetic diversity was assessed as (1) F- Statistics: Nei’s (1973) G
stof population structure; (2) gene flow Nm from the estimate of G
st(McDermott and McDonald,
1993); (3) genetic distance: Nei’s (1972) genetic distance sand genetic identity between populations all implemented in POPGENE 1.32 software (Yehetal., 1997); (4) dendrogram based on Nei’s (1972) genetic distances using an unweighte dpair-group method arithmetic average (UPGMA) topology modified from NEIGHBOR procedure of PHYLIP 3.5 by Joe Felsenstein with 1,000 permutations (POPGENE 3.1).
Analyses of molecular variance (AMOVA) were performed to study the partitioning of genetic variation within and among P. fedtschenkoi populations using AMOVA with 999 permutations in GenAlEx 6.2 (Peakall and Smouse, 2012).
Bands were analyzed using the Euclidean distance matrix as per Excoffier et al. (1992). The principle coordinates analysis (PCA) was performed in GenAlEx 6.2 via covariance matrix with data standardization on the basis of pairwise population matrix of Nei's genetic distance (1973).
In order to test for a correlation between genetic distances (G
st) and geographical distances (km) among populations, a Mantel test was performed using the program GenAlEx 6.2 (Peakall and Smouse, 2012) (computing 999 permutations).
Hierarchical and model based cluster analysis Bayesian-based method Structure 2.3.3 was also applied to infer gene-pool structure in genetic data and to assume how many clusters, or genetic groups (k) were most appropriate for interpreting the data. The original data matrices were imported into the Structure 2.3.3 program (Pritchard et al., 2000). The results of 10 runs for each value of Δk were combined using algorithm CLUMPP with the length burn-in period of 50,000 at 50,000 Markov chain Monte Carlo (MCMC) repetitions without prior information on sampling location and phenotype data and assuming correlated allele frequencies and admixture ancestry model. The summary for each value of Δk were displayed graphically. The mean membership proportion of each individual described the likelihood of that individual belonging to the respective clusters. The color coding output was used to show the assignments of individuals in each population to the clusters. Two approaches were applied to determine the best Δk with STRUCTURE HARVESTER (Earl and vonHoldt, 2012): (1) following the recommendations by Evanno et al. (2005), the ad hoc statistic Δk were calculated based on the rate of change in the log likelihood of data between consecutive k values and (2) following the recommendations of Rosenberg et al. (2001) with use L(K) = Ln P(D). Mean F
stvalues for each cluster were calculated on the bases of pairwise calculation of Ln P(D) for population.
Population structure was investigated by HICKORY 1.1
(Holsinger et al., 2002; Holsinger and Lewis, 2003). HICKORY
1.1 allowed evaluating the departures from Hardy–Weinberg equilibrium in dominant as well as co-dominant markers. The ISSR data were fitted to four models: ‘full model,’ which allows for inbreeding, ‘f = 0’ model, which implies lack of inbreeding,
‘theta = 0’ model, which implies a zero-valued F
stanalogue (i.e., no differentiation between populations), and ‘ffree’ model, which decouples the estimates of f andt heta. Default parameters were used incomputation: burn-in = 5000, number of samples = 25,000, and thinning factor = 5.
To estimate the best fit of the four models, the Deviance information criterion (DIC) (Spiegelhalter et al., 2002) was used with interpretations following the recommendations given in the manual. The posteriori distribution of the Theta II estimator (the estimate of F
st) was numerically approximated through an MCMC.
Results
Field work and conservation status assessment The EOO of P. fedtschenkoi estimated by using GeoCat Bridge 2.0 was 162,580,746 km² based on published data (Fig.
1A), which is applicable to Least endangered according to IUCN Red List Categories and Criteria (version 3.1, 2012).
The AOO was estimated at 56, 000 km² based on field work (Fig. 1B), addressing Endangered IUCN category.
Genetic diversity and differentiation
One hundred sixty-six amplified ISSR fragments (loci) were revealed from the 60 samples from 6 natural populations of P.
fedtschenkoi with 10 markers: 164 loci were polymorphic and
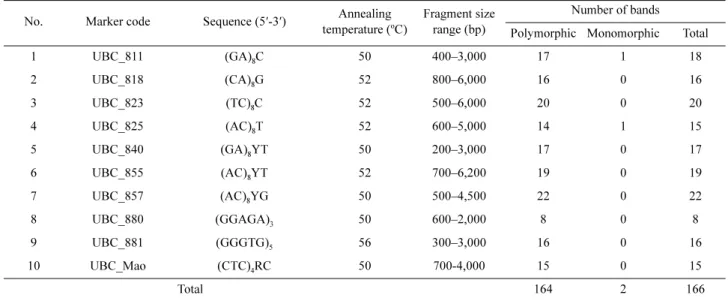
2 loci were monomorphic (loci #8 and 108). The number of amplified fragments varied depending on primer used, with the most informative primer being UBC857. Molecular weights of the bands vary from 300 bp to 6,000 bp (Fig. 2, Table 2).
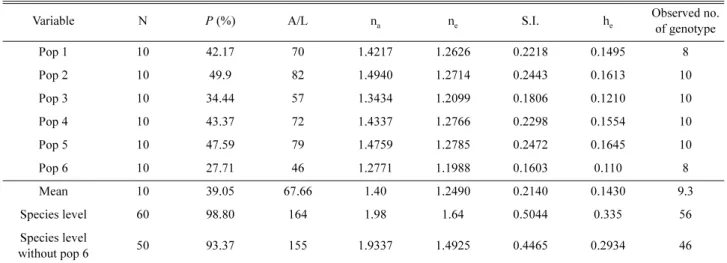
The highest degree of genetic diversity occurred in population 2 from Surkhandarya province (Pop 2: P = 49.9, N
a= 1.4940, N
e= 1.2714, H
e= 0.1613, A/L = 82) while the diversity was lowest in population 6 from Tashkent province (Pop 6: P = 27.71, N
a= 1.2771, N
e= 1.1988, H
e= 0.110, A/
L=46) with a mean value P = 39.05, N
a= 1.40, N
e= 1.249, H
e= 0.143, A/L = 67.66 (Table 3). S.I. ranged from 0.1603 (population 6) to 0.2472 (population 5) with mean value 0.214.
Low value of gene flow N
m= 0.3954 testified low gene exchange between populations resulting in differentiation between populations measured with mean value of Nei’s G
st=0.5584(1973).
Table 2. ISSR (inter-simple sequence repeat) primer sequences, number of fragments scored and approximate size range (in base pairs) of the fragments resulted from each primer probing 60 samples from 6 populations of Prangos fedtschenkoi in Uzbekistan.
No. Marker code Sequence (5′-3′) Annealing temperature (oC)
Fragment size range (bp)
Number of bands Polymorphic Monomorphic Total
1 UBC_811 (GA)8C 50 400–3,000 17 1 18
2 UBC_818 (CA)8G 52 800–6,000 16 0 16
3 UBC_823 (TC)8C 52 500–6,000 20 0 20
4 UBC_825 (AC)8T 52 600–5,000 14 1 15
5 UBC_840 (GA)8YT 50 200–3,000 17 0 17
6 UBC_855 (AC)8YT 52 700–6,200 19 0 19
7 UBC_857 (AC)8YG 50 500–4,500 22 0 22
8 UBC_880 (GGAGA)3 50 600–2,000 8 0 8
9 UBC_881 (GGGTG)5 56 300–3,000 16 0 16
10 UBC_Mao (СTС)4RС 50 700-4,000 15 0 15
Total 164 2 166
Fig. 2. An example of the molecular profile generated by primer UBC_811 for six populations of Prangos fedtschenkoi.
To assess the overall distribution of diversity within and among these populations, an AMOVA analysis was completed.
The AMOVA revealed that there were highly significant (p <
0.01) genetic differences among the six populations of P.
fedtschenkoi. Of the total genetic diversity, 62% of the variance occurred among populations and 38% occurred among individuals within populations (Table 4). Thus, AMOVA also supported the results of Nei’s genetic statistics and Shannon’s
diversity estimation of a high degree of differentiation among populations.
The PCA defined strong partition of population 6 from the remainder of populations (Fig. 3). The first three PC axes accounted for 33.11%, 22.74%, and 16.05%, respectively, of the total variance. The most of populations gathered within the first two coordinate axes, accounted for 55.85% of the total variance in the data. PCA proved the differentiation into four
Table 3. Overall gene frequency summary of genetic variation statistics for all loci in POPGENE of six populations of Prangos fedtschenkoi in Uzbekistan (POPGENE 1.31).Variable N P (%) A/L na ne S.I. he Observed no.
of genotype
Pop 1 10 42.17 70 1.4217 1.2626 0.2218 0.1495 8
Pop 2 10 49.9 82 1.4940 1.2714 0.2443 0.1613 10
Pop 3 10 34.44 57 1.3434 1.2099 0.1806 0.1210 10
Pop 4 10 43.37 72 1.4337 1.2766 0.2298 0.1554 10
Pop 5 10 47.59 79 1.4759 1.2785 0.2472 0.1645 10
Pop 6 10 27.71 46 1.2771 1.1988 0.1603 0.110 8
Mean 10 39.05 67.66 1.40 1.2490 0.2140 0.1430 9.3
Species level 60 98.80 164 1.98 1.64 0.5044 0.335 56
Species level
without pop 6 50 93.37 155 1.9337 1.4925 0.4465 0.2934 46
Mean Nm = 0.3954 (Nm* = 0.5(1 – Gst)/Gst (McDermott and McDonald, 1993). Mean Gst Nei (1973) = 0.5584.
Observed no. of genotype was defined from GenAlEx 6.2.
N, number of individuals; P, percentage of polymorphic loc; A, number of alleles per loci; na, observed number of alleles; ne, effective number of alleles; he, Nei's (1973) gene diversity; S.I., Shannon's Information index.
Table 4. Results of the analysis of molecular variance (AMOVA) for six populations of Prangos fedtschenkoi in Uzbekistan with GenAlEx 6.2 from 999 permutations.
Source of
variation d.f. Sum of
squares
Mean square
Variance components
Percentage of variation**
Among populations 5 1,020.033 204.007 19.199 62
Within populations 54 648.800 12.015 12.015 38
Total 59 1,668.833 31.214 100
**p
≤
0.01.Fig. 3. Principle coordinates analysis (PCA) performed in GenAlEx 6.2 via covariance matrix with data standardization on the basis of Nei's genetic distance (Nei, 1973).
major clusters: cluster 1 contained populations 1 and 2, while cluster 2 contained genotype of population 3, cluster 3 contained population 4 and 5 and population 6 represented apart in a fourth cluster.
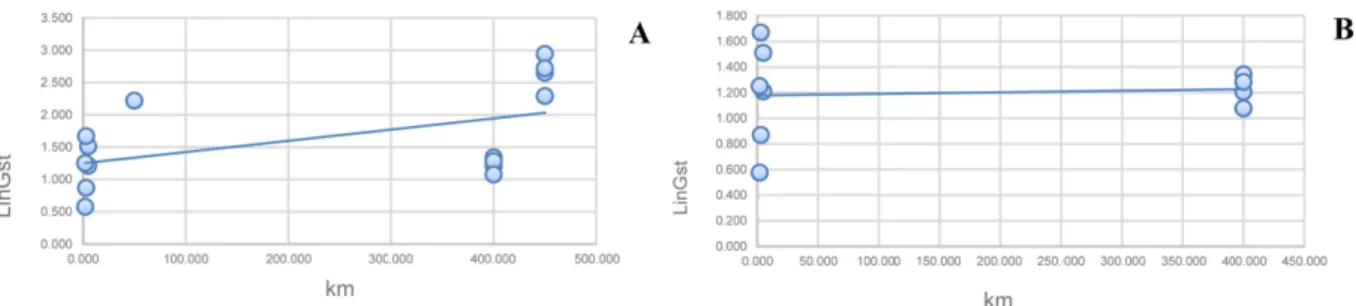
Significant correlation between Nei’s genetic distances (1972) and geographical distances between populations using the Mantel test was defined for all populations (R = 0.5137, p ≤ 0.005) (Fig. 4A), testifying increase of genetic differentiation with geographic remoteness. But no correlation was found in analyses with exception of the most remote population 6 from the Mantel test (R = 0.0787, p = 0.6) (Fig. 4B).
Hierarchical and model-based cluster analysis The Bayesian model used in Structure 2.3.3 determined the best Δk was 5 clusters, or genetic groups (Fig. 5A, B). The decision was made based on statistic k, which corresponded to the highest peak of this modal value appropriate to the number of clusters (genetic groups).
The model based clustering into five genetic groups corresponded to distance based clustering with UPGMA, which grouped populations 1 and 2 with population 3,
populations 4 and 5 grouped together in one cluster and population 6 represented apart in a fifth cluster (Fig. 6A, B).
Both model-based (Structure 2.3.3) and distance-based (UPGMA, PCA) clustering analysis demonstrated similar patterns of populations combination into clusters and separation of population 6 from Tashkent province into genetically distinct group, confined with Mantel test as the result of geographic remoteness.
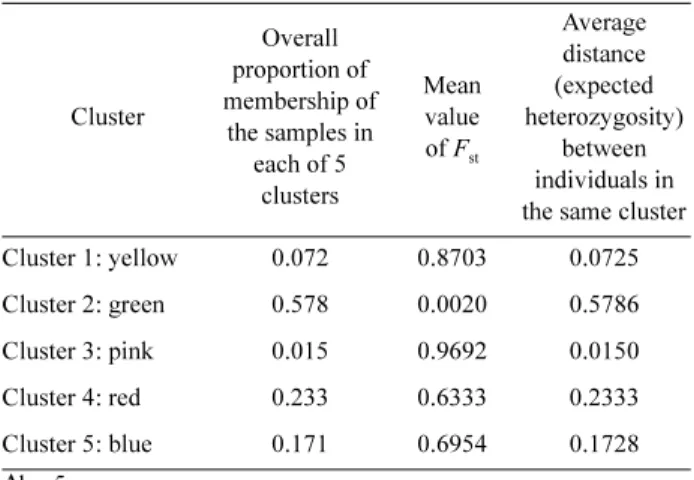
Overall proportion of membership of the samples in each of 5 clusters was examined more closely with Structure 2.3.3 based on 166 loci depicted in multiple lines for 60 individuals (Table 5). High degree of inter-population genetic differentiation was observed in this plot. But some members of these populations contained alleles from the other populations (differently colored segments). For example, members of Surkhandarya population contained alleles (colored segments) from both Jizzakh and Tashkent populations. However, most samples had the highest share of membership and lowest value of F
stwith in cluster 2, which included, presumably, populations 1–3 from Surkhandarya province (green in Fig. 7) and the lowest membership proportion and highest F
stobserved for cluster 3 (pink) which
Fig. 4. A. Correlation between geographic remoteness and genetic distance (Nei, 1972) calculated in GenAlEx 6.2 for populations 1–6. R² = 0.5137 and p≤
0.005 from 999 permutations. B. Correlation between geographic remoteness and genetic distance (Nei, 1972) calculated in GenAlEx 6.2 for populations 1–5. R² = 0.0787 and p = 0.6 from 999 permutations.Fig. 5. Graphical display of best
Δ
k result determined with Structure Harvester (Earl and vonHoldt, 2012): ad hoc statisticΔ
k was calculated based on the rate of change in the log likelihood of data between consecutive k values (Evanno et al., 2005) (A) and with use L(K) = Ln P(D) (Rosenberg et al., 2001) (B).presented mostly population 4. The order of samples in a line was presented from population 1 to 6.
Another Bayesian genetic structure analysis of P.
fedtschenkoi with Hickory 1.1 identified full model with Theta II = 0.57 and f = 0.46 as best model which was represented with the lowest DIC (DIC = 2026.89). The second best was f
= 0 (DIC = 2077.61) with Theta II = 0.52. In both cases Theta II values were lower than the F
stpresented by AMOVA, though
Fig. 6. A. Results of Structure 2.3.3 analyses for Prangos fedtschenkoi based on 166 loci obtained with 10 inter-simple sequence repeat dominant markers.
Δ
k = 2, 3, 4, and 5 depicted in single line. B. Dendrogram based Nei's (1972) genetic distance between populations of P. fedtschenkoi calculated with unweighted pair-group method arithmetic average.Table 5. Description of the clusters (genetic groups) resulted from Structure 2.3.3 analyses for Prangos fedtschenkoi based on 166 loci obtained with 10 markers.
Cluster
Overall proportion of membership of
the samples in each of 5
clusters
Mean value of Fst
Average distance (expected heterozygosity)
between individuals in the same cluster
Cluster 1: yellow 0.072 0.8703 0.0725
Cluster 2: green 0.578 0.0020 0.5786
Cluster 3: pink 0.015 0.9692 0.0150
Cluster 4: red 0.233 0.6333 0.2333
Cluster 5: blue 0.171 0.6954 0.1728
Δ
k =5.Table 6. Genetic structure analysis with Hickory 1.1.
Model DIC f Theta II
Full 2,026.89 0.46 0.57
f = 0 2,077.61 0 0.52
Theta II 7,316.72 0.95 0
f free 2,122.41 0.5 0.58
Default values for computations were used as follows: Burn-in = 5000, sample = 25,000, thinning factor = 5. DIC, deviance information criterion.
Fig. 7. Results of Structure 2.3.3 analyses for Prangos fedtschenkoi based on 166 loci obtained with 10 markers. ∆k = 5 depicted in multiple lines for 60 individuals. Surkh, Surkhandarya province; Jizzakh, Jizzakh province; Tash, Tashkent province.