INTRODUCTION
Following the introduction of kidney transplantation in the 1950s, it has become essential for the improvement of quality of life for end-stage renal disease (ESRD) patients.
However, as the demand for donor kidneys has increased,
living donors are now a major source for kidney trans- plantation in Korea [1]. Improved outcomes and reduced waiting times are some of the merits of living donor kid- ney transplantation [2], but is not without its shortcom- ings, and the risk of mortality or renal failure of living do- nors remains a concern [3].
Long-term compensation of renal function after donor nephrectomy
Yong Pyo Lee
1, Soo Jin Kim
2,3, Juhan Lee
2,3, Jae Geun Lee
2,3, Kyu Ha Huh
2,3, Dong Jin Joo
2,3, Soon Il Kim
2,3, Yu Seun Kim
2,3, Myoung Soo Kim
2,31Department of Medicine, Yonsei University College of Medicine, Seoul, Korea
2Department of Surgery, Yonsei University College of Medicine, Seoul, Korea
3The Research Institute for Transplantation, Yonsei University College of Medicine, Seoul, Korea
Background: Living donors are the major source of kidneys in countries with a shortage of deceased donors. Kidney donation after careful donor selection is generally accept- ed as a safe procedure, but the physiologic consequences after donor nephrectomy are not fully verified. In this study we retrospectively reviewed the renal function of the residual kidney in living donors.
Methods: Post-nephrectomy laboratory data of 1,175 living donors (60.7%) from 1,933 living donors who received uninephrectomy from January 1999 to December 2017 at Yonsei University, Severance Hospital, Korea were retrospectively collected. Post-ne- phrectomy renal function was monitored by the relative ratio of estimated glomerular filtration rate (e-GFR; pre-nephrectomy e-GFR ratio vs. post-nephrectomy e-GFR) that was calculated by the Modification of Diet in Renal Disease formula.
Results: During 36.3±37.6 months of mean follow-up, two cases (0.17%, 2/1,175) of renal failure developed. The mean e-GFR decreased to 64.3±14.2 mL/min/1.73 m
2im- mediately after nephrectomy from 99.2±19.9 mL/min/1.73 m
2of the pre-nephrectomy e-GFR. Early decrement of e-GFR was prominent in male and obese donors (body mass index >25 kg/m
2, P<0.05). The e-GFR ratio increased according to post-nephrectomy duration, and the mean increment degree of e-GFR ratio after nephrectomy calculated by linear regression analysis was 1.94% per year. Unlike the early decrement of e-GFR ratio after nephrectomy, donor factors such as degree of obesity and donor sex did not affect the late increment of e-GFR ratio after nephrectomy (P>0.05).
Conclusions: Our data showed that long-term compensation of the renal function after nephrectomy occurs independently of preoperative donor characteristics.
Keywords: Glomerular filtration rate; Nephrectomy; Living donors; Kidney transplantation
Received April 18, 2019 Revised February 17, 2020 Accepted March 20, 2020
Corresponding author: Myoung Soo Kim Department of Surgery, Yonsei University College of Medicine, 50-1 Yonsei-ro, Seodaemun-gu, Seoul 03722, Korea Tel: +82-2-2228-2123
Fax: +82-2-313-8289 E-mail: [email protected]
© The Korean Society for Transplantation This is an Open Access article distributed under the terms of the Creative Commons Attribution Non-Commercial License (http://creativecommons.org/licenses/
by-nc/4.0/) which permits unrestricted non-commercial use, distribution, and reproduction in any medium, provided the original work is properly cited.
pISSN 2671-8790
eISSN 2671-8804
Compensatory hypertrophy has been observed af- ter unilateral or partial nephrectomy [4-6], and the renal functional reserve has also been assessed along with the consequences of hyperfiltration [7-11]. Preoperative fac- tors, such as obesity, hypertension, and proteinuria have been known to influence the renal function after unilateral nephrectomy [12-14]; in addition, old age has been asso- ciated with reduced renal reserve [15]. Older or overweight kidney donors have a lower post-donation reserve capac- ity, but obesity has a greater impact on loss of renal re- serve in younger donors, suggesting that younger donors with obesity must be monitored carefully [16]. Most of the previous studies have focused on the risk factors and pathophysiology of renal failure or other comorbidities [10,17-19]. Edgren et al. [4] reported that renal function reached 77% of its initial level in kidney donors after a mean follow-up of 3 years. Several studies on donor renal function have also reported that renal function reaches 70%–75% of its initial pre-nephrectomy renal function [17,20,21].
This study retrospectively reviewed the renal function of living donors after nephrectomy in order to understand the long-term postoperative changes in renal function, and also define the factors related to renal function com- pensation.
METHODS
Data for 1,933 living kidney donors from January 1999 to December 2017 at Yonsei University, Severance Hospital, Korea were collected. The follow-up hospital records of 1,175 donors (60.7%) were available. The selection criteria of donors at donor nephrectomy were: (1) pre-nephrecto- my serum creatinine level below 1.5 mg/dL, (2) no radio- logic abnormality in bilateral kidneys, and (3) no history of
hypertension, diabetes or active hepatitis. Donor nephrec- tomy was performed by conventional open nephrectomy or video assisted mini-laparotomy surgery. The estimated glomerular filtration rate (e-GFR), as determined by the Modification of Diet in Renal Disease (MDRD) study, was used. Hospital records were retrospectively reviewed to evaluate the residual renal function and renal impairment.
Early e-GFR was defined as the e-GFR at the early peri- od (usually within 5 days of nephrectomy) and late e-GFR was defined as e-GFR at the time of the most recent follow-up. The e-GFR ratio was the relative e-GFR rep- resented by the ratio of post-nephrectomy e-GFR versus pre-nephrectomy e-GFR. Renal failure was defined using the Kidney Disease Outcomes Quality Initiative Chronic Kidney Disease classification, the need for dialysis, or e-GFR<15 mL/min/1.73 m
2.
Donor sex, age, and body mass index (BMI) were ana- lyzed for variables affecting the donor residual renal func- tion after nephrectomy. Patients were categorized and analyzed according to their BMI (BMI <25 kg/m
2and ≥25 kg/m
2groups; normal and obese groups, respectively) and age (<35 years and ≥35 years) and analyzed [22,23].
Statistical analysis was performed using Student t-test.
The relevance between factors was analyzed using linear regression. Multivariate linear regression was used to de- termine factors significantly related to post-nephrectomy e-GFR. A general linear model was applied to compare the donor factors in combination with follow-up period. A P-value <0.05 was defined as statistically significant.
HIGHLIGHTS
• The immediate postoperative estimated glomerular filtration rate decreased to about 65.5% of its primary function which is affected by the sex and body mass index of the donor.
• In the long term, we found that compensation of renal function occurs over time, regardless of donor factors.
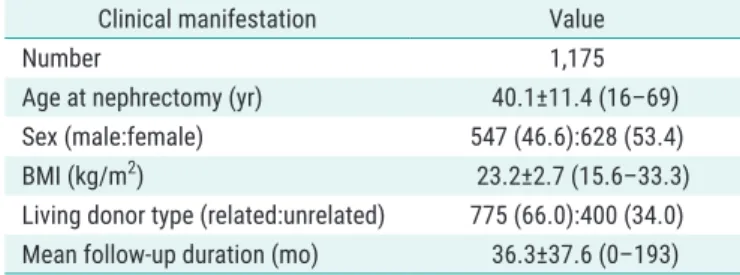
Table 1. Donor demographics
Clinical manifestation Value
Number 1,175
Age at nephrectomy (yr) 40.1±11.4 (16–69)
Sex (male:female) 547 (46.6):628 (53.4)
BMI (kg/m
2) 23.2±2.7 (15.6–33.3)
Living donor type (related:unrelated) 775 (66.0):400 (34.0) Mean follow-up duration (mo) 36.3±37.6 (0–193) Values are presented as mean±standard deviation (range) or number (%).
BMI, body mass index.
RESULTS
Donor Characteristics and Renal Failure after Donor Nephrectomy
The clinical characteristics of 1,175 donors whose hos- pital records were retrospectively collected are shown in Table 1. Of the 1,175 donors, two donors developed renal failure and were on dialysis (2/1,175; 0.17%); renal failure occurred at 34 months and 57 months after nephrectomy.
The cause of ESRD was hypertension in one case and dis- ease of unknown origin in the other case.
Early Change of Renal Function after Donor Nephrectomy The mean age at the time of donation was 40.1±11.4 years (16–69 years). The pre-nephrectomy mean e-GFR was 99.2±19.9 mL/min/1.73 m
2, and the mean serum creatinine was 0.82±0.17 mg/dL. In the immediate post- operative period, the early e-GFR dropped to 64.3±14.2 mL/min/1.73 m
2, and the serum creatinine increased to 1.21±0.29 mg/dL.
Donor sex and BMI showed statistically significant rel- evance with early decrease in renal function, and the early e-GFR was significantly lower in males compared to fe- males. The mean early e-GFR was 62.1±12.2 mL/min/1.73 m
2, 66.1±15.4 mL/min/1.73 m
2in males and females, respectively. The decrement of the early e-GFR ratio was statistically greater in males than in females (64.1%±10.2%
vs. 66.7%±13.0%, P<0.001). Donor BMI also showed neg- ative correlation with the early e-GFR ratio, and the slope of the relationship between the early e-GFR ratio and BMI was –0.53 (P<0.001) by linear regression analysis.
The early e-GFR ratio in BMI <25 kg/m
2and ≥25 kg/m
2groups were compared and showed significant difference (P<0.001). However, age was not significantly associated with early e-GFR, and by linear regression analysis, age at donation showed no significant relationship to the early e-GFR ratio. The early e-GFR ratio was analyzed in groups age <35 years and ≥35 years, and there was no significant difference between the two age groups (P=0.277) (Table 2).
Stepwise multiple linear regression was used for ver- ification of donor factors affecting renal function after nephrectomy. Donor BMI and sex showed significant cor- relation with the early change of renal function (Table 3).
Late Change of Renal Function after Donor Nephrectomy The mean follow-up period was 36.3±37.6 months (0–193 months), and the mean late e-GFR was 70.2±13.3 mL/
min/1.73 m
2(e-GFR ratio, 72.0%±13.5%) (Fig. 1). The late e-GFR ratio significantly increased according to the fol- low-up period, and the e-GFR increased 1.94%±0.10% of its initial e-GFR per year (P<0.001) (Fig. 2).
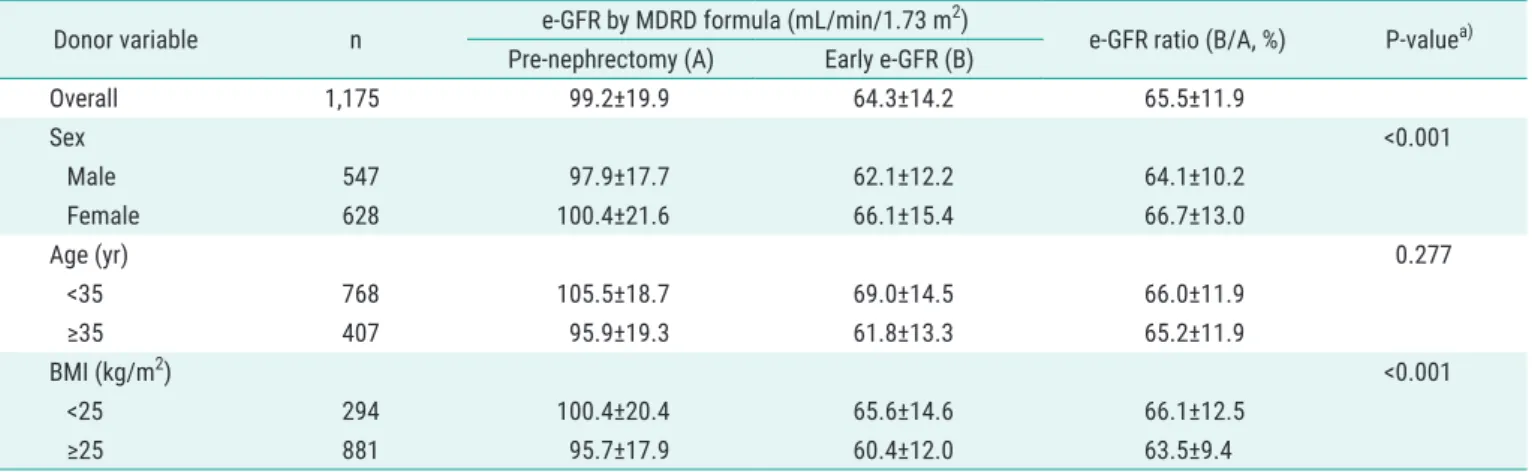
Table 2. Early changes of renal function after donor nephrectomy (n=1,175)
Donor variable n e-GFR by MDRD formula (mL/min/1.73 m
2)
e-GFR ratio (B/A, %) P-value
a)Pre-nephrectomy (A) Early e-GFR (B)
Overall 1,175 99.2±19.9 64.3±14.2 65.5±11.9
Sex <0.001
Male 547 97.9±17.7 62.1±12.2 64.1±10.2
Female 628 100.4±21.6 66.1±15.4 66.7±13.0
Age (yr) 0.277
<35 768 105.5±18.7 69.0±14.5 66.0±11.9
≥35 407 95.9±19.3 61.8±13.3 65.2±11.9
BMI (kg/m
2) <0.001
<25 294 100.4±20.4 65.6±14.6 66.1±12.5
≥25 881 95.7±17.9 60.4±12.0 63.5±9.4
Values are presented as mean±standard deviation.
e-GFR, estimated glomerular filtration rate; MDRD, Modification of Diet in Renal Disease; BMI, body mass index.
a)
P-value calculated by comparison mean (Student t-test) of e-GFR ratio by variables.
Table 3. Stepwise multiple linear regression analysis for early changes in
renal function
Variable Beta Standard error P-value
Constant 77.219 2.956 <0.001
BMI –0.460 0.128 <0.001
Sex –2.174 0.705 0.002
R
2=0.023, F=9.515, P<0.001. Excluded variable: age.
BMI, body mass index.
Donor age, sex, and BMI showed no significant cor- relation with the late e-GFR. The age of the donor at the time of donation had no linear correlation to the late e-GFR ratio. The BMI of the donor at the time of donation also had no correlation with the late e-GFR ratio, although in the immediate postoperative period, a higher donor BMI resulted in a greater decrease in e-GFR. The late e-GFR ratio showed no significant difference in terms of sex, age (<35, ≥35 years), or BMI (<25, ≥25 kg/m
2) (Table 4).
The donor variables and the late e-GFR ratio were analyzed by stepwise multiple linear regression. Results showed that the follow-up period was the only significant factor explaining the compensation of the donor renal function. The donor variables: sex, age, and BMI at dona-
tion were excluded (P<0.001) (Table 5).
The effects of the donor variables combined with the follow-up period on the late e-GFR ratio were analyzed.
Donors <35 years and ≥35 years were analyzed in combi- nation with follow-up time. We found no significant differ- ence in the effects of the two age groups combined with follow-up period on the late e-GFR ratio (P=0.104) (Fig.
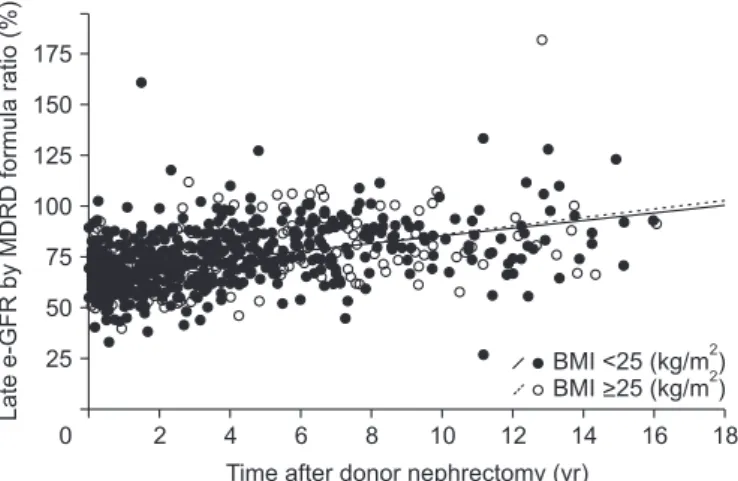
3). When BMI was grouped into <25 kg/m
2and ≥25 kg/m
2groups, there was no significant difference between the effects of the two groups in combination with follow-up period on the late e-GFR ratio (P=0.466) (Fig. 4). There was a statistically significant difference in the late e-GFR ratio between males and females when they were ana- lyzed in combination with follow-up time. Female donors
0 175 150 125 100 75 50 25
220
Numberofpatients
e-GFR by MERD study (mL/min/1.73 m )2 20 40 60 80 100 120 140 160 180 200
Pre-nephrectomy 99.2+19.9
Long-term, post-nephrectomy 70.2+13.3
Immediate post-nephrectomy 64.3+14.2
Fig. 1. Change of estimated glomerular filtration rate (e-GFR) by Modifica-
tion of Diet in Renal Disease (MDRD) formula at pre- and post-nephrecto- my. Values are presented as mean±standard deviation.
0 175 150 125 100 75 50 25
18
Latee-GFRbyMDRDformularatio(%)
Time after donor nephrectomy (yr)
2 4 6 8 10 12 14 16
Fig. 2. Late compensation of residual renal function after donor nephrec-
tomy. y=66.216+0.162*×(R
2=0.199, P<0.001). e-GFR, estimated glomeru- lar filtration rate; MDRD, Modification of Diet in Renal Disease.
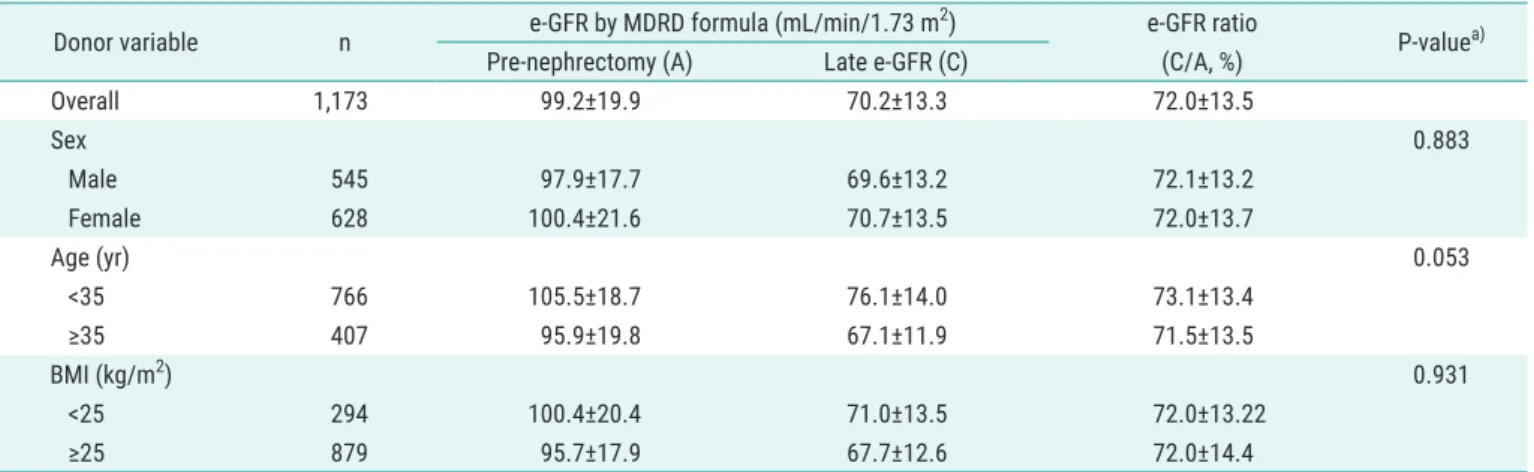
Table 4. Late changes of renal function after donor nephrectomy (n=1,173, excluding two cases of renal failure)
Donor variable n e-GFR by MDRD formula (mL/min/1.73 m
2) e-GFR ratio
(C/A, %) P-value
a)Pre-nephrectomy (A) Late e-GFR (C)
Overall 1,173 99.2±19.9 70.2±13.3 72.0±13.5
Sex 0.883
Male 545 97.9±17.7 69.6±13.2 72.1±13.2
Female 628 100.4±21.6 70.7±13.5 72.0±13.7
Age (yr) 0.053
<35 766 105.5±18.7 76.1±14.0 73.1±13.4
≥35 407 95.9±19.8 67.1±11.9 71.5±13.5
BMI (kg/m
2) 0.931
<25 294 100.4±20.4 71.0±13.5 72.0±13.22
≥25 879 95.7±17.9 67.7±12.6 72.0±14.4
e-GFR, estimated glomerular filtration rate; MDRD, Modification of Diet in Renal Disease; BMI, body mass index.
a)
P-value calculated by comparison mean (Student t-test) of e-GFR ratio by variables.
showed a greater renal compensation rate compared to male donors (P=0.004) (Fig. 5).
DISCUSSION
The safety of the donors has been the primary concern of the transplant society since the introduction of living donor kidney transplantation [24]. Although there are concerns about glomerular hyperfiltration, proteinuria, hy- pertension, and other cardiovascular risks, several studies have reported that kidney donation is relatively safe and that the survival of donors is similar to that of the gener- al population [25,26]. While the risk of ESRD in donors is higher, the absolute risk remains low [27,28]. The rate of ESRD was 0.17% (2/1,175) in our study.
The e-GFR of the donor decreases immediately after donor nephrectomy. After nephrectomy, the renal function is partially compensated and is reported to recover 70%–
75% of its initial GFR [17,20,21]. ter Wee et al. [29] reported
that the GFR of kidney donors increased for years after donation, probably due to compensatory hypertrophy of the remaining kidney. Furthermore, Rook et al. [30] re- ported that baseline GFR, BMI, and age were independent predictors for renal function impairment after living do- nor donation. However, this study had a relatively short follow-up period after donation. We studied the factors affecting the rate of compensation and demonstrated that the immediate decrease in renal function was affected by the sex and BMI of the donor. Overweight donors showed a greater decrease in e-GFR after nephrectomy; however, during follow-up, the compensatory rates were similar
Table 5. Stepwise multiple linear regression analysis for late changes ofrenal function
Variable Beta Standard error P-value
Constant 66.216 0.495 <0.001
Post-nephrectomy period 0.162 0.009 <0.001 R
2=0.199, F=291.921, P<0.001. Excluded variable: age, sex, and body mass index.
0 175 150 125 100 75 50 25
18
Latee-GFRbyMDRDformularatio(%)
Time after donor nephrectomy (yr)
2 4 6 8 10 12 14 16
Age<35 Age>35
Fig. 3. Late compensation of residual renal function after donor nephrec-
tomy between two age groups (age <35, ≥35 years; P=0.136). e-GFR, estimated glomerular filtration rate; MDRD, Modification of Diet in Renal Disease.
0 175 150 125 100 75 50 25
18
Latee-GFRbyMDRDformularatio(%)
Time after donor nephrectomy (yr)
2 4 6 8 10 12 14 16
BMI <25 (kg/m )2 BMI >25 (kg/m )2
Fig. 4. Late compensation of residual renal function after donor nephrec-
tomy between two body mass index (BMI) groups (P=0.466). e-GFR, estimated glomerular filtration rate; MDRD, Modification of Diet in Renal Disease.
0 175 150 125 100 75 50 25
18
Latee-GFRbyMDRDformularatio(%)
Time after donor nephrectomy (yr)
2 4 6 8 10 12 14 16
Male Female
Fig. 5. Late compensation of residual renal function after donor nephrec-