Accepted: 2018.11.02 Published: 2019.02.08
2516 8 1 30
Association of Dietary Potassium Intake with the Development of Chronic Kidney Disease and Renal Function in Patients with Mildly Decreased Kidney Function: The Korean Multi- Rural Communities Cohort Study
ABCDEF 1 Kwang Ho Mun
C 1 Gyeong Im Yu
BG 2 Bo Youl Choi
B 2 Mi Kyung Kim
B 3 Min-Ho Shin
ADG 1 Dong Hoon Shin
Corresponding Author: Dong Hoon Shin, e-mail: [email protected] Source of support: Departmental sources
Background: Dietary potassium has negative outcomes in patients with mildly impaired kidney function, while having posi- tive outcomes in patients with hypertension. The association of dietary potassium intake with chronic kidney disease (CKD) development, with presence of hypertension, was studied in the Korean rural population with mildly impaired kidney function.
Material/Methods: From 3 rural areas of Korea, 5064 participants age ³40 with CKD stage 2 at baseline were recruited. Patients were classified according to the quartile of dietary potassium intake. Newly developed CKD, defined as esti- mated glomerular filtration rate (eGFR) of <60 mL/min/1.73 m2 at the time of follow-up, and eGFR decline, de- fined as eGFR decrease >15% at follow-up, were studied. The effect of dietary potassium on CKD development and eGFR decline were studied by Cox proportional hazard models. The association of potassium with blood pressures and C-reactive protein was also studied to examine the underlying mechanisms.
Results: Compared to 8.6% in normotensives, 15.7% of hypertensives developed CKD. The hazard ratio (HR) (95% con- fidence interval) of CKD was lower in high potassium diet only in hypertensives, with 0.60 (0.37-0.99) in the highest quartile. The eGFR decline was also lower in patients with higher potassium diet, with 0.70 (0.50–0.98) in Q3 and 0.54 (0.34–0.85) in Q4. Potassium intake has also been shown to decrease high diastolic blood pres- sure development (>90 mmHg) in hypertensives at 0.45 (0.25–0.83).
Conclusions: Dietary potassium was associated with lower risk of CKD development and eGFR decline, and this association was observed only in hypertensives.
MeSH Keywords: Cohort Studies • Kidney Failure, Chronic • Potassium, Dietary Full-text PDF: https://www.medscimonit.com/abstract/index/idArt/913504
Authors’ Contribution:
Study Design A Data Collection B Statistical Analysis C Data Interpretation D Manuscript Preparation E Literature Search F Funds Collection G
1 Department of Preventive Medicine, Keimyung University School of Medicine, Daegu, South Korea
2 Department of Preventive Medicine, Hanyang University College of Medicine, Seoul, South Korea
3 Department of Preventive Medicine, Chonnam National University Medical School, Gwangju, South Korea
Background
The causes of chronic kidney disease (CKD) include obesity, diabetes, and hypertension [1–3]. Moreover, CKD increases risk of stroke, myocardial infarction, and mortality in the el- derly [4]. In Korea, the prevalence of CKD is 8.2% according to Korean National Health and Nutrition Examination Survey (KNHANES), and 1572 patients undergo dialysis or renal trans- plantation per million population [5,6]. Therefore, early pre- vention and intervention of CKD development is critical to re- duce the disease burden.
Potassium plays a variety of important roles in human physi- ology. According to the 2007–2010 KNHANES study, the aver- age intake of potassium was 3081.9±16.8 mg per day, which is 74–83% of the recommended dietary intake [7]. A major role of dietary potassium intake is to decrease blood pressure in both hypertensive and normotensive individuals, and the ef- fect is greater among hypertensives [8,9]. Increased potassium intake also improves endothelial function as assessed by flow- mediated dilatation [10]. The positive effects of potassium in the general population have been shown, without adverse ef- fects on blood lipid and catecholamine levels, with lower risk of stroke, cardiovascular events, and mortality [11,12]. These results were consistent in hypertensive patients [13,14].
Compared to the general population, in CKD patients, as se- rum potassium level is balanced via excretion in functioning nephrons, hyperkalemia occurs [15]. As hyperkalemia is asso- ciated with increased mortality in CKD patients, restriction in dietary potassium is recommended in CKD patients [16,17].
Traditionally, stage 2 eGFR level is not considered CKD, as most epidemiologic studies use eGFR stage 3–5 to define CKD.
However, studies have shown an association between eGFR and poor clinical outcomes, even within normal levels. An eGFR drop of 10 mL/min/1.73 m2 was reported to increase odds of CVD and all-cause mortality, even in patients with eGFR 60 or higher [18]. Also, patients in stage 2, as well as stage 3, were associated with increased risk of CVD and mortality compared to patients with eGFR stage 1 [19]. These findings suggest the difference in the physiological effect of potassium between stage 2 vs. stage 1 patients.
This study, therefore, was conducted to examine the association of dietary potassium with CKD development in patients with mildly decreased kidney function, and to investigate whether the association differs according to hypertension status.
Material and Methods
Study Population
The study patients were drawn from the Multi-Rural Communities Cohort (MRCohort), a cohort established in 2004 as part of the Korean Genomic and Epidemiology Study. The cohort was designed to study the risk factors of CVD in the Korean population. The study populations were from 3 rural centers in South Korea: Goryeong, Yangpyeong, and Namwon.
Through multistage cluster sampling, villages were chosen and participants aged ³40 years were recruited.
A total of 9695 participants were recruited as of 2009.
Participants were then followed up every 2–4 years. By 2013, 7020 participants were followed up with data on eGFR.
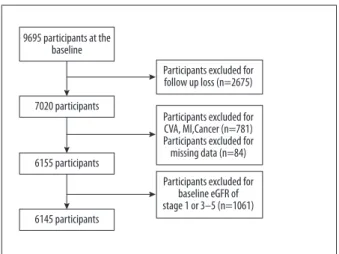
The study participants were selected as shown in Figure 1. Among the participants, 2675 without follow-up data were excluded, as were 781 participants with cancer, cerebrovascular disease, or myocardial infarction. We also excluded participants with implau- sible dietary intake data (<500 or >4000 kcal/day or >10 missing food items in the survey) those without data from self-report surveys, including smoking, alcohol consumption, and exercise.
Participants without laboratory data, such as serum creatinine, total cholesterol, triglyceride, or other confounding variables, such as body mass index (BMI) and blood pressure, were excluded.
Lastly, participants with baseline estimated glomerular filtration rate (eGFR) higher than 90 or lower than 60, corresponding to stage 1 and 3, were also excluded from the analysis. Thus, 5064 participants were studied in the final analysis. This study was con- ducted with the approval of the Ethics Committee of Keimyung University in Korea (IRB No. 40525-201807-HR-65).
9695 participants at the baseline
7020 participants
Participants excluded for follow up loss (n=2675)
Participants excluded for baseline eGFR of stage 1 or 3–5 (n=1061) Participants excluded for CVA, MI,Cancer (n=781) Participants excluded for missing data (n=84) 6155 participants
6145 participants
Figure 1. Flow chart of the study subjects. Missing data include creatinine, smoking, drinking, exercise, height, weight, and dietary factors. CKD – chronic kidney disease;
CVA – cerebrovascular disease; eGFR – estimated glomerular filtration rate; MI – myocardial infarction.
Data collection
Data were collected from 3 centers by standardized protocols for questionnaires and examination procedures. All of the in- terviewers and technicians were trained by the same per- sonnel from the coordinating center. The questionnaire in- cluded information on demographics and lifestyle (e.g., age, gender, smoking, drinking, and exercise). Medical history of diseases such as hypertension, diabetes, cerebrovascular dis- ease, myocardial infarction, and cancer were also collected by the questionnaire.
Anthropometric measurements were collected by a trained examiner. Height and weight were measured to the nearest 0.1 cm and 0.1 kg, with instruments zero-balanced before each measurement. BMI was calculated as weight divided by height squared. Blood pressure was measured at the right arm at heart level after 10 min of rest. Two consecutive measures
were taken with at least a 5-min interval between measure- ments, using a standard mercury sphygmomanometer. We de- termined the mean value of systolic (SBP) and diastolic blood pressure. HTN was defined as blood pressure of >140/90 mmHg or use of antihypertensives, or diagnosis of HTN, reported during the survey.
Laboratory test
Laboratory data were collected by blood samples from par- ticipants after a minimum of 8-h overnight fasting. All of the data were obtained on the same day, within 12 h of collec- tion. Triacylglycerol, total cholesterol, high-density lipoprotein (HDL), serum creatinine, C-reactive protein (CRP), and fasting glucose levels were obtained using an ADVIA 1650 Automated Analyzer (Siemens, New York, NY, USA).
Normotensive Hypertensive p
n 3066 1971
CKD onset n (%) 265 (8.6%) 310 (15.7%) <0.001
eGFR (mL/min/1.73 m2) 75.81±7.50 73.82±7.71 <0.001
Age (year) 59.9±9.2 62.7±8.5 <0.001
Men n (%) 1140 (37.2%) 749 (38.0%) NS
Follow-up period (months) 46.7±18.8 47.8±19.6 <0.05
Smoker n (%) 439 (14.3%) 220 (11.2%) <0.001
Alcohol n (%) 1319 (43.0%) 897 (45.5%) <0.01
Exercise n (%) 900 (29.4%) 638 (32.4%) <0.05
Diabetes n (%) 261 (8.5%) 281 (14.3%) <0.001
BMI (kg/m2) 23.9±3.0 25.1±3.1 <0.001
SBP (mmHg) 116.3±11.5 137.3±16.7 <0.001
DBP (mmHg) 75.2±7.7 85.1±10.4 <0.001
Tchl (mg/dL) 197.6±35.4 204.2±36.3 <0.001
TG (mg/dL) 139.7±85.2 169.7±108.6 <0.001
HDL (mg/dL) 45.0±10.4 43.9±10.3 <0.001
CRP (mg/L) 1.67±4.51 1.84±3.51 NS
Calorie (kcal/day) 1609.1±474.0 1580.3±455.6 <0.05
Protein (g/day) 48.5±19.2 47.5±19.1 NS
Potassium (mg/day) 1914.9±873.7 1889.7±918.4 NS
Sodium (mg/day) 2414.8±1347.7 2424.0±1408.8 NS
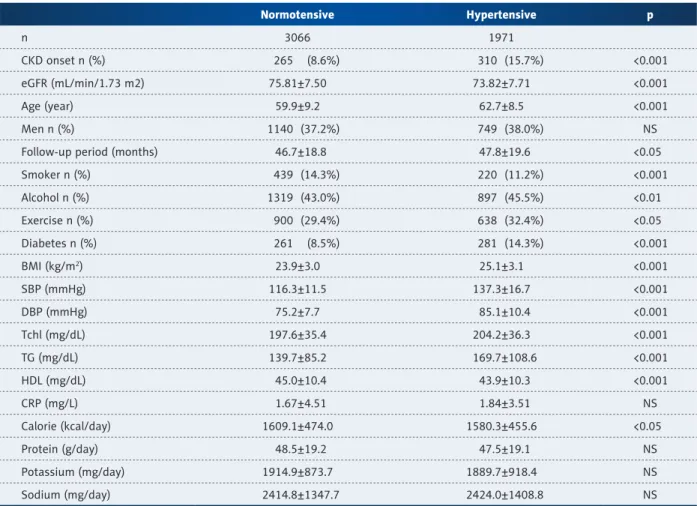
Table 1. Demographics of the participants by hypertension at the baseline.
BMI – body mass index; CKD – chronic kidney disease; CRP – c-reactive protein; DBP – diastolic blood pressure; eGFR – estimated glomerular filtration rate; HDL – high-density lipoprotein; HTN – hypertension; NS – not significant; SBP – systolic blood pressure;
Tchl – total cholesterol; Tg – triacylglycerol. Continuous variables are expressed as mean ± standard deviation and categorical variables are expressed as frequency and percentage.
Dietary assessment
Dietary intake data were obtained by use of the food frequency questionnaire (FFQ), containing 106 food items. The validity of the FFQ was evaluated previously [20]. For each food item, participants were asked to select their food consumption fre- quency by 9 categories (from “never or rarely” to 3 times/day) and usual size of intake by 3 categories. For seasonal food items, data on the duration of intake (3, 6, 9, and 12 months) was also obtained. Dietary nutrition intake, including dietary potassium intake, were obtained by calculating consumption of foods and dietary supplements.
Diagnostic definition
The CKD-Epi equation was used to obtain eGFR. The validity of the equation was studied and reported previously [21]. eGFR
<60 mL/min/1.73 m2, using age and serum creatinine at the follow-up, was used to define CKD development. Participants were followed up until CKD development or until the last fol- low-up was conducted.
SBP, DBP, and CRP increase were defined as an increase of each variable at the follow-up compared to baseline levels.
Q1 Q2 Q3 Q4
(<1301.940 p mg/day)
(1301.940–
1765.602 mg/day)
(1765.603–
2364.251 mg/day)
(>2364.251 mg/day)
n 767 766 766 767
CKD onset n (%) 98 (12.78%) 72 (9.40%) 54 (7.05%) 41 (5.35%) <0.001
eGFR (mL/min/1.73 m2) 74.76±7.48 75.93±7.66 76.05±7.34 76.49±7.43 <0.001
Age (year) 63.90±8.52 60.96±8.65 58.19±8.96 56.39±8.80 <0.001
Men n (%) 221 (28.81%) 268 (34.99%) 305 (39.82%) 346 (45.11%) <0.001
Follow-up period (months) 45.73±18.38 47.12±19.05 47.08±18.87 46.76±19.02 NS
Smoker n (%) 96 (12.52%) 100 (13.05%) 100 (13.05%) 143 (18.64%) <0.01
Alcohol n (%) 276 (35.98%) 320 (41.78%) 335 (43.73%) 388 (50.59%) <0.001
Exercise n (%) 147 (19.17%) 193 (25.20%) 241 (31.46%) 319 (41.59%) <0.001
Diabetes n (%) 64 (8.34%) 64 (8.36%) 76 (9.92%) 57 (7.43%) NS
BMI (kg/m2) 23.57±3.21 23.76±2.89 23.87±2.91 24.37±2.90 <0.001
SBP (mmHg) 116.74±11.83 116.29±11.42 116.29±11.50 115.73±11.26 NS
DBP (mmHg) 74.56±7.78 75.13±7.43 75.57±7.76 75.69±7.66 <0.05
Tchl (mg/dL) 198.56±36.78 199.17±35.71 195.98±34.74 196.52±34.39 NS
TG (mg/dL) 141.51±85.80 140.79±87.04 134.17±80.61 142.33±87.09 NS
HDL (mg/dL) 44.90±10.22 45.51±10.42 44.94±10.44 44.83±10.53 NS
CRP (mg/L) 1.82±4.81 1.52±3.04 1.68±4.43 1.67±5.42 NS
Calorie (kcal/day) 1229.94±306.63 1469.85±324.76 1704.84±346.44 2031.63±478.15 <0.001
Protein (g/day) 31.05±7.63 41.36±8.89 51.75±10.64 69.66±20.36 <0.001
Sodium (mg/day) 1340.93±626.33 2064.50±769.30 2521.61±945.42 3732.30±1538.58 <0.001 Table 2. Demographics of the normotensive participants by potassium quartile at the baseline.
BMI – body mass index; CKD – chronic kidney disease; CRP – c-reactive protein; DBP – diastolic blood pressure; eGFR – estimated glomerular filtration rate; HDL – high-density lipoprotein; HTN – hypertension; NS – not significant; SBP – systolic blood pressure;
Tchl – total cholesterol; Tg – triacylglycerol. Continuous variables are expressed as mean ± standard deviation and categorical variables were expressed as frequency and percentage.
Statistical analysis
Dietary potassium intake levels were categorized into 4 groups using quartile cut-off points. Participants were then assigned to a hypertensive group or a normotensive group based on presence of hypertension.
Variables are expressed as mean ± standard deviation (SD) for continuous variables, while frequency and percentage are used for categorical variables. One-way analysis of variance and chi-square test were used to compare the differences between groups. The outcome was defined as the develop- ment of CKD. The Cox proportional hazard model was used to assess hazard ratio (HR) and 95% confidence intervals (CI),
with the first quartile as the reference. In the crude model, no confounders were adjusted. In model 1, age, gender, BMI, smoking, and drinking were adjusted. In model 2, smoking, drinking, exercise, diabetes, total cholesterol, triacylglycerol, and HDL were further adjusted. Total calorie intake and pro- tein, categorized by recommended amount, were further ad- justed in model 3. Furthermore, the association of dietary po- tassium intake with SBP, DBP, and CRP increase, as well as follow-up SBP ³140 mmHg, DBP ³90 mmHg, and CRP ³3 mg/L, were studied to clarify the mechanism of CKD development. In all of the analyses, p <0.05 was considered statistically signif- icant. IBM SPSS Statistics 23.0 (IBM Corp., Armonk, NY, USA) was used for all statistical analyses.
Q1 Q2 Q3 Q4
(<1235.661 p mg/day)
(1235.661–
1711.273 mg/day)
(1711.274–
2322.677 mg/day)
(>2322.677 mg/day)
n 492 491 491 492
CKD onset n (%) 112 (22.72%) 79 (16.02%) 69 (14.02%) 50 (10.14%) <0.001
eGFR (mL/min/1.73 m2) 72.70±7.63 73.81±7.76 73.90±7.72 74.86±7.60 <0.001
Age (year) 66.08±7.97 63.42±7.84 62.30±8.25 59.16±8.38 <0.001
Men n(%) 144 (29.21%) 165 (33.47%) 214 (43.50%) 226 (45.84%) <0.001
Follow-up period (months) 46.08±19.66 48.17±19.71 49.02±19.66 47.93±19.19 NS
Smoker n (%) 58 (11.76%) 42 (8.52%) 63 (12.80%) 57 (11.56%) <0.01
Alcohol n (%) 189 (38.34%) 214 (43.41%) 231 (46.95%) 263 (53.35%) <0.001
Exercise n (%) 110 (22.31%) 150 (30.43%) 167 (33.94%) 211 (42.80%) <0.001
Diabetes n (%) 64 (12.98%) 64 (12.98%) 73 (14.84%) 80 (16.23%) NS
BMI (kg/m2) 24.67±3.16 25.21±3.12 25.16±2.87 25.36±3.24 <0.01
SBP (mmHg) 138.76±16.42 137.33±17.80 136.06±15.99 137.20±16.64 NS
DBP (mmHg) 84.21±11.00 84.19±10.22 84.87±10.13 87.06±10.13 <0.001
Tchl (mg/dL) 205.91±35.91 206.64±38.89 202.09±35.32 202.33±34.73 NS
TG (mg/dL) 167.49±96.31 177.59±125.78 166.23±113.06 167.47±96.56 NS
HDL (mg/dL) 43.14±8.90 44.38±10.67 43.81±10.85 44.42±10.57 NS
CRP (mg/L) 1.92±3.51 1.66±2.98 1.99±4.47 1.78±2.87 NS
Calorie (kcal/day) 1225.05±284.10 1447.35±298.77 1631.11±345.46 2017.74±451.35 <0.001
Protein (g/day) 30.62±7.02 40.32±7.81 49.28±10.11 69.68±20.19 <0.001
Sodium (mg/day) 1259.21±644.07 1958.29±759.80 2584.18±931.25 3897.52±1519.28 <0.001 Table 3. Demographics of the hypertensive participants by potassium quartile at baseline.
BMI – body mass index; CKD – chronic kidney disease; CRP – c-reactive protein; DBP – diastolic blood pressure; eGFR – estimated glomerular filtration rate; HDL – high-density lipoprotein; HTN – hypertension; NS – not significant; SBP – systolic blood pressure;
Tchl – total cholesterol; Tg – triacylglycerol. Continuous variables are expressed as mean ± standard deviation and categorical variables are expressed as frequency and percentage.
Results
Both hypertensive and normotensive subjects were divided into 4 groups according to the quartile of dietary potassium intake. The patients were followed up for average of 47.8±19.6 months in hypertensive patients and 46.7±18.8 months in nor- motensive patients. Table 1 presents differences in baseline characteristics between normotensives and hypertensives. CKD development was higher in hypertensives (15.7%) compared to normotensives (8.6%). Age, follow-up period, alcoholic in- take, exercise, diabetes, BMI, total cholesterol, and triacylglyc- erol levels were higher in hypertensives. Smoking, HDL, and dietary calorie intake were higher in normotensives. Tables 2 and 3 present baseline characteristics of each group. In hyper- tensive patients, age significantly decreased as dietary potas- sium intake increased, but BMI, calorie, protein, sodium, male gender, smoking, and drinking increased as dietary potassium intake increased, with the highest levels in Q1 (Table 2). In the normotensive group, age was younger in the higher dietary po- tassium intake groups. BMI, calorie and protein intake, male gender, smoking, and drinking increased in the high dietary intake groups (Table 3).
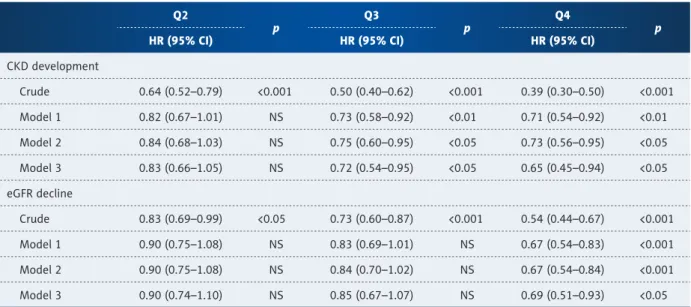
Table 4 shows the association of dietary potassium with CKD development and eGFR decline of 15% or more compared to the lowest quartile of potassium intake. The risk of CKD de- velopment decreased as dietary potassium increased in high levels (Q3 and Q4) with adjusted HR (95% confidence inter- val (CI)) of 0.72 (0.54–0.95) and 0.65 (0.45–0.94). eGFR decline
also was lower in the highest dietary potassium intake quartile (Q4), with adjusted HR (95% CI) of 0.69 (0.51–0.93).
Tables 5 and 6 show the association of dietary potassium with CKD development and eGFR decline of 15% or more compared to the lowest quartile of potassium intake. The risk of CKD de- velopment decreased in the highest dietary potassium intake group (Q4), with an adjusted HR (95% CI) of 0.60 (0.37–0.99).
The risk of eGFR decline also decreased as dietary potassium increased in all of the quartiles (Q2, Q3, Q4), with adjusted HR (95% CI) of 0.72 (0.53–0.97), 0.70 (0.50–0.98), and 0.54 (0.34–0.85), respectively, in hypertensives. However, the as- sociation was not significant in normotensives in any of the quartiles, including Q4, with adjusted HR (95% CI) of 0.82 (0.48–1.41) and 0.84 (0.56–1.25). There was heterogeneity of CKD development (p for heterogeneity <0.01) between nor- motensive and hypertensive subjects.
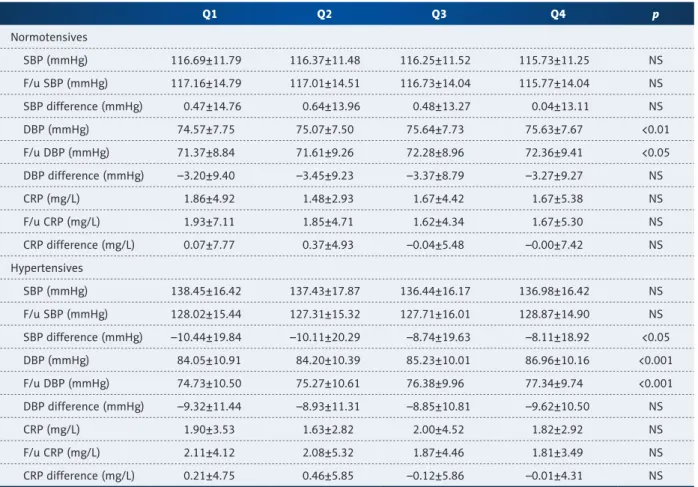
To clarify the mechanism of dietary potassium on CKD de- velopment and changes in CRP, systolic and diastolic blood pressure were studied and are shown in Tables 7 and 8. Table 7 presents mean and SD of CRP, systolic and diastolic blood pressure in baseline and follow-up, and differences between the follow-up and baseline values of each variable. In both groups, diastolic blood pressures at baseline and follow-up were higher among high dietary potassium intake groups, but the differences were not significantly different. In the hyper- tensive group, the change in systolic blood pressure was also lower among high dietary potassium intake groups.
Q2 p Q3
p Q4
HR (95% CI) HR (95% CI) HR (95% CI) p
CKD development
Crude 0.64 (0.52–0.79) <0.001 0.50 (0.40–0.62) <0.001 0.39 (0.30–0.50) <0.001 Model 1 0.82 (0.67–1.01) NS 0.73 (0.58–0.92) <0.01 0.71 (0.54–0.92) <0.01 Model 2 0.84 (0.68–1.03) NS 0.75 (0.60–0.95) <0.05 0.73 (0.56–0.95) <0.05 Model 3 0.83 (0.66–1.05) NS 0.72 (0.54–0.95) <0.05 0.65 (0.45–0.94) <0.05 eGFR decline
Crude 0.83 (0.69–0.99) <0.05 0.73 (0.60–0.87) <0.001 0.54 (0.44–0.67) <0.001
Model 1 0.90 (0.75–1.08) NS 0.83 (0.69–1.01) NS 0.67 (0.54–0.83) <0.001
Model 2 0.90 (0.75–1.08) NS 0.84 (0.70–1.02) NS 0.67 (0.54–0.84) <0.001
Model 3 0.90 (0.74–1.10) NS 0.85 (0.67–1.07) NS 0.69 (0.51–0.93) <0.05
Table 4. Hazard ratios for risk of chronic kidney disease and eGFR decline according to quartiles of potassium in whole participants.
CI – confidence interval; CKD – chronic kidney disease; eGFR – estimated glomerular filtration rate; HR – hazard ratio; NS – not significant. Model 1 – for age (by every 10 years), gender, BMI, smoking, alcohol and exercise; Model 2 – Model 1 + diabetes, total cholesterol, triglyceride, and high-density lipoprotein; Model 3 – Model 2 + calorie (by recommended amount) and protein intake (by recommended amount).
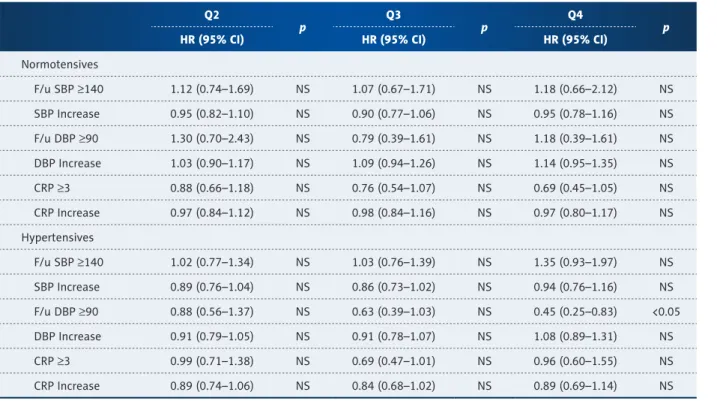
Table 8 shows the association of dietary potassium with in- crease of blood pressures and CRP. In normotensives, no associ- ation was observed. However, in hypertensives, DBP ³90 mmHg
at the follow-up decreased with high dietary potassium intake of adjusted HR (95% CI) of 0.45 (0.25–0.83).
Q2 p Q3
p Q4
HR (95% CI) HR (95% CI) HR (95% CI) p
CKD development
Crude 0.68 (0.50–0.92) <0.05 0.52 (0.37–0.72) <0.001 0.40 (0.27–0.57) <0.001
Model 1 0.88 (0.65–1.20) NS 0.79 (0.56–1.11) NS 0.69 (0.47–1.01) NS
Model 2 0.86 (0.63–1.16) NS 0.79 (0.56–1.12) NS 0.69 (0.47–1.01) NS
Model 3 0.93 (0.66–1.31) NS 0.84 (0.55–1.28) NS 0.82 (0.48–1.41) NS
eGFR decline
Crude 0.85 (0.65–1.11) NS 0.71 (0.53–0.94) <0.05 0.50 (0.36–0.69) <0.001
Model 1 0.97 (0.74–1.28) NS 0.90 (0.67–1.20) NS 0.67 (0.48–0.93) <0.05
Model 2 0.95 (0.72–1.25) NS 0.89 (0.66–1.19) NS 0.66 (0.47–0.92) <0.05
Model 3 1.05 (0.80–1.37) NS 0.94 (0.68–1.29) NS 0.84 (0.56–1.25) NS
Table 5. Hazard ratios for risk of chronic kidney disease and eGFR decline according to quartiles of potassium in normotensive participants.
CI – confidence interval; CKD – chronic kidney disease; eGFR – estimated glomerular filtration rate; HR – hazard ratio; NS – not significant. Model 1 – for age (by every 10 years), gender, BMI, smoking, alcohol and exercise; Model 2 – Model 1 + diabetes, total cholesterol, triglyceride and high-density lipoprotein; Model 3 – Model 2 + calorie, protein, and sodium intake (all of diet were adjusted by recommended amount).
Q2 p Q3
p Q4
HR (95% CI) HR (95% CI) HR (95% CI) p
CKD development
Crude 0.65 (0.49–0.86) <0.01 0.55 (0.40–0.74) <0.001 0.42 (0.30–0.59) <0.001 Model 1 0.77 (0.57–1.03) NS 0.69 (0.51–0.94) <0.05 0.64 (0.45–0.91) <0.05 Model 2 0.79 (0.59–1.05) NS 0.71 (0.52–0.96) <0.05 0.66 (0.46–0.93) <0.05 Model 3 0.78 (0.57–1.07) NS 0.69 (0.47–1.01) 0.053 0.60 (0.37–0.99) <0.05 eGFR decline
Crude 0.64 (0.48–0.86) <0.01 0.62 (0.47–0.83) <0.01 0.43 (0.31–0.61) <0.001 Model 1 0.70 (0.52–0.95) <0.05 0.71 (0.53–0.96) <0.05 0.56 (0.39–0.79) <0.01 Model 2 0.71 (0.52–0.95) <0.05 0.72 (0.53–0.97) <0.05 0.59 (0.40–0.80) <0.01 Model 3 0.72 (0.53–0.97) <0.05 0.70 (0.50–0.98) <0.05 0.54 (0.34–0.85) <0.01 Table 6. Hazard ratios for risk of chronic kidney disease and eGFR decline according to quartiles of potassium in hypertensive
participants.
CI – confidence interval; CKD – chronic kidney disease; eGFR – estimated glomerular filtration rate; HR – hazard ratio; NS – not significant. Model 1 – for age (by every 10 years), gender, body mass index, smoking, alcohol and exercise; Model 2 – Model 1 + diabetes, total cholesterol, triglyceride and high-density lipoprotein; Model 3 – Model 2 + calorie, protein, and sodium intake (all of diet were adjusted by recommended amount).
Discussion
This study was performed to assess the association of dietary potassium with CKD development in the Korean rural popula- tion. Our study has demonstrated that high dietary potassium intake of 2323 mg/day or more, compared to low intake of 1236 mg/day or lower, protected against CKD development in the hypertensive group, even after adjusting for nutritional factors. However, the association was insignificant in all quar- tiles of the normotensive group.
Decline in eGFR, even at normal levels, has been reported to be associated with poor clinical outcomes. It has been reported that every 10 mL/min/1.73 m2 decrease in eGFR was associ- ated with increased odds of CVD, recurrent CVD, and all-cause mortality, and the result was consistent in patients with eGFR higher than 60 [18]. A study by Ninomiya et al. demonstrated increased risk of CVD and mortality in patients with stage 2 and 3 [19]. The present study analyzed patients with stage 2eGFR because they are categorized as normal in most studies, but are relatively neglected despite the risk.
In the present study, the association of dietary potassium with CKD development was only significant in hypertensive patients and not in normotensive patients. This might result from the nature of hypertension. Hypertension is a traditional risk fac- tor of CKD and its clinical outcomes. Improved cardiovascular and renal outcomes have been reported as SBP increases in stage 3–4 CKD patients [22]. Furthermore, other indexes of blood pressure, including DBP, pulse pressure, and mean ar- terial pressure, were also related to increased end-stage re- nal disease in patients with low eGFR [23]. Furthermore, in patients with decreased glomerular filtration rate, strict as- signment of blood pressure has been shown to slow the pro- gression of kidney disease [24]. In the present study, the de- crease of systolic and diastolic blood pressure was greater in hypertensive patients with CKD development. Moreover, in hypertensives, the increase of diastolic blood pressure of 90 or higher decreased in the high dietary potassium group.
This might have affected the differences in CKD development between patients. However, other factors, including systolic blood pressure or CRP, have failed to show a relationship with
Q1 Q2 Q3 Q4 p
Normotensives
SBP (mmHg) 116.69±11.79 116.37±11.48 116.25±11.52 115.73±11.25 NS
F/u SBP (mmHg) 117.16±14.79 117.01±14.51 116.73±14.04 115.77±14.04 NS
SBP difference (mmHg) 0.47±14.76 0.64±13.96 0.48±13.27 0.04±13.11 NS
DBP (mmHg) 74.57±7.75 75.07±7.50 75.64±7.73 75.63±7.67 <0.01
F/u DBP (mmHg) 71.37±8.84 71.61±9.26 72.28±8.96 72.36±9.41 <0.05
DBP difference (mmHg) –3.20±9.40 –3.45±9.23 –3.37±8.79 –3.27±9.27 NS
CRP (mg/L) 1.86±4.92 1.48±2.93 1.67±4.42 1.67±5.38 NS
F/u CRP (mg/L) 1.93±7.11 1.85±4.71 1.62±4.34 1.67±5.30 NS
CRP difference (mg/L) 0.07±7.77 0.37±4.93 –0.04±5.48 –0.00±7.42 NS
Hypertensives
SBP (mmHg) 138.45±16.42 137.43±17.87 136.44±16.17 136.98±16.42 NS
F/u SBP (mmHg) 128.02±15.44 127.31±15.32 127.71±16.01 128.87±14.90 NS
SBP difference (mmHg) –10.44±19.84 –10.11±20.29 –8.74±19.63 –8.11±18.92 <0.05
DBP (mmHg) 84.05±10.91 84.20±10.39 85.23±10.01 86.96±10.16 <0.001
F/u DBP (mmHg) 74.73±10.50 75.27±10.61 76.38±9.96 77.34±9.74 <0.001
DBP difference (mmHg) –9.32±11.44 –8.93±11.31 –8.85±10.81 –9.62±10.50 NS
CRP (mg/L) 1.90±3.53 1.63±2.82 2.00±4.52 1.82±2.92 NS
F/u CRP (mg/L) 2.11±4.12 2.08±5.32 1.87±4.46 1.81±3.49 NS
CRP difference (mg/L) 0.21±4.75 0.46±5.85 –0.12±5.86 –0.01±4.31 NS
Table 7. Comparison of blood pressure and CRP from baseline to the follow-up by potassium quartiles.
CRP – c-reactive protein; DBP – diastolic blood pressure; NS – not significant; SBP – systolic blood pressure. Variables are expressed as mean ± standard deviation.
Q2 p Q3
p Q4
HR (95% CI) HR (95% CI) HR (95% CI) p
Normotensives
F/u SBP ³140 1.12 (0.74–1.69) NS 1.07 (0.67–1.71) NS 1.18 (0.66–2.12) NS
SBP Increase 0.95 (0.82–1.10) NS 0.90 (0.77–1.06) NS 0.95 (0.78–1.16) NS
F/u DBP ³90 1.30 (0.70–2.43) NS 0.79 (0.39–1.61) NS 1.18 (0.39–1.61) NS
DBP Increase 1.03 (0.90–1.17) NS 1.09 (0.94–1.26) NS 1.14 (0.95–1.35) NS
CRP ³3 0.88 (0.66–1.18) NS 0.76 (0.54–1.07) NS 0.69 (0.45–1.05) NS
CRP Increase 0.97 (0.84–1.12) NS 0.98 (0.84–1.16) NS 0.97 (0.80–1.17) NS
Hypertensives
F/u SBP ³140 1.02 (0.77–1.34) NS 1.03 (0.76–1.39) NS 1.35 (0.93–1.97) NS
SBP Increase 0.89 (0.76–1.04) NS 0.86 (0.73–1.02) NS 0.94 (0.76–1.16) NS
F/u DBP ³90 0.88 (0.56–1.37) NS 0.63 (0.39–1.03) NS 0.45 (0.25–0.83) <0.05
DBP Increase 0.91 (0.79–1.05) NS 0.91 (0.78–1.07) NS 1.08 (0.89–1.31) NS
CRP ³3 0.99 (0.71–1.38) NS 0.69 (0.47–1.01) NS 0.96 (0.60–1.55) NS
CRP Increase 0.89 (0.74–1.06) NS 0.84 (0.68–1.02) NS 0.89 (0.69–1.14) NS
Table 8. Hazard ratios for risk of increase in blood pressures and CRP according to quartiles of potassium.
CI – confidence interval; CRP – c-reactive protein; DBP – diastolic blood pressure; HR – hazard ratio; NS – not significant; SBP – systolic blood pressure. All models were adjusted for age (by every 10 years), gender, body mass index, smoking, alcohol, exercise, diabetes, total cholesterol, triglyceride, high-density lipoprotein calorie (by recommended amount), and protein intake (by recommended amount).
potassium intake. Therefore, further studies are needed to as- sess the effect of dietary potassium.
The underlying mechanisms causing potassium’s association with low CKD development have not been clarified. However, studies have shown that a high potassium diet contributes to the incidence of stroke and cerebrovascular disease [8]. Several studies have also shown dietary potassium to decrease blood pressure [25–27]. In a meta-analysis, dietary potassium intake decreased systolic blood pressure of 3.5 mmHg in hyperten- sive patients, compared to 0.97 mmHg in normotensive pa- tients [9]. Furthermore, potassium supplementation improved flow-mediated dilatation, a biomarker of endothelial func- tion [28], and decreased levels of the inflammatory marker IL-8, but failed to show the effect of potassium in sensitivity anal- ysis. Moreover, potassium has been reported to play a role in renal inflammation via Smad7 expression [29]. In the present study, dietary potassium levels were associated with reduced DBP increase to hypertensive levels. This might have resulted in the low CKD development in the present study, but we have failed to show an association between dietary potassium and SBP or CRP changes. Thus, the possible mechanisms by which potassium affects CKD development are diverse, and further studies are needed to clarify the effects of each mechanism.
There are some limitations to the present study. In defining CKD, albuminuria was not considered because the results were not available in the cohort. Regardless, eGFR of <60 mL/min/1.73 m2 is widely accepted as defining CKD in epidemiologic studies [30].
Also, patients with stage 1 of eGFR were not analyzed in the present study, as few patients developed CKD, challenging the analysis of the population. This might be caused by the relatively short follow-up period of 47 months. Therefore, fur- ther follow-up is needed to compare the long-term effect be- tween patients in stage 1 and stage 2. Lastly, we calculated dietary potassium levels by using food intake results from the FFQ. However, as FFQ obtains food consumption data over a relatively long period, recall bias might occur. Further studies should be conducted to gain more accurate dietary information.
Conclusions
In this study, high intake of potassium was found to protect against CKD development in hypertensive patients with mildly decreased kidney function. Further studies should be performed to compare the effect of dietary potassium in stage 1 and 2 hypertensive patients.
Acknowledgments
Data in this study were from the Korean Genome and Epidemiology Study (KoGES; 4851-302), National Research
References:
1. Norris KC, Greene T, Kopple J et al: Baseline predictors of renal disease pro- gression in the African American Study of Hypertension and Kidney Disease.
J Am Soc Nephrol, 2006; 17(10): 2928–36
2. Hsu CY, McCulloch CE, Iribarren C et al: Body mass index and risk for end- stage renal disease. Ann Intern Med, 2006; 144(1): 21–28
3. Webster AC, Nagler EV, Morton RL, Masson P: Chronic kidney disease. Lancet, 2017; 389(10075): 1238–52
4. Hemmelgarn BR, Manns BJ, Lloyd A et al: Relation between kidney func- tion, proteinuria, and adverse outcomes. JAMA, 2010; 303(5): 423–29 5. Jin DC, Han JS: Renal replacement therapy in Korea, 2012. Kidney Res Clin
Pract, 2014; 33(1): 9–18
6. Park JI, Baek H, Jung HH: Prevalence of chronic kidney disease in Korea: The Korean National Health and Nutritional Examination Survey 2011–2013. J Korean Med Sci, 2016; 31(6): 915–23
7. Lee SY, Lee SY, Ko YE, Ly SY: Potassium intake of Korean adults: Based on 2007~2010 Korea National Health and Nutrition Examination Survey. J Nutr Health, 2017; 50(1): 98–110
8. Houston MC: The importance of potassium in managing hypertension. Curr Hypertens Rep, 2011; 13(4): 309–17
9. Geleijnse JM, Kok FJ, Grobbee DE: Blood pressure response to changes in sodium and potassium intake: A meta regression analysis of randomized trials. J Hum Hypertens, 2003; 17(7): 471–80
10. Blanch N, Clifton PM, Petersen KS et al: Effect of high potassium diet on endothelial function. Nutr Metab Cardiovasc Dis, 2014; 24(9): 983–89 11. Aburto NJ, Hanson S, Gutierrez H et al: Effect of increased potassium in-
take on cardiovascular risk factors and disease: Systematic review and me- ta-analyses. BMJ, 2013; 346: f1378
12. Geleijnse JM, Witteman JCM, Stijnen T et al: Sodium and potassium intake and risk of cardiovascular events and all-cause mortality: The Rotterdam Study. Eur J Epidemiol, 2007; 22(11): 763–70
13. He FJ, Marciniak M, Carney C et al: Effects of potassium chloride and potas- sium bicarbonate on endothelial function, cardiovascular risk factors, and bone turnover in mild hypertensives. Hypertension, 2010; 55(3): 681–88 14. Fang J, Madhavan S, Alderman MH: Dietary potassium intake and stroke
mortality. Stroke, 2000; 31(7): 1532–37
15. Gennari FJ, Segal AS: Hyperkalemia: An adaptive response in chronic renal insufficiency. Kidney Int, 2002; 62(1): 1–9
16. Einhorn LM, Zhan M, Hsu VD et al: The frequency of hyperkalemia and its significance in chronic kidney disease. Arch Intern Med, 2009; 169(12):
1156–62
17. Cupisti A, Kovesdy CP, D’Alessandro C, Kalantar-Zadeh K: Dietary approach to recurrent or chronic hyperkalaemia in patients with decreased kidney function. Nutrients, 2018; 10(3): 261–76
18. Manjunath G, Tighiouart H, Coresh J et al: Level of kidney function as a risk factor for cardiovascular outcomes in the elderly. Kidney Int, 2003; 63(3):
1121–29
19. Ninomiya T, Kiyohara Y, Tokuda Y et al: Impact of kidney disease and blood pressure on the development of cardiovascular disease: An overview from the Japan Arteriosclerosis Longitudinal Study. Circulation, 2008; 118(25):
2694–701
20. Ahn Y, Kwon E, Shim JE et al: Validation and reproducibility of food fre- quency questionnaire for Korean genome epidemiologic study. Eur J Clin Nutr, 2007; 61(12): 1435–41
21. Levey AS, Stevens LA, Schmid CH et al: A new equation to estimate glo- merular filtration rate. Ann Intern Med, 2009; 150(9): 604–12
22. Chiang HP, Lee JJ, Chiu YW et al: Systolic blood pressure and outcomes in stage 3–4 chronic kidney disease patients: Evidence from a Taiwanese co- hort. Am J Hypertens, 2014; 27(11): 1396–407
23. Bell EK, Gao L, Judd S et al: Blood pressure indexes and end-stage renal disease risk in adults with chronic kidney disease. Am J Hypertens, 2012;
25(7): 789–96
24. Sarnak MJ, Greene T, Wang X et al: The effect of a lower target blood pres- sure on the progression of kidney disease: Long-term follow-up of the modification of diet in renal disease study. Ann Intern Med, 2005; 142(5):
342–51
25. Lambers Heerspink HJ, Holtkamp FA, Parving HH et al: Moderation of di- etary sodium potentiates the renal and cardiovascular protective effects of angiotensin receptor blockers. Kidney Int, 2012; 82(3): 330–37 26. Thomas MC, Moran J, Forsblom C et al: The association between dietary
sodium intake, ESRD, and all-cause mortality in patients with type 1 dia- betes. Diabetes Care, 2011; 34(4): 861–66
27. Cook NR, Obarzanek E, Cutler JA et al: Joint effects of sodium and potassi- um intake on subsequent cardiovascular disease: The Trials of Hypertension Prevention follow-up study. Arch Intern Med, 2009; 169(1): 32–40 28. Gijsbers L, Dower JI, Schalkwijk CG et al: Effects of sodium and potassium
supplementation on endothelial function: A fully controlled dietary inter- vention study. Br J Nutr, 2015; 114(9): 1419–26
29. Wang W, Soltero L, Zhang P et al: Renal inflammation is modulated by po- tassium in chronic kidney disease: possible role of Smad7. Am J Physiol Renal Physiol, 2007; 293(4): F1123–30
30. Bash LD, Coresh J, Köttgen A et al: Defining incident chronic kidney dis- ease in the research setting: The ARIC Study. Am J Epidemiol, 2009; 170(4):
414–24
Institute of Health, Centers for Disease Control and Prevention, Ministry for Health and Welfare, Republic of Korea.