he renal dysfunction has been reported as an inde- pendent risk factor which has shown worse clinical outcomes after acute myocardial infarction (MI).1–3 Previous studies, which have focused on patients with severe and end-stage renal disease, showed that high inci-
dence of mortality and adverse events is observed in those patients who developed acute MI.4,5This particularly poor outcome has been explained by facts such as specific patho- physiologic condition, high prevalence of comorbidity and underuse of life-saving treatments, so called ‘therapeutic nihilism’.6However, the relationship between clinical out- comes and the utilization of standard therapies after acute MI and renal function is not clear yet in patients with nor- mal or mildly elevated serum creatinine concentrations, be- cause those patients have not been highlighted in studies of this area. In fact, serum creatinine concentration has been known as an insensitive indicator of renal function.1Despite a relatively normal range of serum creatinine concentration, some patients might have renal dysfunction or impairment, when renal function is defined by estimated glomerular fil- tration rate (GFR). Furthermore, any degree of renal dys- function, as well as end-stage renal disease, might be an indicator of early pathologic changes of vascular wall such as atherosclerosis, and could be associated with poor prog- nosis after acute MI.7,8
Consequently, as part of the Korean Acute Myocardial Infarction Registry (KAMIR) study, the present study aimed to investigate the prognostic impact of renal function
(Received January 29, 2008; revised manuscript received March 31, 2008; accepted April 24, 2008)
1Division of Cardiology, Yeungnam University Hospital, 2Division of Cardiology, Keimyung University Dongsan Hospital, Daegu, 3Divi- sion of Cardiology, Kyunghee University Hospital, Seoul, 4Division of Cardiology, Chungbuk National University Hospital, Chungju, 5Divi- sion of Cardiology, Kyungpook National University Hospital, Daegu,
6Division of Cardiology, Chonnam National University Hospital, Gwangju, 7Division of Cardiology, Pusan University Hospital, 8Divi- sion of Cardiology, Inje University Baek Hospital, Pusan, 9Division of Cardiology, Daegu Catholic University Hospital, Daegu, Republic of Korea
10Korea Acute Myocardial Infarction Registry (KAMIR) Study Group of Korean Circulation Society members are listed in Appendix 1.
Mailing address: Young-Jo Kim, MD, Division of Cardiology, Yeungnam University Hospital, 5 Daemyoung Dong, Nam-Gu, Daegu 705-717, Republic of Korea. E-mail: [email protected] All rights are reserved to the Japanese Circulation Society. For per- missions, please e-mail: [email protected]
Clinical Outcomes and Therapeutic Strategy in Patients With Acute Myocardial Infarction According
to Renal Function
Data From the Korean Acute Myocardial Infarction Registry
Sang-Hee Lee, MD1; Young-Jo Kim, MD1; Woong Kim, MD1; Jong-Seon Park, MD1; Dong-Gu Shin, MD1; Seung-Ho Hur, MD2; Chong-Jin Kim, MD3; Myeong-Chan Cho, MD4;
Shung-Chull Chae, MD5; Myung-Ho Jeong, MD6; Taek-Jong Hong, MD7; Doo-Il Kim, MD8; Kee-Sik Kim, MD9and other
Korean Acute Myocardial Infarction Registry Investigators10
Background The aim of the present study was to evaluate the relationship between clinical outcomes after acute myocardial infarction (MI) and renal function by glomerular filtration rate (GFR) in patients with normal or mildly elevated serum creatinine concentrations.
Methods and Results As part of the Korean Acute Myocardial Infarction Registry (KAMIR), 6,834 acute MI patients with a serum creatinine concentration of ≤2.0 mg/dl were enrolled from November 2005 to December 2006. The renal function was stratified arbitrary to 5 groups: (1) normal function, >90.0; (2) preserved function, 75.0–89.9; (3) mild dysfunction, 60.0–74.9; (4) moderate dysfunction, 45.0–59.9; (5) severe dysfunction,
<45 ml· min–1· 1.73 m–2. Clinical characteristics, mortality and adverse events were analyzed among each group.
Although reperfusion and medical therapies were underused, the rates of mortality and adverse events were increased with declining renal function. After adjustment with confounders, severe and moderate renal dysfunc- tions were important risk predictors of in-hospital mortality, long-term mortality and adverse events.
Conclusion The spectrum of renal function, when it was presented by GFR, is broad and is an important risk predictor for adverse outcomes after acute MI, even in patients with normal or mildly elevated serum creatinine concentrations. Furthermore, standard treatments were underused in any degree of renal dysfunction. (Circ J 2008; 72: 1410 – 1418)
Key Words: Glomerular filtration rate; Mortality; Myocardial infarction
T
by estimated GFR, and test the effects of evidence-based therapies in unselected large populations with normal or mildly elevated serum creatinine concentration who devel- oped acute MI, to coincide with real practice.
Methods
Patients and Baseline Characteristics
The KAMIR study is a retrospective multi-hospital study and collected data from 10,463 patients with acute MI be- tween November 2005 and December 2006. The purpose and methods used to register patients of the KAMIR study have been described previously.9
We abstracted 7,411 data that were available to calculate the estimated GFR. Of these patients, we analyzed data of 6,834 eligible patients who were 20 years or older (mean age: 64.1±12.9 years, male: n=5,209). These patients were newly diagnosed with acute MI at 41 primary percutaneous coronary intervention (PCI) facilities and admitted to hos- pital within 7 days after symptom onset. On the basis of the cut-off value of serum creatinine which was used in the Third National Health and Nutrition Examination Survey (NHANES III),10patients with a baseline serum creatinine concentration of more than 2.0 mg/dl, as the index of mod- erate and severe renal impairment, were excluded. We also excluded patients with a history of previous renal diseases and overt renal failure (defined as renal replacement therapy or GFR of less than 15 ml per min per 1.73 m2of body sur- face area). The clinical data after discharge were obtained from outpatient visits and contacted by telephone at 30, 90 and 180 days.
Definition
Acute MI was defined by World Health Organization cri- teria incorporating clinical features, elevated biochemistry marker and electrocardiographic findings.11 ST elevation MI (STEMI) was indicated by new ST elevation in at least 2 contiguous leads, measuring more than 0.2 mV in leads V1–3, or 0.1 mV in all other leads. When these findings were compounded, the diagnosis was supported by coronary angiographic (CAG) findings. Killip class was defined at admission. Left ventricular ejection fraction (LVEF) was shown by echocardiography.
GFR Measurement
Renal function was defined by estimated GFR. Of several reliable equations, we used the Mayo clinic quadratic equa- tion (MCQ) because of the following reasons: (1) Cockcroft and Gault formula usually overestimates GFR, especially in low range; and (2) the modification of diet in renal disease equation underestimates high GFR in diabetics.12MCQ in- corporated age, sex and serum creatinine concentration.
MCQ = exp [1.911+5.249/SCr –2.114/SCr2–0.00686× age (years) –0.205 if female].
According to the cut-off value which was used in the Candesartan in heart failure: Assessment of Reduction in Mortality and Morbidity (CHARM) trial,13 we stratified a study population into 5 groups as follows: normal renal func- tion, >90.0; preserved renal function, 75.0–89.9; mild renal dysfunction, 60.0–74.9; moderate renal dysfunction, 45.0–
59.9; severe renal dysfunction, <45 ml · min–1· 1.73 m–2. Serum creatinine concentration used in this equation was an initial value after presentation and had a normal range from 0.6–1.5 mg/dl.
Treatment
PCI and coronary artery bypass graft (CABG) surgery were used for reperfusion therapy. As primary reperfusion therapy in STEMI patients, intravenous thrombolytic thera- py, primary and facilitated PCI were performed. Early invasive PCI was defined as emergent PCI, which was per- formed in non-STEMI (NSTEMI) patients with remained symptoms. Treatment strategies were decided by operators, according to the American College of Cardiology and the American Heart Association guidelines for the management of patients with acute coronary syndrome. Furthermore, evidence-based medications were prescribed in a non-ran- domized unselected condition.
Clinical Outcomes
The primary endpoint was death from any cause. Other major adverse cardiac events such as cardiac death, recurrent MI, repeated coronary revascularization and CABG were defined as secondary endpoints. Cardiac death included sudden death within 1 month after MI onset as well as a known mechanical or arrhythmic cause.
Statistical Analysis
The estimated GFR is presented in categorical value which was suited for our purposes. For continuous varia- bles, comparison among each group was performed by one- way ANOVA and the Kruskal – Wallis test, when appropri- ate. Pearson’s chi-square test was used for the analysis of categorical variables. All p-values were two-sided, and a p-value of less than 0.05 was considered to indicate statisti- cal significance. Univariate and multivariate analyses were performed to determine the prognostic significance of clini- cal variables for in-hospital and long-term clinical endpoint.
Variables with p-values of <0.25 on univariate analysis were entered into multivariate logistic regression models and Cox proportional-hazards models. Multivariate logistic regression modeling was used to compare in-hospital out- comes and candidates for adjustment included age, sex, comorbidities (previous MI, previous PCI, diabetes, hyper- tension, elevated lipid concentrations, current smoking, previous stroke, previous heart failure, chronic lung disease),
‘symptom to door time’, Killip class >I, primary ventricular tachyarrhythmia, LVEF <40%, therapeutic modalities and medical treatments during hospitalization, angiographic findings, PCI-related complications, and spectrum of renal function. Cox proportional-hazards modeling was used to compare long-term clinical outcomes. The following varia- bles were included in adjustment: age, sex, comorbidities (previous MI, previous PCI, diabetes, hypertension, elevated lipid concentraitons, current smoking, previous stroke, pre- vious heart failure, peripheral vascular disease, malignan- cy), pre-hospital resuscitation, ‘symptom to door time’, symptoms and sign at presentation, Killip class >I, atrial fibrillation, primary ventricular tachyarrhythmia, LVEF
<40%, therapeutic modalities, medical treatments during hospitalization and at discharge, angiographic findings, PCI-related complications, and spectrum of renal function.
We used stepwise elimination and backward selections to select the most powerful predictive variables in both models.
Life table estimates, by 5 groups according to the estimated GFR, for long-term mortality and adverse events were determined and presented as event curves. Analyses were performed with the use of SPSS software (version 13.0, SPSS Inc, Chicago, IL, USA).
Results
The median value of estimated GFR and serum creatinine of 6,834 patients were 90.3 ml·min–1·1.73 m–2(interquartile range: 74.4–106.4) and 1.0 mg/dl (interquartile range: 0.9–
1.2), respectively. Although we enrolled acute MI patients with serum creatinine concentration ≤2.0 mg/dl as an object of study and mild elevation of serum creatinine concentra- tion was observed in just 435 (6.4%) patients, 863 (12.6%) patients had estimated GFR of less than 60 ml · min–1· 1.73 m–2.
Baseline Characteristics
Baseline demography and clinical characteristics of pa- tients are shown in Table 1 by spectrum of renal function.
Old age and female sex were more frequently observed in patients with renal dysfunction. Except current smoker and elevated lipid concentration, a prevalence of cardiovascular comorbidities, such as hypertension, diabetes, and heart failure increased with declining renal function. Patients with renal dysfunction were delayed remarkably in ‘onset to door time’ and more likely to present with heart failure (Killip
class >I). These patients had a higher incidence of pre-hos- pital resuscitation, lower blood pressure, dyspnea, left ven- tricular (LV) systolic dysfunction, and arrhythmia than patients with preserved renal function. The rates of STEMI and typical chest pain were significantly higher in the patients with preserved renal function.
Reperfusion Therapy and Adjunctive Medical Therapy PCI and CABG during the index hospitalization were performed in 83.3% and 3.3% of total study population, respectively. PCI was used less frequently in patients with moderate and severe renal dysfunction, whereas the use of CABG showed no significant difference among each group (Table 2). We specified acute MI to STEMI and NSTEMI to show an association between primary reperfusion strategies and renal function (Table 2). The use of thrombolytic thera- py was significantly lower in patients with moderate and severe renal dysfunction. However, an incidence of primary and facilitated PCI in STEMI was similar across the spec- trum of renal function. Patients with preserved renal func- tion who developed NSTEMI were treated more frequently with early invasive PCI. After adjustment for baseline char-
Normal renal Preserved renal Mild renal Moderate renal Severe renal p value
function function dysfunction dysfunction dysfunction
Patients, n 3,441 1,649 881 520 343
Age, years¶ 58±11 68±11 71±10 72±11 75±9 <0.001
Male sex, n (%) 3,192 (92.8) 967 (58.6) 548 (62.2) 328 (63.1) 174 (50.7) <0.001 Comorbidities
Hypertension, n (%) 1,288 (37.4) 839 (50.9) 505 (57.3) 320 (61.5) 240 (70.0) <0.001 Diabetes, n (%) 751 (21.8) 405 (24.6) 263 (29.9) 203 (39.0) 149 (43.4) <0.001 Current smoker, n (%) 2,058 (59.8) 570 (34.6) 270 (30.6) 155 (29.8) 73 (21.3) <0.001 Elevated lipid concentrations§, n (%) 2,418 (70.3) 1,108 (67.2) 547 (62.1) 274 (53.0) 174 (50.7) <0.001 Previous MI, n (%) 113 (3.3) 74 (4.5) 47 (5.3) 28 (5.4) 21 (6.1) <0.001 Previous PCI, n (%) 163 (4.7) 101 (6.1) 50 (5.7) 35 (6.7) 26 (7.6) <0.001 Previous CABG, n (%) 21 (0.6) 16 (1.0) 4 (0.5) 4 (0.8) 6 (1.7) <0.001 Previous heart failure, n (%) 22 (0.6) 29 (1.8) 35 (4.0) 31 (6.0) 30 (8.7) <0.001 Previous stroke, n (%) 150 (4.4) 123 (7.5) 81 (9.2) 58 (11.2) 54 (15.7) <0.001 Initial presentation
ST elevated MI, n (%) 2,213 (64.7) 1,031 (62.9) 552 (63.3) 305 (59.2) 196 (57.6) 0.021 Non-ST elevated MI, n (%) 1,205 (35.3) 609 (37.1) 320 (36.7) 210 (40.8) 144 (42.4) 0.021
Symptom to door time, min¶ 713±1,346 707±1,261 761±1,435 757±1,230 1,062±1,614 <0.001
Pre-hospital resuscitation, n (%) 46 (1.3) 45 (2.7) 28 (3.2) 23 (4.4) 21 (6.1) <0.001
Systolic BP, mmHg¶ 130±30 127±29 124±42 121±34 119±34 <0.001
Diastolic BP, mmHg¶ 80±22 77±17 75±36 73±19 74±54 <0.001
Preinfarct angina, n (%) 1,373 (40.5) 710 (43.8) 359 (41.7) 204 (40.0) 144 (42.9) 0.224 Typical chest pain, n (%) 3,043 (88.8) 1,397 (85.4) 712 (81.7) 389 (75.2) 238 (70.0) <0.001 Dyspnea, n (%) 732 (21.4) 448 (27.4) 325 (37.4) 218 (42.2) 167 (49.3) <0.001 Killip class >I, n (%) 607 (18.4) 441 (27.9) 288 (34.4) 198 (40.4) 189 (58.3) <0.001 Q wave infarction, n (%) 576 (16.6) 236 (14.3) 131 (14.9) 79 (15.2) 62 (18.1) 0.133 Atrial fibrillation, n (%) 87 (2.5) 81 (4.9) 53 (6.0) 34 (6.5) 28 (8.2) <0.001 Primary VT/VF, n (%) 20 (0.6) 20 (1.2) 9 (1.0) 10 (1.9) 6 (1.7) 0.008 Laboratory findings
LVEF <40%, n (%) 372 (12.0) 212 (14.5) 176 (22.8) 127 (28.7) 90 (31.5) <0.001 eGFR, ml · min–1· 1.73m–2‡ 106.4 (98.1–115.7) 83.3 (79.7–86.6) 68.4 (65.0–72.1) 53.3 (49.0–56.8) 37.7 (34.0–41.3) <0.001 Creatinine, mg/dl‡ 0.9 (0.9–1.0) 1.1 (0.9–1.2) 1.2 (1.1–1.3) 1.4 (1.3–1.6) 1.8 (1.6–1.9) <0.001 Troponin I, ng/ml‡ 22.8 (5.0–52.2) 18.18 (3.2–50.0) 16.5 (2.5–50.0) 21.7 (3.7–50.0) 14.0 (4.2–44.3) <0.001 CK-MB, ng/ml‡ 94.8 (26.0–232.0) 78.7 (19.0–219.5) 65.8 (16.5–193.3) 47.0 (15.0–175.0) 43.3 (11.0–158.9) <0.001 Total cholesterol, mg/dl‡ 183.0 (157.0–211.0) 181.0 (155.0–209.0) 177.0 (149.0–209.0) 169.0 (141.0–205.0) 167.0 (138.3–201.5) <0.001 Triglyceride, mg/dl‡ 109.0 (72.0–163.0) 101.0 (69.0–146.0) 103.0 (70.0–149.0) 101.0 (71.0–145.0) 96.0 (72.0–138.0) <0.001 HDL-cholesterol, mg/dl‡ 43.0 (37.0–51.0) 44.0 (37.0–52.0) 42.0 (35.0–50.0) 42.0 (35.3–51.0) 41.0 (34.0–49.0) <0.001 LDL-cholesterol, mg/dl‡ 116.0 (94.0–142.0) 115.0 (92.0–140.0) 110.0 (87.0–136.0) 108.0 (84.0–140.0) 104.0 (80.0–134.0) <0.001 Table 1 Baseline Characteristics According to the eGFR
eGFR, estimated glomerular filtration rate; MI, myocardial infarction; PCI, percutaneous coronary intervention; CABG, coronary artery bypass grafting; BP, blood pressure; VT/VF, ventricular tachycardia/ventricular fibrillation; LVEF, left ventricular ejection fraction; CK, creatine kinase; HDL, high-density lipoprotein; LDL, low-density lipoprotein.
¶Data are presented as the means±standard deviation.
‡Data are presented as the median with 25–75 percentiles.
§Defined as total cholesterol level >240 mg/dl or LDL-cholesterol >100 mg/dl.
acteristics, renal function was not presented as a determi- nant of primary reperfusion strategy in STEMI and early invasive therapy in NSTEMI (Table 3).
Adjunctive medical therapy was recorded and analyzed (Table 2). Standard medications such as antiplatelet agents, β-blocker, statin, unfractionated heparin and angiotensin- converting enzyme (ACE) inhibitor/angiotensin-receptor blocker (ARB) during the index hospitalization were used less frequently in patients with renal dysfunction. These trends were persisted with medical therapy at hospital dis- charge.
Angiographic Findings
Angiographic findings are shown in Table 4. CAG was performed in 6,041 (88.4%) of total study population and patients with renal dysfunction were less likely to undergo CAG. Of infarct-related arteries, right coronary artery (RCA) and left main trunk increased with declining renal function. Multivessel disease on CAG had remarkably high incidence in patients with renal dysfunction. However, complex lesion (type C) and Thrombolysis In Myocardial Infarction (TIMI) flow of grade 0 at initial CAG had fairly similar incidence among each group.
Normal renal Preserved renal Mild renal Moderate renal Severe renal p value
function function dysfunction dysfunction dysfunction
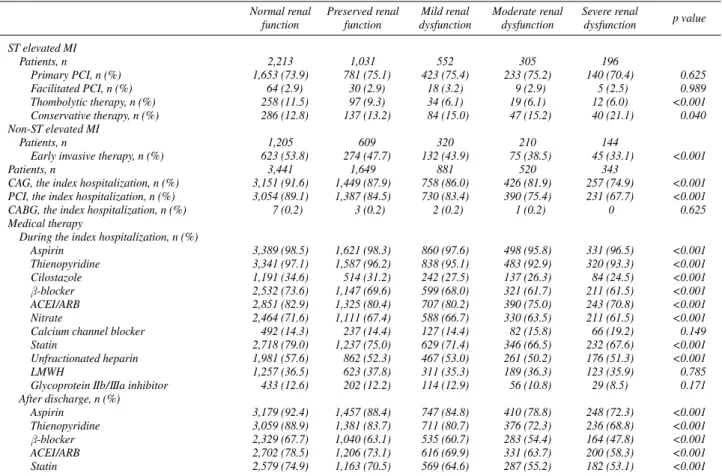
ST elevated MI
Patients, n 2,213 1,031 552 305 196
Primary PCI, n (%) 1,653 (73.9) 781 (75.1) 423 (75.4) 233 (75.2) 140 (70.4) 0.625
Facilitated PCI, n (%) 64 (2.9) 30 (2.9) 18 (3.2) 9 (2.9) 5 (2.5) 0.989
Thombolytic therapy, n (%) 258 (11.5) 97 (9.3) 34 (6.1) 19 (6.1) 12 (6.0) <0.001
Conservative therapy, n (%) 286 (12.8) 137 (13.2) 84 (15.0) 47 (15.2) 40 (21.1) 0.040 Non-ST elevated MI
Patients, n 1,205 609 320 210 144
Early invasive therapy, n (%) 623 (53.8) 274 (47.7) 132 (43.9) 75 (38.5) 45 (33.1) <0.001
Patients, n 3,441 1,649 881 520 343
CAG, the index hospitalization, n (%) 3,151 (91.6) 1,449 (87.9) 758 (86.0) 426 (81.9) 257 (74.9) <0.001 PCI, the index hospitalization, n (%) 3,054 (89.1) 1,387 (84.5) 730 (83.4) 390 (75.4) 231 (67.7) <0.001
CABG, the index hospitalization, n (%) 7 (0.2) 3 (0.2) 2 (0.2) 1 (0.2) 0 0.625
Medical therapy
During the index hospitalization, n (%)
Aspirin 3,389 (98.5) 1,621 (98.3) 860 (97.6) 498 (95.8) 331 (96.5) <0.001
Thienopyridine 3,341 (97.1) 1,587 (96.2) 838 (95.1) 483 (92.9) 320 (93.3) <0.001
Cilostazole 1,191 (34.6) 514 (31.2) 242 (27.5) 137 (26.3) 84 (24.5) <0.001
β-blocker 2,532 (73.6) 1,147 (69.6) 599 (68.0) 321 (61.7) 211 (61.5) <0.001
ACEI/ARB 2,851 (82.9) 1,325 (80.4) 707 (80.2) 390 (75.0) 243 (70.8) <0.001
Nitrate 2,464 (71.6) 1,111 (67.4) 588 (66.7) 330 (63.5) 211 (61.5) <0.001
Calcium channel blocker 492 (14.3) 237 (14.4) 127 (14.4) 82 (15.8) 66 (19.2) 0.149
Statin 2,718 (79.0) 1,237 (75.0) 629 (71.4) 346 (66.5) 232 (67.6) <0.001
Unfractionated heparin 1,981 (57.6) 862 (52.3) 467 (53.0) 261 (50.2) 176 (51.3) <0.001
LMWH 1,257 (36.5) 623 (37.8) 311 (35.3) 189 (36.3) 123 (35.9) 0.785
Glycoprotein IIb/IIIa inhibitor 433 (12.6) 202 (12.2) 114 (12.9) 56 (10.8) 29 (8.5) 0.171 After discharge, n (%)
Aspirin 3,179 (92.4) 1,457 (88.4) 747 (84.8) 410 (78.8) 248 (72.3) <0.001
Thienopyridine 3,059 (88.9) 1,381 (83.7) 711 (80.7) 376 (72.3) 236 (68.8) <0.001
β-blocker 2,329 (67.7) 1,040 (63.1) 535 (60.7) 283 (54.4) 164 (47.8) <0.001
ACEI/ARB 2,702 (78.5) 1,206 (73.1) 616 (69.9) 331 (63.7) 200 (58.3) <0.001
Statin 2,579 (74.9) 1,163 (70.5) 569 (64.6) 287 (55.2) 182 (53.1) <0.001
Table 2 Treatments of Acute MI According to the eGFR
CAG, coronary angiography; ACEI/ARB, angiotensin-converting enzyme inhibitor/angiotensin receptor blocker; LMWH, low molecular weight heparin. Other abbreviations see in Table 1.
Table 3 Determinants of Primary Reperfusion Therapy
Adjusted results ST elevated MI Non-ST elevated MI
OR (95%CI) p value OR (95%CI) p value
Chest pain 1.9 (1.4–2.5) <0.001 2.9 (2.3–3.8) <0.001
Dyspnea 0.7 (0.6–1.0) 0.028
Q wave on initial ECG 0.4 (0.3–0.5) <0.001
Previous stroke 0.5 (0.3–0.8) 0.002
Malignancy 0.3 (0.2–0.7) 0.002
Symptom to door time, min 1.1 (1.0–1.3) <0.001
Female sex 0.7 (0.5–1.0) 0.031
LVEF <40% 1.9 (1.3–2.6) <0.001
Elevated lipid concentrations 1.5 (1.1–2.0) 0.003
Multivariate logistic regression model. Candidates for adjustment: age, sex, weight, abdominal circumference, previous MI, diabetes, current smoker, previous stroke, chronic lung disease, previous heart failure, cancer, symptom at presentation, Killip class > I, Q wave and bundle branch block on initial electrocardiogram, LVEF <40%, spectrum of renal function, ‘symptom to door time’, heart rate, serum creatinine concentration, CK-MB.
OR, odds ratio; CI, confidence interval; ECG, electrocardiogram. Other abbreviations see in Table 1.
Of patients who underwent PCI, plain balloon angioplas- ty and stent implantation were conducted in 442 (7.8%) and 5,249 (92.2%) patients, respectively. The rates of stent im- plantation were similar across the spectrum of renal func- tion. Bare metal stent, sirolimus-eluting stent (Cypher®, Cordis, Johnson & Johnson, New Brunswick, NJ, USA), paclitaxel-eluting stent (Taxus®, Boston Scientific, Boston, MA, USA) and other drug-eluting stents were analyzed and compared with implanted stent during PCI, but there was no significant differences according to type of stent in among each group. The use of stent with small diameter (≤3 mm) was increased with declining renal function. Final TIMI flow of grade 3, as index of successful result of PCI, was obtained less frequently in the patients with moderate renal dysfunction. PCI-related complications including cardio- genic shock needing intra-aortic balloon counter-pulsation, heart failure class III or IV, secondary ventricular tachyar- rhythmia, major bleeding and stroke had 4-fold increment of incidence rates between patients with normal renal func- tion and those with severe renal dysfunction.
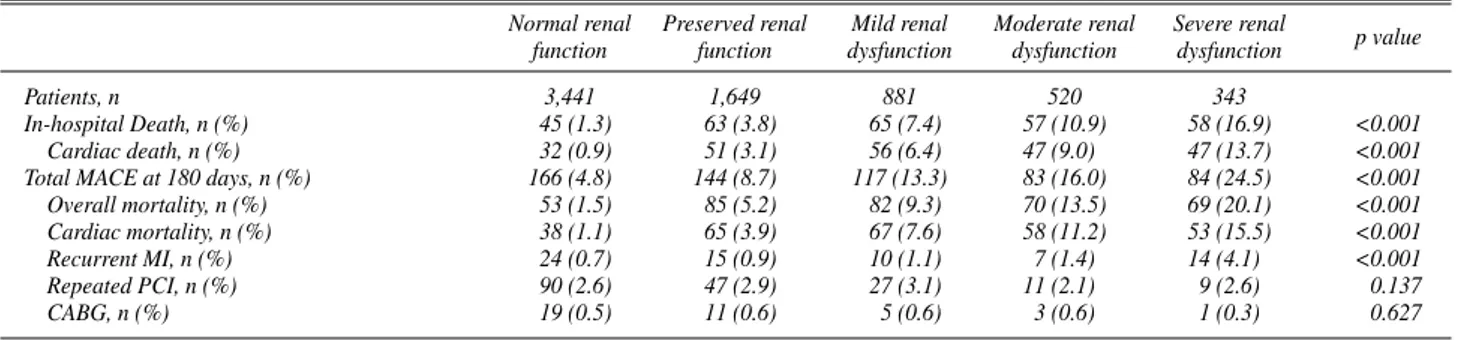
Clinical Outcomes According to Renal Function and Predictors of Clinical Outcomes
Of the total 6,834 patients, in-hospital mortality was recorded in 288 (4.3%) patients. Long-term mortality and adverse events were developed in 359 (5.3%) and 594 (8.7%) patients, respectively.
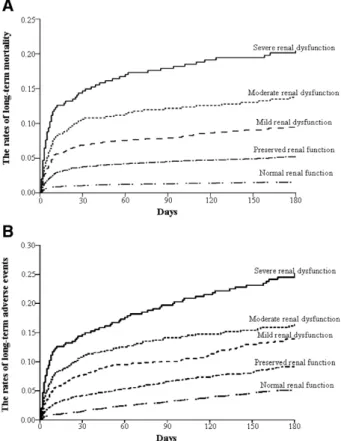
During the index hospitalization, overall mortality was observed more frequently in patients with renal dysfunc- tion (Table 5). These findings were persisted in long-term mortality and adverse events. Increments of long-term mor- tality and adverse event rates began even at patients with mild renal dysfunction as compared with those with normal renal function (Fig 1). A stepwise increment of risk ratio for mortality and adverse events according to renal function was shown at Table 6. However, statistical significance of increased risk ratio for in-hospital mortality was observed in just 2 groups with moderate and severe renal dysfunction.
Also, only 1 group of severe renal dysfunction had signifi- cance in increased risk ratio for long-term mortality and adverse events.
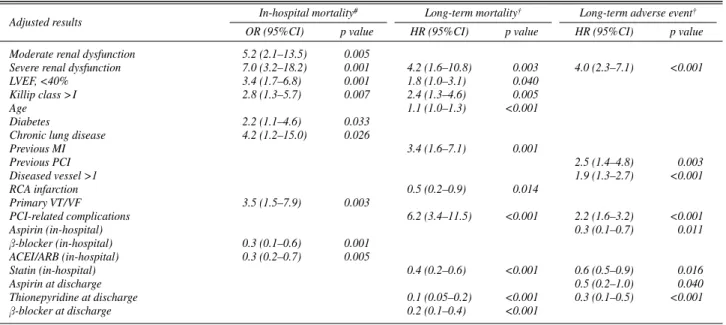
Predictors of in-hospital mortality were diabetes, lung dis- ease, Killip class >I, LVEF <40%, and moderate and severe renal dysfunction (Table 7). Prescription ofβ-blocker and
Normal renal Preserved renal Mild renal Moderate renal Severe renal p value
function function dysfunction dysfunction dysfunction
CAG during the index hospitalization
Patients, n 3,151 1,449 758 426 257
Diseased vessel >1, n (%) 1,665 (52.9) 879 (60.5) 507 (67.0) 307 (71.9) 189 (73.8) <0.001
Target vessel, n (%) <0.001
Left anterior descending 1,606 (51.0) 698 (48.2) 326 (43.0) 192 (45.1) 100 (38.9)
Left circumflex 521 (16.5) 223 (15.4) 128 (16.9) 62 (14.6) 25 (9.7)
Right coronary 982 (31.2) 496 (34.2) 284 (37.5) 161 (37.8) 119 (46.3)
Left main 42 (1.3) 32 (2.2) 20 (2.6) 11 (2.6) 13 (5.1)
Lesion type C, n (%) 1,456 (49.2) 718 (52.4) 383 (53.6) 219 (54.6) 132 (53.9) 0.098
TIMI flow grade 0 at initial CAG, n (%) 1,319 (43.1) 648 (45.9) 312 (42.3) 189 (46.6) 121 (48.2) 0.314 PCI during the index hospitalization
Patients, n 3,054 1,387 730 390 231
Stent implantation, n (%) 2,790 (91.2) 1,242 (89.3) 651 (89.2) 353 (90.3) 213 (92.2) 0.160
Kind of implanted stents, n (%) 0.265
Sirolimus eluting stent 1,342 (48.6) 586 (48.1) 306 (47.8) 165 (47.4) 94 (44.8)
Paclitaxel eluting stent 928 (33.6) 391 (32.1) 211 (33.0) 120 (34.5) 81 (38.6) Other drug-eluting stent 284 (10.3) 167 (13.7) 74 (11.6) 38 (10.9) 17 (8.1)
Bare metal stent 208 (7.5) 74 (6.1) 49 (7.7) 25 (7.2) 18 (8.6)
Stent length >30 mm, n (%) 702 (25.5) 333 (27.3) 192 (30.0) 90 (25.8) 59 (28.0) 0.172 Stent diameter ≤3.0 mm, n (%) 514 (18.6) 259 (21.2) 163 (25.5) 80 (23.0) 65 (30.8) <0.001
Multiple stents, n (%) 932 (34.2) 422 (35.2) 260 (41.0) 130 (38.6) 78 (37.7) 0.016
Final TIMI flow grade 3, n (%) 2,778 (94.2) 1,234 (92.0) 653 (92.4) 339 (88.7) 213 (90.6) 0.004
PCI-related complication, n (%) 275 (8.1) 230 (14.2) 168 (19.4) 111 (21.7) 111 (33.1) <0.001
Table 4 CAG and PCI According to the eGFR
TIMI, Thrombolysis In Myocardial Infarction. Other abbreviations see in Table 1.
Normal renal Preserved renal Mild renal Moderate renal Severe renal
p value
function function dysfunction dysfunction dysfunction
Patients, n 3,441 1,649 881 520 343
In-hospital Death, n (%) 45 (1.3) 63 (3.8) 65 (7.4) 57 (10.9) 58 (16.9) <0.001
Cardiac death, n (%) 32 (0.9) 51 (3.1) 56 (6.4) 47 (9.0) 47 (13.7) <0.001
Total MACE at 180 days, n (%) 166 (4.8) 144 (8.7) 117 (13.3) 83 (16.0) 84 (24.5) <0.001
Overall mortality, n (%) 53 (1.5) 85 (5.2) 82 (9.3) 70 (13.5) 69 (20.1) <0.001
Cardiac mortality, n (%) 38 (1.1) 65 (3.9) 67 (7.6) 58 (11.2) 53 (15.5) <0.001
Recurrent MI, n (%) 24 (0.7) 15 (0.9) 10 (1.1) 7 (1.4) 14 (4.1) <0.001
Repeated PCI, n (%) 90 (2.6) 47 (2.9) 27 (3.1) 11 (2.1) 9 (2.6) 0.137
CABG, n (%) 19 (0.5) 11 (0.6) 5 (0.6) 3 (0.6) 1 (0.3) 0.627
Table 5 Outcome Data According to the eGFR
MACE, major cardiac adverse event. Other abbreviations see in Table 1.
ACE inhibitor/ARB improved survivals during hospitaliza- tion. Factors associated with an increased risk for long-term mortality included advanced age, previous MI, Killip class
>I and LVEF <40%, PCI-related complications and severe renal dysfunction. RCA infarction and the use of statin (in-hospital), thienopyridine andβ-blocker reduced long- term mortality. The risk for long-term adverse events was increased by severe renal dysfunction, multi-vessel disease, previous PCI and PCI-related complication.
Discussion
Serum Creatinine and Estimated GFR in Acute MI Although enrolled patients have serum creatinine con- centrations of ≤2.0 mg/dl as mild degree renal impairment, this work shows that renal function by estimated GFR has broad spectrum, and some patients have moderate or severe renal impairments. Our finding is consistent with some pre- vious studies. With comparison between serum creatinine and estimated GFR, the incidence of renal impairment has been underestimated by serum creatinine in same popula- tions with acute MI.2,14For example, Gibson et al showed that 74% of patients had a normal creatinine concentration of 1.2 mg/dl or less; however, nearly 60% had any degree of renal dysfunction (estimated GFR ≤90 ml·min–1·1.73 m–2) with 20% having moderate or severe renal dysfunction.14 Also, previous studies showed that the incidence of renal impairment, reflected by estimated GFR, was remarkably high in patients with acute MI.1,15This observation seems to be important because we should avoid underscoring renal function by solely use of serum creatinine in real practice.
Consequently, physicians have to rely on estimated GFR, as an index of renal function, rather than serum creatinine concentrations in patients with acute MI.
Renal Function and Clinical Outcomes After Acute MI Furthermore, the present study shows that estimated GFR has a significant impact on survival rates after acute MI, even in patients with normal or mildly elevated value of serum creatinine. The gradient of long-term survival rates is observed in patients with mild renal dysfunction. We ob- serve a similar gradient of rates in overall adverse events.
This finding is consistent with previous works showing greater mortality rates in severe and end-stage renal dis- ease.14,16–18Explanations for more adverse outcomes have included several factors such as advanced age, excessive comorbidities, special pathophysiologic factors and ‘thera- peutic nihilism’ associated with renal dysfunction.6,17,19 These associations are confirmed and extended in our study by showing other clinical factors as follows: (1) remarka- bly higher incidence of hypertension, diabetes, stroke and previous heart failure; (2) underuse of reperfusion therapies
and standard medications; (3) serious angiographic findings;
and (4) development of more PCI-related complications with declining renal function.
With other conventional risk predictors, we identify moderate and severe renal dysfunction as the most signifi- cant risk predictor for in-hospital mortality after adjustment for confounding factors. However, only severe renal dys- function is represented as a prognostic factor in long-term mortality and adverse outcome. This might be explained by the specific pathologic conditions playing an important role over a longer period of time, in patients with severe renal dysfunction. These include a greater comorbidity and accel- erated atherosclerosis by enhanced oxidation of low-den- sity lipoprotein-cholesterol, endothelial dysfunction and pathologic arterial calcification.1,6,20Previous investigators reported that these potential mechanisms attribute to com- plications from acute MI.21,22In this work, the proportion of PCI-related complications has abrupt increase between
Fig 1. Life table estimates of the rates of long-term mortality (A) and of long-term adverse event (B) according to spectrum of renal function at 180 days.
Adjusted results Severe renal Moderate renal Mild renal Preserved renal Reference‡
dysfunction dysfunction dysfunction function
In-hospital mortality# OR (95%CI) 7.0 (3.2–18.2) 5.2 (2.1–13.5) 2.2 (0.7–6.7)§ 1.5 (0.5–4.3)§ 1.0
Long-term mortality† HR (95%CI) 4.2 (1.6–10.8) 1.5 (0.6–3.5)§ 1.3 (0.5–3.4)§ 0.8 (0.3–1.8)§ 1.0
Long-term adverse events† HR (95%CI) 4.0 (2.3–7.1) 1.5 (0.9–2.6)§ 1.4 (0.9–2.3)§ 1.0 (0.7–1.5)§ 1.0 Table 6 The Increased Risk for Death and MACE After MI According to the eGFR
HR, hazard ratio. Other abbreviations see in Tables 1,3,5.
#Multivariate logistic regression model.
†Cox proportional-hazards modeling.
§p-value is more than 0.05 for comparisons among all groups and for comparisons between individual groups.
‡Reference indicates normal renal function group.
severe and moderate renal dysfunction, and these compli- cations are one of the important predictors in long-term mortality.
Renal Function and Use of Medical Therapy
Previous studies which performed in randomized con- trolled trials have shown underuse of standard medications in patients with renal dysfunction.23–25This work confirms those findings in unselected patients, despite considerable advances of modern pharmaceutical treatment in acute MI.
We show that, as well as thrombolytic agent, medications with risk benefit after MI, are used less frequently during the index hospitalization and follow-up periods with de- clining renal function. Also, several medications have a significant impact on risk reduction of mortality and adverse outcome. The use of aspirin, thienopyridine, statin, β-blocker and ACE inhibitor have a favorable benefit to risk ratio for mortality and adverse events across the spec- trum of renal function.
McCullough et al reported that prescription of standard medications is limited by lack of evidence in patients with renal dysfunction, because these patients have been ex- cluded from randomized trials.26In real practice, physicians might be reluctant to prescribe drugs such as ACE inhibi- tors andβ-blockers for patients with some degree of renal dysfunction because of the concern that they may worsen renal function. Also, aspirin and thienopyridine in those pa- tients are commonly withheld as a result of increased risk for bleeding. However, it has been shown that the reduction of mortality after acute MI by prescription of these drugs might be even greater in high-risk patients.25Some studies have shown that ACE inhibitors andβ-blockers have a survival benefit in acute MI patients with LV dysfunction, even in the presence moderate renal dysfunction.25Recent- ly, in 2006, Hou et al reported the safety and utility of ACE inhibitor in advanced renal dysfunction, stage III and IV.27 We suggest that more aggressive prescription of proven medications should make survival rates even in patients with severe renal dysfunction to be improved.
Renal Function and the Use of Reperfusion Strategy Previous studies have shown that coronary reperfusion therapies during the index hospitalization are used less fre- quently in patients with renal dysfunction who develop acute MI.17,22,23As a medical treatment, this is partly asso- ciated with advanced age, increased comorbidity and more compromised hemodynamic status in decreased renal func- tion.26Wright et al described that patients with any degree of renal dysfunction are more likely to have contraindications to thrombolytic therapy than those without renal dysfunc- tion.28 We partly ascertained previous works; however, primary and facilitated PCIs in patients with STEMI are performed with similar rate among each group. When acute MI is specified to STEMI and NSTEMI, renal function does not seem to be considered as determinant of early and pri- mary reperfusion therapy in both subgroups of acute MI.
As compared with early reports, which described primary reperfusion therapy, we think more aggressive therapy has been accomplished, at least in primary reperfusion regard- less of renal function.
It has not been conclusive that PCI reduces risk ratio of mortality after acute MI in populations with lower spectrum of renal function. Al Suwaidi et al showed that invasive re- perfusion therapy, PCI and CABG, is not a significant pre- dictor of 30-day mortality model.22However, other studies reported that reperfusion therapies have the benefits to risk for long-term mortality and improve survival rates.16,28 In this work, we found that reperfusion therapies represent no impacts on risk for mortality, despite remarkable advances in PCI and more aggressive approach. We cannot fully explain why these strategies are not associated with risk reduction. It is partly explained by some factors that PCI- related complications might counterbalance the benefits from early reperfusion.28Also, contrast induced worsening renal function and volume status during and after PCI might be attributed to those results.29Dragu et al reported that survival rates in patients who underwent primary PCI are the lowest as compared with those with thrombolysis and even in those without reperfusion therapy.30We think
Table 7 Predictors of Clinical Outcomes
Adjusted results In-hospital mortality# Long-term mortality† Long-term adverse event†
OR (95%CI) p value HR (95%CI) p value HR (95%CI) p value
Moderate renal dysfunction 5.2 (2.1–13.5) 0.005
Severe renal dysfunction 7.0 (3.2–18.2) 0.001 4.2 (1.6–10.8) 0.003 4.0 (2.3–7.1) <0.001
LVEF, <40% 3.4 (1.7–6.8) 0.001 1.8 (1.0–3.1) 0.040
Killip class > I 2.8 (1.3–5.7) 0.007 2.4 (1.3–4.6) 0.005
Age 1.1 (1.0–1.3) <0.001
Diabetes 2.2 (1.1–4.6) 0.033
Chronic lung disease 4.2 (1.2–15.0) 0.026
Previous MI 3.4 (1.6–7.1) 0.001
Previous PCI 2.5 (1.4–4.8) 0.003
Diseased vessel >1 1.9 (1.3–2.7) <0.001
RCA infarction 0.5 (0.2–0.9) 0.014
Primary VT/VF 3.5 (1.5–7.9) 0.003
PCI-related complications 6.2 (3.4–11.5) <0.001 2.2 (1.6–3.2) <0.001
Aspirin (in-hospital) 0.3 (0.1–0.7) 0.011
β-blocker (in-hospital) 0.3 (0.1–0.6) 0.001
ACEI/ARB (in-hospital) 0.3 (0.2–0.7) 0.005
Statin (in-hospital) 0.4 (0.2–0.6) <0.001 0.6 (0.5–0.9) 0.016
Aspirin at discharge 0.5 (0.2–1.0) 0.040
Thionepyridine at discharge 0.1 (0.05–0.2) <0.001 0.3 (0.1–0.5) <0.001
β-blocker at discharge 0.2 (0.1–0.4) <0.001
RCA, right coronary artery. Other abbreviations see in Tables 1–3,6.
#Multivariate logistic regression model.
†Cox proportional-hazards modeling.