D I A B E T E S & M E T A B O L I S M J O U R N A L D I A B E T E S & M E T A B O L I S M J O U R N A L
This is an Open Access article distributed under the terms of the Creative Commons Attribution Non-Commercial License (http://creativecommons.org/licenses/by-nc/4.0/) which permits unrestricted non-commercial use, distribution, and reproduction in any medium, provided the original work is properly cited.
Presence of Carotid Plaque Is Associated with Rapid Renal Function Decline in Patients with Type 2
Diabetes Mellitus and Normal Renal Function
Da Hea Seo1,*, So Hun Kim1,*, Joon Ho Song2, Seongbin Hong1, Young Ju Suh3, Seong Hee Ahn1, Jeong-Taek Woo4, Sei Hyun Baik5, Yongsoo Park6, Kwan Woo Lee7, Young Seol Kim4, Moonsuk Nam1, on Behalf of the KNDP Study Group
Departments of 1Endocrinology and Metabolism, 2Nephrology and Hypertension, 3Biomedical Sciences, Inha University School of Medicine, Incheon,
4Department of Endocrinology and Metabolism, Kyung Hee University School of Medicine, Seoul,
5Department of Internal Medicine, Korea University College of Medicine, Seoul, Korea,
6Department of Molecular and Integrative Physiology, University of Illinois at Urbana-Champaign, IL, USA,
7Department of Endocrinology and Metabolism, Ajou University School of Medicine, Suwon, Korea
Background: Recent evidences indicate that early rapid renal function decline is closely associated with the development and progression of diabetic kidney disease. We have investigated the association between carotid atherosclerosis and rapid renal func- tion decline in patients with type 2 diabetes mellitus and preserved renal function.
Methods: In a prospective, multicenter cohort, a total of 967 patients with type 2 diabetes mellitus and preserved renal function were followed for 6 years with serial estimated glomerular filtration rate (eGFR) measurements. Common carotid intima-media thickness (CIMT) and presence of carotid plaque were assessed at baseline. Rapid renal function decline was defined as an eGFR decline >3.3% per year.
Results: Over a median follow-up of 6 years, 158 participants (16.3%) developed rapid renal function decline. While there was no difference in CIMT, the presence of carotid plaque in rapid decliners was significantly higher than in non-decliners (23.2% vs.
12.2%, P<0.001). In multivariable logistic regression analysis, presence of carotid plaque was an independent predictor of rapid renal function decline (odds ratio, 2.33; 95% confidence interval, 1.48 to 3.68; P<0.0001) after adjustment for established risk fac- tors. The model including the carotid plaque had better performance for discrimination of rapid renal function decline than the model without carotid plaque (area under the receiver operating characteristic curve 0.772 vs. 0.744, P=0.016).
Conclusion: Close monitoring of renal function and early intensive management may be beneficial in patients with type 2 diabe- tes mellitus and carotid plaques.
Keywords: Carotid stenosis; Diabetes mellitus, type 2; Diabetic nephropathies
Corresponding author: Moonsuk Nam https://orcid.org/0000-0003-1756-8498 Department of Endocrinology and Metabolism, Inha University School of Medicine, 100 Inha-ro, Nam-gu, Incheon 22212, Korea
E-mail: [email protected]
*Da Hea Seo and So Hun Kim contributed equally to this study as first authors.
Parts of this study were presented in abstract form at the 78th Scientific Session of the
INTRODUCTION
The population of diabetic kidney disease (DKD) continues to rise around the world. DKD leads to excess morbidity and pre- mature mortality and is a great socioeconomic burden in pa-
tients with diabetes [1]. Traditionally, microalbuminuria has been known as an early predictor of the onset of DKD. Howev- er, recent studies have demonstrated that a substantial number of patients with type 2 diabetes mellitus (T2DM) with chronic kidney disease (CKD) exhibited no albuminuria, challenging https://doi.org/10.4093/dmj.2018.0186
pISSN 2233-6079 · eISSN 2233-6087
the traditional concept of the natural history of DKD that is closely linked to the progression of albuminuria [2,3].
A decline in glomerular filtration rate (GFR) was initially considered to occur only in patients with albuminuria [4].
However, recent studies in type 1 diabetes mellitus explored trajectories of estimated glomerular filtration rate (eGFR) de- cline and found that there is a subset of patients with early pro- gressive rapid renal function decline which occurs while pa- tients have preserved renal function and continues to progress until they reach end stage renal disease (ESRD) [5,6]. Interest- ingly, this rapid renal function decline may sometimes precede the onset of albuminuria [2,3,7]. It is also suggested that rapid renal function decline is another strong predictor of progres- sion to ESRD [7,8]. Many observational studies have investi- gated potential clinical risk factors contributing to rapid renal function decline in diabetes. However, the results have been somewhat inconsistent due to various definitions of rapid renal function decline and heterogeneous patient populations [2,5,7- 10]. Furthermore, literature relevant to rapid renal function decline in T2DM and preserved kidney function is limited [8- 10]. Measurements of urine albumin-creatinine ratio (UACR) and eGFR have been current standard of care to diagnose dia- betic nephropathy. However, they have limited utility distin- guishing early renal function decliners from non-decliners.
Currently, there is a lack of effective prognostic markers that can identify decliners in T2DM. As early implementation of intensive therapy in those patients at risk of developing rapid renal function decline would result in better outcomes than treating them late during the course [11], identification of di- agnostic markers of rapid renal function decline is crucial.
Carotid intima-media thickness (CIMT) and carotid plaque (CP) are non-invasive measurement of carotid atherosclerosis and are reliable markers of early systemic atherosclerosis and cardiovascular risk [12]. Kidney dysfunction even in the earli- est stage is closely linked to cardiovascular diseases (CVDs) [13]. DKD and CVD also share many risk factors [9]. Previous studies have shown that increased CIMT was associated with low eGFR [14] and progression to CKD in T2DM [15]. How- ever, these studies were relatively small in size and the associa- tion between early rapid renal function decline and CP was not assessed. Therefore, in the present study, we aimed to investi- gate the association between carotid atherosclerosis including CP and early rapid renal function decline in a prospective ob- servational cohort study of patients with T2DM and preserved renal function.
METHODS
Study population
The study protocol was approved by the Institutional Review Board of each institution (IRB 2006-67) and all participants provided written informed consent prior to participation. Sub- jects were participants in the Korean National Diabetes Pro- gram (KNDP), a prospective, observational, multicenter co- hort study of patients with T2DM who were recruited to un- derstand the characteristics of Koreans with T2DM. Clinical- Trials.gov identifier was NCT01212198. The details of the KNDP cohort have been described previously [16]. Briefly, subjects were eligible to participate in the study if the patient was diagnosed with T2DM according to the American Diabe- tes Association criteria and/or was being treated with oral hy- poglycemic agents or insulin for known T2DM [17].
A total of 4,324 patients with T2DM were enrolled from 12 academic medical centers of Korea during the period from May 2006 to July 2009 and then followed up until March 2014.
Of these subjects, patients with diabetes duration <1 year, those with an eGFR <60 mL/min/1.73 m2 and those who had
<6 annual GFR measurements during the follow-up were ex- cluded. Finally, 967 patients with preserved renal function met the inclusion criteria and were included in the current analysis.
Demographic, physical, and laboratory measurements Information on medical history was obtained from all patients during interviews by trained personnel. Height and weight were measured to the nearest 0.1 cm and 0.1 kg, respectively.
Body mass index was defined as weight (kg) divided by height (m) squared. Waist circumference was measured at the mid- point between the lower borders of the rib cage and the iliac crest. Blood pressure was measured after the subject had rested for at least 10 minutes in a sitting position. Diabetic retinopa- thy was diagnosed based on fundoscopic examinations [18].
Hypertension was defined as blood pressure ≥140/90 mm Hg or any antihypertensive drug treatment. CVD was defined as presence of ischemic heart diseases including stable angina, acute coronary syndrome and myocardial infarction with ST segment elevation.
Blood samples were collected after an overnight fast of at least 10 hours and stored at –70°C for subsequent assays. Se- rum triglycerides and high density lipoprotein cholesterol lev- els were determined enzymatically using a chemistry analyzer (Hitachi 747; Hitachi, Tokyo, Japan). Low density lipoprotein
cholesterol levels were calculated using the Friedewald formula [19]. A glucose oxidase method was employed to measure plasma glucose, and an electro-chemiluminescence immuno- assay (Roche Diagnostics, Indianapolis, IN, USA) was used to measure insulin levels. Homeostasis model assessment of insu- lin resistance levels were calculated by dividing the product of fasting insulin (IU/mL) and fasting glucose (mmol/L) concen- trations by 22.5 [20]. Glycosylated hemoglobin (HbA1c) was measured using high performance liquid chromatography (Bio-Rad Variant II; Bio-Rad, Hercules, CA, USA). A random urine sample was obtained for albumin creatinine ratio (ACR) measurements. Urinary creatinine and albumin were mea- sured using a turbidimetric assay (Cobas Integra; Roche Diag- nostics, Mannheim, Germany). Normoalbuminuria was de- fined as a spot UACR <30 μg/mg Cr, microalbuminuria as UACR ≥30 and <299 μg/mg Cr, and macroalbuminuria as UACR ≥300 μg/mg Cr [21].
Renal function measurement
The eGFR values were calculated using the Chronic Kidney Disease Epidemiology Collaboration (CKD-EPI) creatinine equation [22]: it was calculated as eGFR=141×min(Scr/κ,1)α× max(Scr/κ, 1)−1.209×0.993Age×1.018 (if female) (where Scr is se- rum creatinine in mg/dL; κ is 0.7 for females and 0.9 for males;
α is −0.329 for females and −0.411 for males; min is the mini- mum of Scr/κ or 1; and max is the maximum of Scr/κ or 1).
Annual eGFR decline was calculated as follows. For each pa- tient, a linear regression model of time on eGFR (least-squares method) was created, and the slope of the regression line was used to estimate the patient’s changes in eGFR over time. The eGFR slope was expressed as percentage per year by dividing the slope by the baseline eGFR value [10]. Rapid renal function decline was defined as eGFR decline >3.3%/year, which is in accordance with previous studies [7,8].
CIMT and CP assessment
CIMT and presence of CP were measured in the right and left common carotid arteries (CCAs) by high resolution B-mode ultrasonography as previously described [23]. Sonographers that were unaware of subjects’ characteristics scanned bilateral CCAs, the carotid bulb, and the proximal portions of the inter- nal and external carotid arteries in two planes (anterior oblique and lateral), and then focused on the interfaces required to measure intima-media thickness (IMT) and on any areas of focal plaque. CP was defined as a focal structure encroaching
into the arterial lumen with a thickness >1.2 mm [24]. Mea- surements from the left and right CCAs were made at the far walls of the 20-mm segment distal to the carotid bulbs. Read- ing and analysis of images were done by a single well-trained physician who was blinded to the identity of the patient. The mean value of left and right CCAs IMT was used as the mean CIMT. Computer-assisted acquisition, processing, storage of B-mode images, and CIMT calculations were performed using Intima Scope software (MediaCross, Tokyo, Japan). To mea- sure reader reproducibility, IMT for the first 122 subjects were measured repeatedly, and the results indicated that there was a 0.00±0.03 difference in the mean IMT. To minimize inter- measurer errors, workshops were conducted for ultrasound measurers from all participating institutions before study initi- ation and then annually during the study, and inter-measurer reproducibility was measured for the reference. During the en- tire period, intra-class correlation for ultrasound measurers was 0.97 to 0.99 for the mean IMT.
Statistical analysis
Data are presented as mean±standard deviation and frequen- cies. Skewed variables were logarithmically transformed to im- prove normality before analysis (ACR, mean CIMT). The t-test (for continuous variables) and the chi-square test (for categori- cal variables) were used to analyze the differences among the baseline characteristics of participants stratified by presence or absence of rapid renal function decline or CP. Univariable and multivariable logistic regression models were performed to ex- amine the associations between variables at baseline and the development of rapid renal function decline. Area under the curve (AUC) from receiver operating characteristics analysis was estimated to evaluate the discriminatory performance for the multivariable logistic regression model on the rapid renal function decline adjusting for clinical risk factors and CP. The difference between AUC estimates between the models with (i=1) and without CP (i=2) was tested using the Wald statistic:
for an estimated AUC in the model i and correlation coef- ficient r between two , which asymptotically follows a stan- dard normal distribution [25]. These clinical risk factors were chosen on the basis of their significance in multivariable logis- tic analysis or on the basis of their biologic plausibility. All analyses were done with 95% confidence intervals (CI) and the
SE( )2+SE( )2−2rSE( )SE( )
level of significance was determined at P<0.05. Statistical anal- ysis was performed with SPSS version 19.0 statistical package software (IBM Co., Armonk, NY, USA).
RESULTS
A total of 967 patients with T2DM (mean age 53.7±9.4 years;
57.4% men) were included in the present study. Mean duration of diabetes was 5.4±5.8 years and mean HbA1c was 7.7%±
1.8%. Baseline eGFR was 95.6±14.6 mL/min/1.73 m2. Six hun- dred and fifty-five patients (67.7%) had normoalbuminuria, 191 (19.8%) had microalbuminuria, and 23 (2.4%) had macro- albuminuria. Four hundred and forty-three (45.8%) had hy- pertension, 107 (1.1%) had previous history of CVD, and 315 (32.6%) had CP.
All patients had at least six annual measurements of eGFR with a median follow-up duration of 6 years (range, 5 to 6 years).
Annual eGFR decline (%) of the whole cohort was –1.1%±
2.6%/year. The decline was more rapid in female (–2.1%±
2.5%/year) than male (–0.4%±2.4%/year; P<0.001) (Supple- mentary Table 1). During the follow-up period, 158 patients (16.3%) showed rapid decline of eGFR, as defined as >3.3%/
year. Mean annual eGFR decline was –5.2%±1.9%/year in rap- id decliners and –0.4%±1.9%/year in non-decliners (P<
0.001). One patient developed ESRD at the end of follow-up.
In a sub-analysis of females, the proportion of rapid decliners was marginally higher in postmenopausal women compared to premenopausal women (19.9% vs. 28.8% in premenopausal women and postmenopausal women respectively, P=0.051) (Supplementary Table 2).
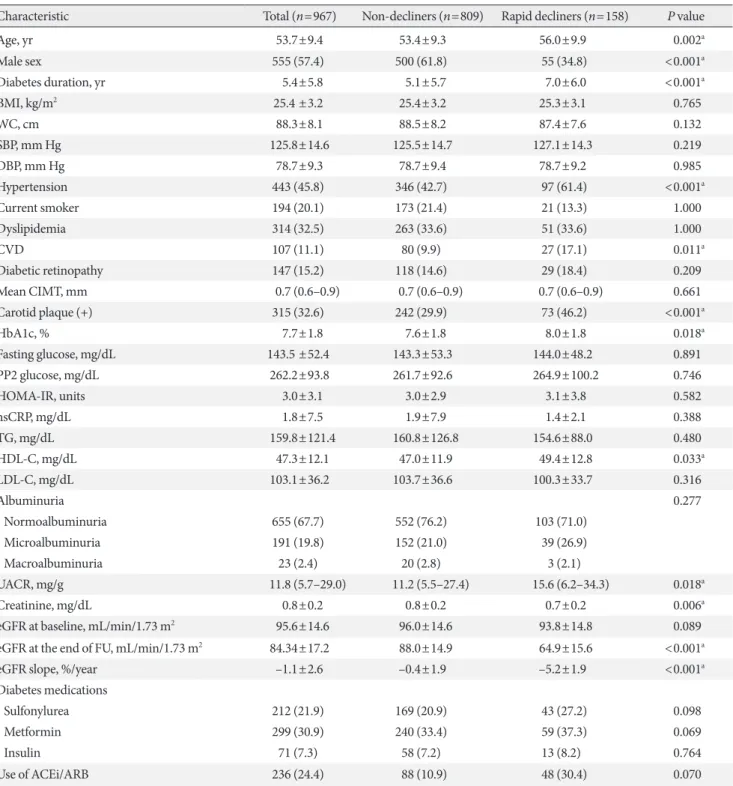
Baseline characteristics of rapid decliners and non-decliners are summarized in Table 1. Rapid decliners were significantly older, tended to be females, and exhibited a longer duration of diabetes. They also had a higher prevalence of hypertension, CVD and CP but there was no significant difference in CIMT between groups. Patients with rapid renal function decline had higher level of HbA1c and UACR at baseline. However, the majority of the rapid decliners showed normoalbuminuria at baseline (71.0%), which was comparable to 76.2% of non-de- cliners. The presence of diabetic retinopathy did not differ be- tween two groups.
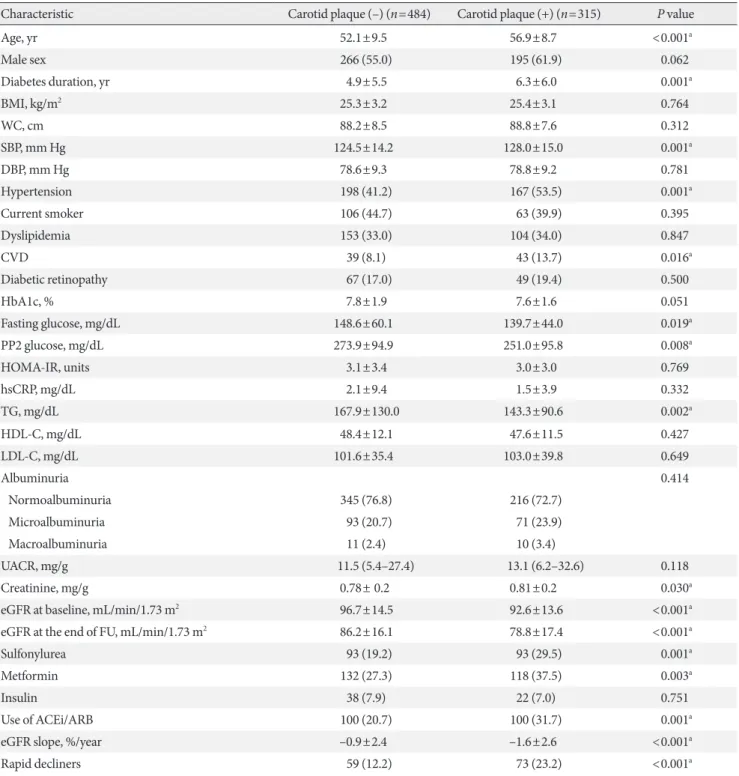
When stratified by the presence of CP (Table 2), patients with CP were significantly older, exhibited longer duration of diabetes, higher SBP, and lower baseline eGFR. They also had a higher prevalence of hypertension and CVD, and were treated
more frequently with metformin, sulfonylurea, and angioten- sin-converting-enzyme inhibitors (ACEi)/angiotensin II-re- ceptor blockers (ARB). They had a higher proportion of pa- tients with rapid renal function decline and showed greater an- nual mean eGFR decline (%). UACR was not different between groups and 72.7% of patients with CP had normoalbuminuria at baseline.
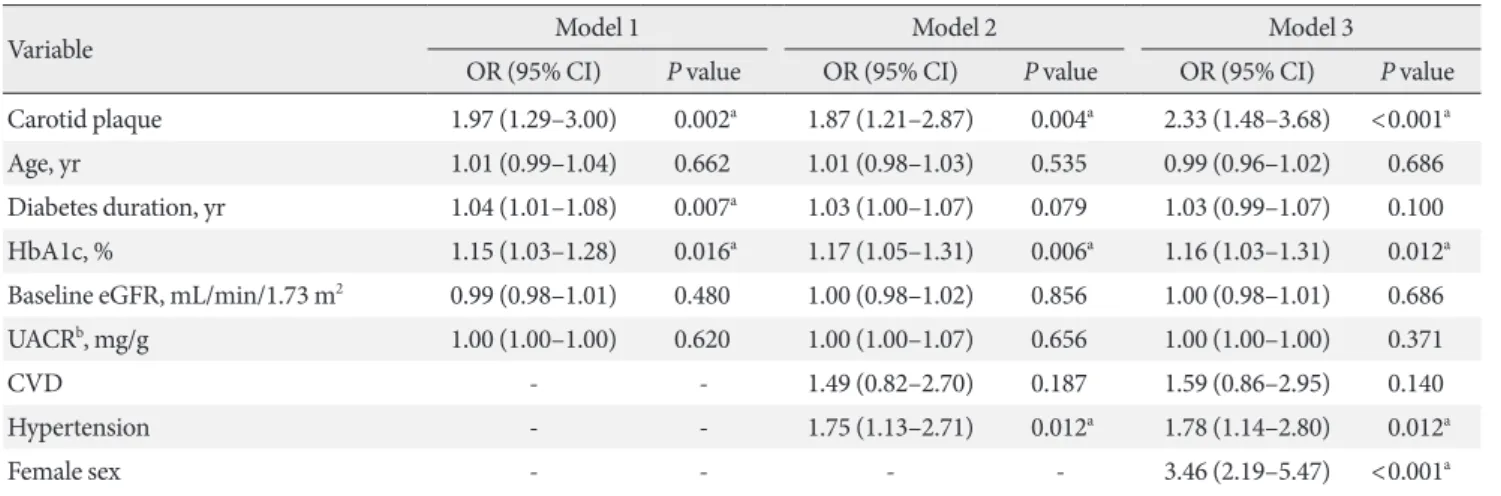
The presence of CP was associated with rapid renal function decline after adjustment for potential confounders including age, sex, duration of diabetes, HbA1c, baseline eGFR, UACR, previous history of CVD and hypertension (Table 3). The ad- justed odds ratio (OR) for rapid renal function decline with the presence of CP was 2.33 (95% CI, 1.48 to 3.68; P<0.0001).
Other significant predictors of rapid renal function decline were female sex (OR, 3.46; 95% CI, 2.19 to 5.47; P<0.0001), hypertension (OR, 1.78; 95% CI, 1.14 to 2.80; P=0.012), and higher HbA1c (OR, 1.16; 95% CI, 1.03 to 1.31; P<0.012) at baseline. In a sub-analysis of females, stratified by menopause status, the presence of CP was an independent risk factor for postmenopausal women (OR, 2.12; 95% CI, 1.06 to 4.25; P=
0.034) while no association was found in premenopausal women (Supplementary Table 3). The discriminatory ability of the model with CP on rapid renal function decline was com- pared by the AUC estimates (Fig. 1). For the model with clini- cal risk factors only (age, sex, duration of diabetes, hyperten- sion, CVD, diabetic retinopathy, use of ACEi/ARB, baseline eGFR, HbA1c, and UACR) of rapid renal function decline, the estimated AUC to discriminate rapid renal function decline was 0.744 (95% CI, 0.690 to 0.797; P<0.001). After the addi- tion of CP in the model, the discriminatory performance was significantly improved for rapid renal function decline (0.772;
95% CI, 0.722 to 0.822; P<0.001). The P value for the compari- son in AUCs for the models with and without CP was 0.016.
DISCUSSION
In this prospective, multicenter observational cohort followed over 6 years, we observed for the first time that the presence of CP was an independent predictor of early progressive rapid re- nal function decline in patients with T2DM and preserved re- nal function. Rapid renal function decline occurred in 16.3%
(n=158) of patients over 6 years in our cohort and the pres- ence of CP was one of the powerful risk factors for rapid renal function decline, even after adjusting for established clinical risk factors and confounders. Other independent clinical pre-
Table 1. Baseline characteristics of participants stratified by renal function decline status
Characteristic Total (n=967) Non-decliners (n=809) Rapid decliners (n=158) P value
Age, yr 53.7±9.4 53.4±9.3 56.0±9.9 0.002a
Male sex 555 (57.4) 500 (61.8) 55 (34.8) <0.001a
Diabetes duration, yr 5.4±5.8 5.1±5.7 7.0±6.0 <0.001a
BMI, kg/m2 25.4 ±3.2 25.4±3.2 25.3±3.1 0.765
WC, cm 88.3±8.1 88.5±8.2 87.4±7.6 0.132
SBP, mm Hg 125.8±14.6 125.5±14.7 127.1±14.3 0.219
DBP, mm Hg 78.7±9.3 78.7±9.4 78.7±9.2 0.985
Hypertension 443 (45.8) 346 (42.7) 97 (61.4) <0.001a
Current smoker 194 (20.1) 173 (21.4) 21 (13.3) 1.000
Dyslipidemia 314 (32.5) 263 (33.6) 51 (33.6) 1.000
CVD 107 (11.1) 80 (9.9) 27 (17.1) 0.011a
Diabetic retinopathy 147 (15.2) 118 (14.6) 29 (18.4) 0.209
Mean CIMT, mm 0.7 (0.6–0.9) 0.7 (0.6–0.9) 0.7 (0.6–0.9) 0.661
Carotid plaque (+) 315 (32.6) 242 (29.9) 73 (46.2) <0.001a
HbA1c, % 7.7±1.8 7.6±1.8 8.0±1.8 0.018a
Fasting glucose, mg/dL 143.5 ±52.4 143.3±53.3 144.0±48.2 0.891
PP2 glucose, mg/dL 262.2±93.8 261.7±92.6 264.9±100.2 0.746
HOMA-IR, units 3.0±3.1 3.0±2.9 3.1±3.8 0.582
hsCRP, mg/dL 1.8±7.5 1.9±7.9 1.4±2.1 0.388
TG, mg/dL 159.8±121.4 160.8±126.8 154.6±88.0 0.480
HDL-C, mg/dL 47.3±12.1 47.0±11.9 49.4±12.8 0.033a
LDL-C, mg/dL 103.1±36.2 103.7±36.6 100.3±33.7 0.316
Albuminuria 0.277
Normoalbuminuria 655 (67.7) 552 (76.2) 103 (71.0)
Microalbuminuria 191 (19.8) 152 (21.0) 39 (26.9)
Macroalbuminuria 23 (2.4) 20 (2.8) 3 (2.1)
UACR, mg/g 11.8 (5.7–29.0) 11.2 (5.5–27.4) 15.6 (6.2–34.3) 0.018a
Creatinine, mg/dL 0.8±0.2 0.8±0.2 0.7±0.2 0.006a
eGFR at baseline, mL/min/1.73 m2 95.6±14.6 96.0±14.6 93.8±14.8 0.089
eGFR at the end of FU, mL/min/1.73 m2 84.34±17.2 88.0±14.9 64.9±15.6 <0.001a
eGFR slope, %/year –1.1±2.6 –0.4±1.9 –5.2±1.9 <0.001a
Diabetes medications
Sulfonylurea 212 (21.9) 169 (20.9) 43 (27.2) 0.098
Metformin 299 (30.9) 240 (33.4) 59 (37.3) 0.069
Insulin 71 (7.3) 58 (7.2) 13 (8.2) 0.764
Use of ACEi/ARB 236 (24.4) 88 (10.9) 48 (30.4) 0.070
Values are presented as mean±standard deviation, number (%), or median (interquartile range). P values refer to the unpaired t-test or the chi- square test (for categorical variables).
BMI, body mass index; WC, waist circumference; SBP, systolic blood pressure; DBP, diastolic blood pressure; CVD, cardiovascular disease;
CIMT, carotid intima-media thickness; HbA1c, glycosylated hemoglobin; PP2, 2-hour post prandial; HOMA-IR, homeostasis model assess- ment of insulin resistance; hsCRP, high-sensitivity C-reactive protein; TG, triglyceride; HDL-C, high density lipoprotein cholesterol; LDL-C, low density lipoprotein cholesterol; UACR, urinary albumin creatinine ratio; eGFR, estimated glomerular filtration rate; FU, follow-up; ACEi, angiotensin-converting-enzyme inhibitor; ARB, angiotensin II-receptor blocker.
aStatistical significance.
Table 2. Comparison of baseline characteristics stratified by the presence of carotid plaque
Characteristic Carotid plaque (–) (n=484) Carotid plaque (+) (n=315) P value
Age, yr 52.1±9.5 56.9±8.7 <0.001a
Male sex 266 (55.0) 195 (61.9) 0.062
Diabetes duration, yr 4.9±5.5 6.3±6.0 0.001a
BMI, kg/m2 25.3±3.2 25.4±3.1 0.764
WC, cm 88.2±8.5 88.8±7.6 0.312
SBP, mm Hg 124.5±14.2 128.0±15.0 0.001a
DBP, mm Hg 78.6±9.3 78.8±9.2 0.781
Hypertension 198 (41.2) 167 (53.5) 0.001a
Current smoker 106 (44.7) 63 (39.9) 0.395
Dyslipidemia 153 (33.0) 104 (34.0) 0.847
CVD 39 (8.1) 43 (13.7) 0.016a
Diabetic retinopathy 67 (17.0) 49 (19.4) 0.500
HbA1c, % 7.8±1.9 7.6±1.6 0.051
Fasting glucose, mg/dL 148.6±60.1 139.7±44.0 0.019a
PP2 glucose, mg/dL 273.9±94.9 251.0±95.8 0.008a
HOMA-IR, units 3.1±3.4 3.0±3.0 0.769
hsCRP, mg/dL 2.1±9.4 1.5±3.9 0.332
TG, mg/dL 167.9±130.0 143.3±90.6 0.002a
HDL-C, mg/dL 48.4±12.1 47.6±11.5 0.427
LDL-C, mg/dL 101.6±35.4 103.0±39.8 0.649
Albuminuria 0.414
Normoalbuminuria 345 (76.8) 216 (72.7)
Microalbuminuria 93 (20.7) 71 (23.9)
Macroalbuminuria 11 (2.4) 10 (3.4)
UACR, mg/g 11.5 (5.4–27.4) 13.1 (6.2–32.6) 0.118
Creatinine, mg/g 0.78± 0.2 0.81±0.2 0.030a
eGFR at baseline, mL/min/1.73 m2 96.7±14.5 92.6±13.6 <0.001a
eGFR at the end of FU, mL/min/1.73 m2 86.2±16.1 78.8±17.4 <0.001a
Sulfonylurea 93 (19.2) 93 (29.5) 0.001a
Metformin 132 (27.3) 118 (37.5) 0.003a
Insulin 38 (7.9) 22 (7.0) 0.751
Use of ACEi/ARB 100 (20.7) 100 (31.7) 0.001a
eGFR slope, %/year –0.9±2.4 –1.6±2.6 <0.001a
Rapid decliners 59 (12.2) 73 (23.2) <0.001a
Values are presented as mean±standard deviation, number (%), or median (interquartile range). P values refer to the unpaired t-test or the chi- square test (for categorical variables).
BMI, body mass index; WC, waist circumference; SBP, systolic blood pressure; DBP, diastolic blood pressure; CVD, cardiovascular disease;
HbA1c, glycosylated hemoglobin; PP2, 2-hour post prandial; HOMA-IR, homeostasis model assessment of insulin resistance; hsCRP, high-sen- sitivity C-reactive protein; TG, triglyceride; HDL-C, high density lipoprotein cholesterol; LDL-C, low density lipoprotein cholesterol; UACR, urinary albumin creatinine ratio; eGFR, estimated glomerular filtration rate; FU, follow-up; ACEi, angiotensin-converting-enzyme inhibitor;
ARB, angiotensin II-receptor blocker.
aStatistical significance.
dictors for rapid renal function decline were female sex, hyper- tension, and higher HbA1c at baseline.
Non-invasive measurement of carotid atherosclerosis, in- cluding measurement of CIMT and CP allows monitoring of the presence and progression of atherosclerosis [24,26]. In the current study, CP was associated with rapid renal function de-
cline in patients with T2DM, while CIMT did not show any significant association. This may be due to the fact that CIMT and CP represent different stages of the atherosclerotic process.
CIMT likely reflects earlier stages of atherogenesis, mainly a hypertrophic response of arterial intimal and medial cells to lipid infiltration or hypertension. In contrast, CP may repre- sent a later stage of atherogenesis related to inflammation, oxi- dation, endothelial dysfunction, and smooth muscle cell pro- liferation [27,28].
There have been various studies examining the association between carotid atherosclerosis and renal function decline. In a multi-center study with non-diabetic population, kidney function was measured using cystatin C, which was signifi- cantly associated with both CIMT thickening and CP. Howev- er, another prospective study with healthy individuals showed that there was no independent relationship between ageing-re- lated decline in kidney function and CIMT [29]. Takenouchi et al. [15] investigated the association between CKD and CIMT in a prospective study with T2DM and found that maximum CIMT was one of the significant predictors of CKD deteriora- tion (hazard ratio, 4.0; 95% CI, 1.1 to 14,226.7; P=0.03) inde- pendent of other clinical risk factors including age. However, they included those patients with CKD at baseline and their sample size was rather small. We believe that inconsistent re- sults are most likely due to differences in the study population and and the definition of the primary end point. As the early rapid renal function decline is the process that occurs during Table 3. Clinical predictors for progression of rapid renal function decline
Variable Model 1 Model 2 Model 3
OR (95% CI) P value OR (95% CI) P value OR (95% CI) P value Carotid plaque 1.97 (1.29–3.00) 0.002a 1.87 (1.21–2.87) 0.004a 2.33 (1.48–3.68) <0.001a
Age, yr 1.01 (0.99–1.04) 0.662 1.01 (0.98–1.03) 0.535 0.99 (0.96–1.02) 0.686
Diabetes duration, yr 1.04 (1.01–1.08) 0.007a 1.03 (1.00–1.07) 0.079 1.03 (0.99–1.07) 0.100
HbA1c, % 1.15 (1.03–1.28) 0.016a 1.17 (1.05–1.31) 0.006a 1.16 (1.03–1.31) 0.012a
Baseline eGFR, mL/min/1.73 m2 0.99 (0.98–1.01) 0.480 1.00 (0.98–1.02) 0.856 1.00 (0.98–1.01) 0.686
UACRb, mg/g 1.00 (1.00–1.00) 0.620 1.00 (1.00–1.07) 0.656 1.00 (1.00–1.00) 0.371
CVD - - 1.49 (0.82–2.70) 0.187 1.59 (0.86–2.95) 0.140
Hypertension - - 1.75 (1.13–2.71) 0.012a 1.78 (1.14–2.80) 0.012a
Female sex - - - - 3.46 (2.19–5.47) <0.001a
Model 1 was adjusted for age, diabetes duration, HbA1c, baseline eGFR, and UACR. Model 2 included all variables in Model 1 plus presence of CVD and hypertension. Model 3 included all variables in Model 2 plus sex.
OR, odds ratio; CI, confidence interval; HbA1c, glycosylated hemoglobin; eGRF, estimated glomerular filtration rate; UACR, urinary albumin creatinine ratio; CVD, cardiovascular disease.
aStatistical significance, bLogarithm-transformed values were used for analysis.
Fig. 1. Receiver operating characteristic curve analysis of the models with or without carotid plaque. AUC, area under the curve; CI, confidence interval.
1.0 0.8 0.6 0.4 0.2 0
Sensitivity
0.2 0.4 0.6 0.8 1.0 1-Specificity
Known clinical risk factors AUC 0.744 (95% CI, 0.690−0.797) Presence of carotid artery plaque included
AUC 0.772 (95% CI, 0.722−0.822)
P=0.016
the preserved renal function, it may occur in those patients with higher vascular burden/risk, in this case, those with CP.
The present study suggests that subclinical atherosclerosis is strongly associated with rapid renal function decline indepen- dent of other clinical risk factors in patients with T2DM and preserved renal function. Although exact causation between atherosclerosis and rapid renal function decline needs to be further elucidated, we can speculate that ischemic renal chang- es caused by atherosclerosis of the intrarenal arteries may have resulted in rapid GFR decline even in the absence of albumin- uria [30,31]. Furthermore, it was reported that the renal resis- tive index (RI), a reliable marker of renal atherosclerosis, is sig- nificantly elevated in patient with diabetic nephropathy and correlated with creatinine clearance [32]. Given previously re- ported correlation between renal RI and carotid atherosclero- sis [33], these findings may implicate that intrarenal vascular resistance or renal atherosclerosis precedes classical patho- physiologic process of diabetic glomerulosclerosis in early re- nal function decline. Therefore, detection of CP by B-mode ul- trasonography may be an easy, non-invasive method for the early detection of those patients at risk for early rapid renal function decline [34].
In agreement with previous publications, we also found that hypertension was closely associated with rapid renal function decline [10,35]. Hypertension is a well-established risk factor for CVD as well as CP formation. Our study also showed a higher incidence of rapid renal function decline with greater annual eGFR decline (%) in women compared to men during 6 years of follow-up. Although estrogen is known to have reno- protective effects by alteration of renin-angiotensin system, re- duction in mesangial collagen synthesis, and upregulation of nitric oxide synthesis in kidney [36], diabetes itself alters sex hormone production in both women and men [37] and the ef- fect of alteration in sex hormone levels in DKD remains con- troversial. Many recent studies have demonstrated that women with T2DM are at greater risk for accelerated GFR decline in the absence of proteinuria [38,39] which is consistent with our study. Moreover, the UK Prospective Diabetes Study (UKPDS) and Swedish National Diabetes Register cohort have shown that women were at increased risk for developing renal insuffi- ciency while men were at increased risk for developing pro- gressive albuminuria among T2DM patients with preserved renal function and normoalbuminuria [2,40]. Although the mechanism of higher incidence of accelerated GFR decline in females is not clear, animal studies using insulin resistant ani-
mals also support these findings. Renal failure occurs earlier in female than in male animals in obese Zucker rats [41] and es- trogen has been associated with accelerated renal damage in female obese Zucker rats [42].
Only one-third of the patients who developed rapid renal function decline in our study had increased albuminuria at baseline; thus, 60% to 70% of patients who developed rapid re- nal function decline did not have increased albuminuria pre- ceding renal function decline. In a cross-sectional analysis of National Health and Nutrition Examination Survey III, one- third of patients with T2DM with DKD did not exhibit albu- minuria [3]. Similarly in the UKPDS, a prospective cohort study over 15 years, 51% of T2DM patients who developed re- nal impairment did not have preceding albuminuria [2]. Al- though albuminuria has traditionally been used as an indicator for development of DKD [4], recent evidences indicate that the presence of microalbuminuria may not always accompany re- nal structural abnormalities and does not always precede worsening of renal function [43]. It also has been recognized that the progression to microalbuminuria is not a unidirec- tional process but it may spontaneously regress to normoalbu- minuria [7]. Recently, extensive studies in Joslin Clinic have demonstrated that predominant clinical feature of DKD is progressive renal function decline, not progressive albumin- uria [7]. Progressive renal function decline is a unidirectional process that develops while patients have preserved renal func- tion, which sometimes precedes the onset of microalbumin- uria, and as it continues, it increases the risk of proteinuria.
In the current study, baseline HbA1c level predicted the de- velopment of rapid renal function decline in T2DM and pre- served renal function. Many evidences indicate that the risk of a rapid decline of glomerular function increases with higher HbA1c and hyperglycemia [44]. Similar finding was also noted in Atherosclerosis Risk in Communities (ARIC) study, where a positive association between HbA1c and CKD was observed in patients with T2DM, even in the absence of albuminuria [45]. In a prospective study in Taiwan, higher HbA1c at base- line was independently associated with rapid decline in eGFR [46].
The strength of this study includes the prospective design with ≥6 consecutive annual measurements of kidney function to accurately estimate annual eGFR decline. We confined the subjects to those with preserved renal function to assess pre- dictive role of CP in development of early rapid renal function decline, allowing us to find early detectable risk factors for the
development and progression of DKD. Also, our cohort con- sists of a large number of participants from a homogeneous population and the follow-up period was over 6 years. This is the first study to demonstrate association between CP at base- line and early rapid renal function decline in patients with T2DM and preserved baseline renal function.
The present study has some limitations. First, because our cohort comprises of Korean patients with T2DM who were followed at tertiary-level, university-affiliated hospitals, our re- sults may not represent general T2DM populations. Second, there was no direct measurement of GFR but we employed CKD-EPI equations, which have been widely used in many studies. It is established that eGFR at higher levels is associated with greater variability, which could lead to misclassification of hyperfiltration and normofiltration, and may bias our study results. However, we have measured serial values over time to identify the rate of decline in eGFR that was approximated us- ing linear slopes, and the use of such slopes likely smoothed out variability in individual GFR estimates and measurements.
Lastly, there may have been inter- and intra-observer variabili- ty in measurement of IMT as it was performed by multiple ob- servers. To minimize inter-observer variability, workshops were conducted for ultrasound observers from all participating institutions before initiation of the study and then annually thereafter during the entire study period.
In conclusion, our study demonstrated that the presence of CP, a marker of atherosclerosis, predicts rapid renal function decline in patients with T2DM and preserved renal function independent of established risk factors. Close monitoring of renal function and implementation of early intensive treat- ment are warranted in patients with T2DM and CP. The im- pact of atherosclerosis on rapid renal function decline needs to be further clarified in future studies.
SUPPLEMENTARY MATERIALS
Supplementary materials related to this article can be found online at https://doi.org/dmj.2018.0186.
CONFLICTS OF INTEREST
No potential conflict of interest relevant to this article was re- ported.
AUTHOR CONTRIBUTIONS
Conception or design: D.H.S., S.H.K.
Acquisition, analysis, or interpretation of data: D.H.S., S.H.K., Y.J.S.
Drafting the work or revising: D.H.S., S.H.K., J.H.S., S.H., S.
H.A., J.T.W., S.H.B., Y.P., K.W.L., Y.S.K.
Final approval of the manuscript: M.N.
ORCID
Da Hea Seo https://orcid.org/0000-0003-2767-0293 So Hun Kim https://orcid.org/0000-0002-2554-3664 Moonsuk Nam https://orcid.org/0000-0003-1756-8498
ACKNOWLEDGMENTS
This study was supported by the NRF (2017R1D-1A1B03034581), Republic of Korea and the Inha University Research Grant. There was no involvement of the funding source in the conduct of the research and/or preparation of the article.
REFERENCES
1. Martinez-Castelao A, Navarro-Gonzalez JF, Gorriz JL, de Al- varo F. The concept and the epidemiology of diabetic nephrop- athy have changed in recent years. J Clin Med 2015;4:1207-16.
2. Retnakaran R, Cull CA, Thorne KI, Adler AI, Holman RR;
UKPDS Study Group. Risk factors for renal dysfunction in type 2 diabetes: U.K. Prospective Diabetes Study 74. Diabetes 2006;55:1832-9.
3. Kramer HJ, Nguyen QD, Curhan G, Hsu CY. Renal insuffi- ciency in the absence of albuminuria and retinopathy among adults with type 2 diabetes mellitus. JAMA 2003;289:3273-7.
4. Mogensen CE, Christensen CK. Predicting diabetic nephropa- thy in insulin-dependent patients. N Engl J Med 1984;311:89- 93.
5. Perkins BA, Ficociello LH, Ostrander BE, Silva KH, Weinberg J, Warram JH, Krolewski AS. Microalbuminuria and the risk for early progressive renal function decline in type 1 diabetes. J Am Soc Nephrol 2007;18:1353-61.
6. Tsalamandris C, Allen TJ, Gilbert RE, Sinha A, Panagiotopou- los S, Cooper ME, Jerums G. Progressive decline in renal func- tion in diabetic patients with and without albuminuria. Diabe- tes 1994;43:649-55.
7. Krolewski AS. Progressive renal decline: the new paradigm of diabetic nephropathy in type 1 diabetes. Diabetes Care 2015;
38:954-62.
8. Pavkov ME, Knowler WC, Lemley KV, Mason CC, Myers BD, Nelson RG. Early renal function decline in type 2 diabetes. Clin J Am Soc Nephrol 2012;7:78-84.
9. Sheen YJ, Sheu WH. Risks of rapid decline renal function in patients with type 2 diabetes. World J Diabetes 2014;5:835-46.
10. Zoppini G, Targher G, Chonchol M, Ortalda V, Negri C, Stoico V, Bonora E. Predictors of estimated GFR decline in patients with type 2 diabetes and preserved kidney function. Clin J Am Soc Nephrol 2012;7:401-8.
11. Krolewski AS, Skupien J, Rossing P, Warram JH. Fast renal de- cline to end-stage renal disease: an unrecognized feature of ne- phropathy in diabetes. Kidney Int 2017;91:1300-11.
12. Chambless LE, Folsom AR, Clegg LX, Sharrett AR, Shahar E, Nieto FJ, Rosamond WD, Evans G. Carotid wall thickness is predictive of incident clinical stroke: the Atherosclerosis Risk in Communities (ARIC) study. Am J Epidemiol 2000;151:478- 87.
13. Culleton BF, Larson MG, Wilson PW, Evans JC, Parfrey PS, Levy D. Cardiovascular disease and mortality in a community- based cohort with mild renal insufficiency. Kidney Int 1999;56:
2214-9.
14. Ito H, Komatsu Y, Mifune M, Antoku S, Ishida H, Takeuchi Y, Togane M. The estimated GFR, but not the stage of diabetic nephropathy graded by the urinary albumin excretion, is asso- ciated with the carotid intima-media thickness in patients with type 2 diabetes mellitus: a cross-sectional study. Cardiovasc Diabetol 2010;9:18.
15. Takenouchi A, Tsuboi A, Kurata M, Fukuo K, Kazumi T. Ca- rotid intima-media thickness and visit-to-visit HbA1c variabil- ity predict progression of chronic kidney disease in type 2 dia- betic patients with preserved kidney function. J Diabetes Res 2016;2016:3295747.
16. Rhee SY, Chon S, Kwon MK, Park IeB, Ahn KJ, Kim IJ, Kim SH, Lee HW, Koh KS, Kim DM, Baik SH, Lee KW, Nam MS, Park YS, Woo JT, Kim YS. Prevalence of chronic complications in Korean patients with type 2 diabetes mellitus based on the Ko- rean national diabetes program. Diabetes Metab J 2011;35:504- 12.
17. Expert Committee on the Diagnosis and Classification of Dia- betes Mellitus. Report of the expert committee on the diagnosis and classification of diabetes mellitus. Diabetes Care 2003;26 Suppl 1:S5-20.
18. Targher G, Bertolini L, Zenari L, Lippi G, Pichiri I, Zoppini G, Muggeo M, Arcaro G. Diabetic retinopathy is associated with an increased incidence of cardiovascular events in type 2 dia- betic patients. Diabet Med 2008;25:45-50.
19. Friedewald WT, Levy RI, Fredrickson DS. Estimation of the concentration of low-density lipoprotein cholesterol in plasma, without use of the preparative ultracentrifuge. Clin Chem 1972;18:499-502.
20. Matthews DR, Hosker JP, Rudenski AS, Naylor BA, Treacher DF, Turner RC. Homeostasis model assessment: insulin resis- tance and beta-cell function from fasting plasma glucose and insulin concentrations in man. Diabetologia 1985;28:412-9.
21. Inker LA, Astor BC, Fox CH, Isakova T, Lash JP, Peralta CA, Kurella Tamura M, Feldman HI. KDOQI US commentary on the 2012 KDIGO clinical practice guideline for the evaluation and management of CKD. Am J Kidney Dis 2014;63:713-35.
22. Levey AS, Stevens LA, Schmid CH, Zhang YL, Castro AF 3rd, Feldman HI, Kusek JW, Eggers P, Van Lente F, Greene T, Coresh J; CKD-EPI (Chronic Kidney Disease Epidemiology Collaboration). A new equation to estimate glomerular filtra- tion rate. Ann Intern Med 2009;150:604-12.
23. Hong SB, Lee JJ, Kim SH, Suh YJ, Han JY, Kim YS, Nam M. The effects of adiponectin and inflammatory cytokines on diabetic vascular complications in obese and non-obese patients with type 2 diabetes mellitus. Diabetes Res Clin Pract 2016;111:58- 65.
24. Ebrahim S, Papacosta O, Whincup P, Wannamethee G, Walker M, Nicolaides AN, Dhanjil S, Griffin M, Belcaro G, Rumley A, Lowe GD. Carotid plaque, intima media thickness, cardiovas- cular risk factors, and prevalent cardiovascular disease in men and women: the British Regional Heart Study. Stroke 1999;30:
841-50.
25. Hanley JA, McNeil BJ. A method of comparing the areas under receiver operating characteristic curves derived from the same cases. Radiology 1983;148:839-43.
26. Inaba Y, Chen JA, Bergmann SR. Carotid plaque, compared with carotid intima-media thickness, more accurately predicts coronary artery disease events: a meta-analysis. Atherosclero- sis 2012;220:128-33.
27. Spence JD, Hegele RA. Noninvasive phenotypes of atheroscle- rosis: similar windows but different views. Stroke 2004;35:649- 53.
28. Kim SH, Kang ES, Hur KY, Lee HJ, Han SJ, Kwak JY, Nam CM, Ahn CW, Cha BS, Lee HC. Adiponectin gene polymorphism 45T>G is associated with carotid artery plaques in patients
with type 2 diabetes mellitus. Metabolism 2008;57:274-9.
29. Han L, Bai X, Lin H, Sun X, Chen XM. Lack of independent relationship between age-related kidney function decline and carotid intima-media thickness in a healthy Chinese popula- tion. Nephrol Dial Transplant 2010;25:1859-65.
30. Yamashita T, Makino H, Nakatani R, Ohata Y, Miyamoto Y, Kishimoto I. Renal insufficiency without albuminuria is asso- ciated with peripheral artery atherosclerosis and lipid metabo- lism disorders in patients with type 2 diabetes. J Atheroscler Thromb 2013;20:790-7.
31. Mazzucco G, Bertani T, Fortunato M, Bernardi M, Leutner M, Boldorini R, Monga G. Different patterns of renal damage in type 2 diabetes mellitus: a multicentric study on 393 biopsies.
Am J Kidney Dis 2002;39:713-20.
32. Ohta Y, Fujii K, Arima H, Matsumura K, Tsuchihashi T, Toku- moto M, Tsuruya K, Kanai H, Iwase M, Hirakata H, Iida M. In- creased renal resistive index in atherosclerosis and diabetic ne- phropathy assessed by Doppler sonography. J Hypertens 2005;
23:1905-11.
33. Ishimura E, Nishizawa Y, Kawagishi T, Okuno Y, Kogawa K, Fukumoto S, Maekawa K, Hosoi M, Inaba M, Emoto M, Morii H. Intrarenal hemodynamic abnormalities in diabetic ne- phropathy measured by duplex Doppler sonography. Kidney Int 1997;51:1920-7.
34. Qian Y, Feldman E, Pennathur S, Kretzler M, Brosius FC 3rd.
From fibrosis to sclerosis: mechanisms of glomerulosclerosis in diabetic nephropathy. Diabetes 2008;57:1439-45.
35. Lorenzo V, Saracho R, Zamora J, Rufino M, Torres A. Similar renal decline in diabetic and non-diabetic patients with com- parable levels of albuminuria. Nephrol Dial Transplant 2010;
25:835-41.
36. Yu MK, Lyles CR, Bent-Shaw LA, Young BA; Pathways Au- thors. Risk factor, age and sex differences in chronic kidney disease prevalence in a diabetic cohort: the pathways study.
Am J Nephrol 2012;36:245-51.
37. Vryonidou A, Paschou SA, Muscogiuri G, Orio F, Goulis DG.
Mechanisms in endocrinology: metabolic syndrome through the female life cycle. Eur J Endocrinol 2015;173:R153-63.
38. Porrini E, Ruggenenti P, Mogensen CE, Barlovic DP, Praga M, Cruzado JM, Hojs R, Abbate M, de Vries AP; ERA-EDTA dia- besity working group. Non-proteinuric pathways in loss of re- nal function in patients with type 2 diabetes. Lancet Diabetes Endocrinol 2015;3:382-91.
39. Dwyer JP, Parving HH, Hunsicker LG, Ravid M, Remuzzi G, Lewis JB. Renal dysfunction in the presence of normoalbumin- uria in type 2 diabetes: results from the DEMAND study. Car- diorenal Med 2012;2:1-10.
40. Afghahi H, Cederholm J, Eliasson B, Zethelius B, Gudbjorns- dottir S, Hadimeri H, Svensson MK. Risk factors for the devel- opment of albuminuria and renal impairment in type 2 diabe- tes: the Swedish National Diabetes Register (NDR). Nephrol Dial Transplant 2011;26:1236-43.
41. Johnson PR, Stern JS, Horwitz BA, Harris RE Jr, Greene SF.
Longevity in obese and lean male and female rats of the Zucker strain: prevention of hyperphagia. Am J Clin Nutr 1997;66:
890-903.
42. Gades MD, Stern JS, van Goor H, Nguyen D, Johnson PR, Kay- sen GA. Estrogen accelerates the development of renal disease in female obese Zucker rats. Kidney Int 1998;53:130-5.
43. Fioretto P, Mauer M, Brocco E, Velussi M, Frigato F, Muollo B, Sambataro M, Abaterusso C, Baggio B, Crepaldi G, Nosadini R. Patterns of renal injury in NIDDM patients with microalbu- minuria. Diabetologia 1996;39:1569-76.
44. Nosadini R, Tonolo G. Blood glucose and lipid control as risk factors in the progression of renal damage in type 2 diabetes. J Nephrol 2003;16 Suppl 7:S42-7.
45. Bash LD, Selvin E, Steffes M, Coresh J, Astor BC. Poor glyce- mic control in diabetes and the risk of incident chronic kidney disease even in the absence of albuminuria and retinopathy:
Atherosclerosis Risk in Communities (ARIC) Study. Arch In- tern Med 2008;168:2440-7.
46. Sheen YJ, Lin JL, Li TC, Bau CT, Sheu WH. Peripheral arterial stiffness is independently associated with a rapid decline in es- timated glomerular filtration rate in patients with type 2 diabe- tes. Biomed Res Int 2013;2013:309294.
Supplementary Table 1. Comparison of annual eGFR decline (%/year) according to various clinical parameters after adjust- ing for age
Parameter Annual eGFR decline, % P value Sex
Female –2.1±2.5 <0.001a
Male –0.4±2.4
Obesity/BMI, kg/m2
<25 –1.3±0.1 0.097
≥25 –1.0±0.1
Diabetes duration, yr
<10 –1.0±0.1 <0.001a
≥10 –1.8±0.2
HbA1c, %
<7 –0.7±0.1 <0.001a
≥7 –1.4±0.1
Hypertension
No –0.9±0.1 0.014a
Yes –1.4±0.1
CVD
No –1.1±0.1 0.269
Yes –1.4±0.3
Diabetic retinopathy
No –1.1±0.1 0.003a
Yes –1.8±0.2
Carotid plaque
No –0.9±0.1 <0.001a
Yes –1.6±0.1
Albuminuria
No –1.1±0.1 0.428
Yes –1.3±0.1
Use of ACEi/ARB
No –1.0±0.1 0.014a
Yes –1.5±0.2
Values are presented as mean±standard error of mean.
eGFR, estimated glomerular filtration rate; BMI, body mass index;
HbA1c, glycosylated hemoglobin; CVD, cardiovascular disease;
ACEi, angiotensin-converting-enzyme inhibitor; ARB, angiotensin II-receptor blocker.
aStatistical significance.
Supplementary Table 2. Baseline characteristics of participants stratified by menopause status in female Characteristic
Female Premenopause
(n=176, age <55 yr) Postmenopause
(n=236, age ≥55 yr) P value
Age, yr 47.4±5.8 62.5±5.3 <0.001a
Diabetes duration, yr 4.9±5.1 6.2±6.6 0.032a
BMI, kg/m2 25.3±3.4 25.8±3.5 0.175
WC, cm 85.1±8.5 87.7±8.5 0.002a
SBP, mm Hg 123.2±13.8 127.4±15.3 0.004a
DBP, mm Hg 78.7±9.3 77.5±9.3 0.187
Hypertension 63 (36.2) 136 (57.6) <0.001a
Dyslipidemia 52 (30.4) 89 (38.7) 0.107
CVD 11 (6.3) 35 (14.9) 0.010a
Diabetic retinopathy 28 (19.6) 38 (20.4) 0.959
Mean CIMT, mm 0.8±0.2 0.8±0.3 0.314
Carotid plaque (+) 32 (22.9) 88 (44.4) <0.001a
HbA1c, % 7.8±1.7 7.6±1.7 0.159
Fasting glucose, mg/dL 144.1±37.7 133.3±44.5 0.012a
PP2 glucose, mg/dL 269.4±82.2 266.9±87.5 0.811
HOMA-IR, units 3.1±2.5 3.1±4.4 0.913
hsCRP, mg/dL 1.3±2.2 2.8±14.1 0.310
TG, mg/dL 151.6±97.5 149.1±109.9 0.822
HDL-C, mg/dL 51.2±12.6 48.0±12.5 0.015a
LDL-C, mg/dL 111.2±35.4 104.3±36.0 0.070
UACR, mg/g 39.6±132.1 36.7±198.4 0.864
eGFR, mL/min/1.73 m2 101.9±14.8 90.6±12.7 <0.001a
Use of ACEi/ARB 28 (15.9) 65 (27.5) 0.007a
GFR slope, % –2.0±2.5 –2.2±2.5 0.444
Rapid decliners 35 (19.9) 68 (28.8) 0.051
Values are presented as mean±standard error of mean or number (%).
BMI, body mass index; WC, waist circumference; SBP, systolic blood pressure; DBP, diastolic blood pressure; CVD, cardiovascular disease;
CIMT, carotid intima-media thickness; HbA1c, glycosylated hemoglobin; PP2, 2-hour post prandial; HOMA-IR, homeostasis model assess- ment of insulin resistance; hsCRP, high-sensitivity C-reactive protein; TG, triglyceride; HDL-C, high density lipoprotein cholesterol; LDL-C, low density lipoprotein cholesterol; UACR, urinary albumin creatinine ratio; eGFR, estimated glomerular filtration rate; ACEi, angiotensin- converting-enzyme inhibitor; ARB, angiotensin II-receptor blocker; GFR, glomerular filtration rate.
aStatistical significance.
Supplementary Table 3. Clinical predictors for progression of rapid renal function decline in women according to menopause status
Variable Premenopause (n=176, age <55 yr) Postmenopause (n=236 age ≥55 yr)
OR (95% CI) P value OR (95% CI) P value
Carotid plaque 0.46 (0.12–1.76) 0.256 2.12 (1.06–4.25) 0.034a
Diabetes duration, yr 1.05 (0.96–1.15) 0.257 1.06 (1.01–1.12) 0.028a
HbA1c, % 1.08 (0.80–1.45) 0.623 1.08 (0.88–1.33) 0.451
CVD 20.47 (1.70–245.83) 0.017a 0.97 (0.37–2.52) 0.948
Hypertension 1.02 (0.37–2.85) 0.971 2.86 (1.35–6.07) 0.006a
Use of ACEi/ARB 0.13 (0.01–1.25) 0.078 0.73 (0.34–1.60) 0.433
OR, odds ratio; CI, confidence interval; HbA1c, glycosylated hemoglobin; CVD, cardiovascular disease; ACEi, angiotensin-converting-enzyme inhibitor; ARB, angiotensin II-receptor blocker.
aStatistical significance.