Decreased Renal Function Is an Independent Predictor of
Severity of Coronary Artery Disease: An Application of Gensini Score
Coronary artery disease (CAD) is the leading cause of death in patients with chronic kidney disease (CKD).Although many studies have shown a higher prevalence of CAD among these patients, the association between the spectrum of renal dysfunction and severity of CAD remains unclear. In this study, we investigate the association between renal function and the severity of CAD. We retrospectively reviewed the medical records of 1,192 patients who underwent elective coronary angiography (CAG). The severity of CAD was evaluated by Gensini score according to the degree of luminal narrowing and location(s) of
obstruction in the involved main coronary artery. In all patients, the estimated glomerular filtration rate (eGFR) was independently associated with Gensini score (β = -0.27, P < 0.001) in addition to diabetes mellitus (β = 0.07, P = 0.02), hypertension (β = 0.12, P < 0.001), low density lipoprotein (LDL)-cholesterol (β = 0.08, P = 0.003), and hemoglobin (β = -0.07, P = 0.03) after controlling for other confounding factors. The result of this study demonstrates that decreased renal function is associated not only with the prevalence, but also the severity, of CAD.
Key Words: Coronary Artery Disease; Kidney Failure, Chronic; Gensini Score; Glomerular Filtration Rate
Il Young Kim,1,2 In Hye Hwang,1,2 Kyung Nam Lee,1,2 Dong Won Lee,1,2 Soo Bong Lee,1,2 Min Ji Shin,1,3 Harin Rhee,1,3 ByeongYun Yang,1,3 Sang Heon Song,1,3 Eun Young Seong,1,3 and Ihm Soo Kwak1,3
1Department of Internal Medicine, Pusan National University School of Medicine, Yangsan; 2Research Institute for Convergence of Biomedical Science and Technology, Pusan National University Yangsan Hospital, Yangsan; 3Medical Research Institute, Pusan National University Hospital, Busan, Korea Received: 4 July 2013
Accepted: 5 September 2013 Address for Correspondence:
Soo Bong Lee, MD
Division of Nephrology, Department of Internal Medicine, Pusan National University Yangsan Hospital, 20 Geumo-ro, Yangsan 626-770, Korea
Tel: +82.55-360-2371, Fax: +82.55-360-1605 E-mail: [email protected]
This work was supported by a 2-Year Research Grant from Pusan National University.
http://dx.doi.org/10.3346/jkms.2013.28.11.1615 • J Korean Med Sci 2013; 28: 1615-1621
INTRODUCTION
Chronic kidney disease (CKD) has been a serious health prob
lem with poor patient outcomes and high health care costs (1).
Among patients with CKD, cardiovascular disease (CVD) is a leading cause of death, and it is well known that renal dysfunc
tion, even mild degrees of impairment (2), is associated with in
creased cardiovascular morbidity and mortality (3, 4). This is a trend which is also observed with coronary artery disease (CAD) (5, 6).
To better understand the adverse effect of impaired renal func
tion on CAD, several studies have assessed the association be
tween CKD and the severity of CAD. In one study by Nicholls et al. (7), total atheroma volume and percent atheroma volume did not differ between patients with and without CKD. This find
ing suggested that the increased incidence of cardiovascular events among patients with impaired renal function might re
sult from causes other than atherosclerotic burden. Others (8
12) have demonstrated that impaired renal function was inde
pendently associated with angiographic severity of CAD. In these
studies, the severity of CAD was stratified only by the number of stenotic coronary arteries and did not account for the impor
tance of either the location or severity of the stenosis. Thus, it is possible that the severity of CAD was not appropriately strati
fied in those studies.
In this study, we have evaluated the association between re
nal impairment and the severity of CAD. To assess the severity of CAD in a more relevant manner, Gensini score (13) was used to reflect the degree of total coronary atherosclerosis burden.
MATERIALS AND METHODS Study population
The medical record of 1,192 patients who visited coronary angi
ography (CAG) center at Pusan National University Yangsan Hospital, from January 2009 to May 2011, were retrospectively reviewed in this crosssectional study. Only the patients who underwent elective CAG, not emergency CAG, for the first time were included. Patients with a history of coronary revascular
ization, congenital heart disease, cardiomyopathy, and mainte
nance dialysis treatment were excluded.
Data collection
Demographic and clinical data on age, gender, smoking habit, diabetes mellitus (DM), and hypertension were obtained via review of electronic medical record. Blood pressure was mea
sured in the right upper arm of patients in a sedentary position using mercury sphygmomanometer by trained technicians.
Body mass index (BMI) was measured by weight and height of patient and expressed as kg/m2. All blood examination including total cholesterol, triglycerides, high density lipoprotein (HDL) cholesterol, low density lipoprotein (LDL) cholesterol, fasting blood glucose (FBG), creatinine, albumin, uric acid, calcium, phosphate, hemoglobin and Creactive (CRP) was measured after an overnight fast of at least 12 hr. Serum creatinine was measured by enzymatic method. DM was defined as 1) use of diabetes medication, 2) FBG of more than 126 mg/dL. Hyper
tension was defined as 1) use of hypertension medication, 2) systolic blood pressure > 140 mmHg or diastolic blood pressure
> 90 mmHg. Estimated glomerular filtration rate (eGFR) was measured by Modification of Diet in Renal Disease (MDRD) equation (14): eGFR (mL/min/1.73 m2) = 186 × sCr1.154× age0.203
× 0.742 (if female).
Depending on the eGFR value, each patient was classified into one of the 4 CKD groups according to the National Kidney Foundation Kidney Disease Outcome Quality Initiative (NKF KDOQI) Clinical Practice Guidelines (15): NonCKD group (n = 684), eGFR ≥ 60 mL/min/1.73 m2; CKD stage 3 (n = 421), 30 ≤ eGFR < 60 mL/min/1.73 m2; CKD stage 4 (n = 61), 15 ≤ eGFR <
30 mL/min/1.73 m2; CKD stage 5 (n = 26), eGFR < 15 mL/min/
1.73 m2. NonCKD group was defined as eGFR ≥ 60 mL/min/
1.73 m2 simply according to eGFR. CKD stage 1 and stage 2 were not considered.
In this study, dialysisdependent patients were not included in the CKD stage 5 group. To exclude acute kidney injury and identify the presence of CKD, we only included patients 1) whose previous serum creatinine level before CAG was known via me
dical record or 2) who were followed for at least 3 months after CAG.
Coronary angiography
All of the patients in this study underwent elective CAG, as this was the inclusion criteria. The result of CAG was analyzed by a group of three experienced cardiologists. A case of CAD was defined as significant if one or more main coronary artery had a lumen narrowing equal to greater than 50%. The severity of CAD was evaluated by the Gensini score (13). The points were assigned according to the percentage of luminal narrowing: 1 point for 1%25% occlusion, 2 for 26%50%, 4 for 51%75%, 8 for 76%90%, 16 for 91%99%, and 32 points for a complete occlu
sion. Each of these points are compounded by multiplications
factors accounting for the differences in the location of obstruc
tion, such as 5 for left main artery, 2.5 for proximal left anterior descending and left circumflex arteries, and 1 for proximal right coronary artery. Finally, the total Gensini score for each patient was expressed as the sum total score of each CAD lesion.
Statistical analysis
Continuous variables were expressed as mean ± SD, while cat
egorical variables were presented as numbers and percentages.
Differences among groups were tested with oneway ANOVA for continuous variables and with chisquare test for categorical variables. The differences in Gensini score were further analyz
ed by GamesHowell type multiple comparisons. The associa
tion between various variables and the presence of significant CAD was analyzed by univariate and multivariate logistic re
gression models. The association between variables and Gensi
ni score was analyzed by Pearson’s correlation and multivariate linear regression model. All associations of P < 0.10 from uni
variate analyses were entered into multivariate logistic and lin
ear regression analysis. A value of P < 0.05 was considered sta
tistically significant. All analyses were performed using the SPSS 17.0 statistical package (SPSS Inc., Chicago, IL, USA).
Ethics statement
The study protocol was approved by the institutional review board of Pusan National University Yangsan Hospital (IRB No.
052013023). Informed consent was waived by the board.
RESULTS
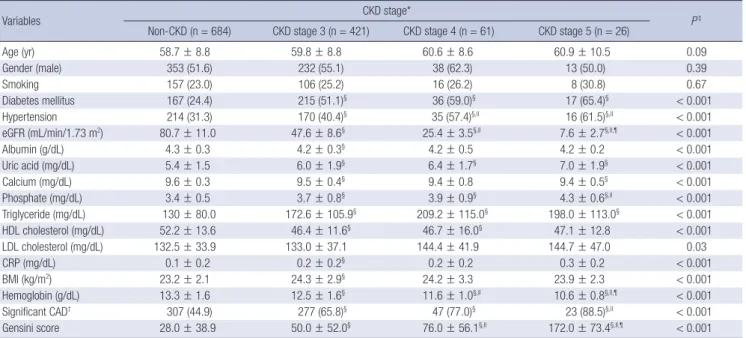
Baseline characteristics of the study population are summariz
ed in Table 1. Of the 1,192 total, 684 patients (57.4%) were in NonCKD group, 421 (35.3%) in CKD stage 3, 61 (5.1%) in CKD stage 4, and 26 (2.2%) in CKD stage 5. Mean eGFR (mL/min/
1.73 m2) was 80.7 ± 11.0 for the NonCKD group, 47.6 ± 8.6 in CKD stage 3, 25.4 ± 3.5 in CKD stage 4, and 7.6 ± 2.7 in CKD stage 5 group. Age, male gender, and smoking status were simi
lar across the 4 groups. Prevalence of DM and hypertension;
levels of serum albumin, uric acid, calcium, phosphate, triglyc
eride, HDL cholesterol, LDL cholesterol (P = 0.03), CRP, and hemoglobin; and BMI were significantly different across the groups (P < 0.001, except as otherwise noted for LDL cholester
ol). Prevalence of significant CAD was significantly different:
44.9% in NonCKD, 65.8% in CKD stage 3, 77.0% in CKD stage 4, and 88.5% in CKD stage 5 (P < 0.001). The Gensini score show
ed a positive correlation to increasing stages of CKD in all pa
tients (n = 1,192), patients with DM (n = 456), patients with hy
pertension (n = 441), and patients without DM and hyperten
sion (n = 526) (Fig. 1). In all patients (Fig. 1A) and patients with
out DM and hypertension (Fig. 1D), Gensini score was the high
est among the patients in CKD stage 5 group, and the differenc
Table 1. Baseline characteristics of study population by CKD stage
Variables CKD stage*
P‡ Non-CKD (n = 684) CKD stage 3 (n = 421) CKD stage 4 (n = 61) CKD stage 5 (n = 26)
Age (yr) 58.7 ± 8.8 59.8 ± 8.8 60.6 ± 8.6 60.9 ± 10.5 0.09
Gender (male) 353 (51.6) 232 (55.1) 38 (62.3) 13 (50.0) 0.39
Smoking 157 (23.0) 106 (25.2) 16 (26.2) 8 (30.8) 0.67
Diabetes mellitus 167 (24.4) 215 (51.1)§ 36 (59.0)§ 17 (65.4)§ < 0.001
Hypertension 214 (31.3) 170 (40.4)§ 35 (57.4)§,II 16 (61.5)§,II < 0.001
eGFR (mL/min/1.73 m2) 80.7 ± 11.0 47.6 ± 8.6§ 25.4 ± 3.5§,II 7.6 ± 2.7§,ll,¶ < 0.001
Albumin (g/dL) 4.3 ± 0.3 4.2 ± 0.3§ 4.2 ± 0.5 4.2 ± 0.2 < 0.001
Uric acid (mg/dL) 5.4 ± 1.5 6.0 ± 1.9§ 6.4 ± 1.7§ 7.0 ± 1.9§ < 0.001
Calcium (mg/dL) 9.6 ± 0.3 9.5 ± 0.4§ 9.4 ± 0.8 9.4 ± 0.5§ < 0.001
Phosphate (mg/dL) 3.4 ± 0.5 3.7 ± 0.8§ 3.9 ± 0.9§ 4.3 ± 0.6§,II < 0.001
Triglyceride (mg/dL) 130 ± 80.0 172.6 ± 105.9§ 209.2 ± 115.0§ 198.0 ± 113.0§ < 0.001
HDL cholesterol (mg/dL) 52.2 ± 13.6 46.4 ± 11.6§ 46.7 ± 16.0§ 47.1 ± 12.8 < 0.001
LDL cholesterol (mg/dL) 132.5 ± 33.9 133.0 ± 37.1 144.4 ± 41.9 144.7 ± 47.0 0.03
CRP (mg/dL) 0.1 ± 0.2 0.2 ± 0.2§ 0.2 ± 0.2 0.3 ± 0.2 < 0.001
BMI (kg/m2) 23.2 ± 2.1 24.3 ± 2.9§ 24.2 ± 3.3 23.9 ± 2.3 < 0.001
Hemoglobin (g/dL) 13.3 ± 1.6 12.5 ± 1.6§ 11.6 ± 1.0§,II 10.6 ± 0.8§,ll,¶ < 0.001
Significant CAD† 307 (44.9) 277 (65.8)§ 47 (77.0)§ 23 (88.5)§,ll < 0.001
Gensini score 28.0 ± 38.9 50.0 ± 52.0§ 76.0 ± 56.1§,II 172.0 ± 73.4§,ll,¶ < 0.001
Data are presented as mean ± SD, or number (%). *CKD stage groups were categorized as Non-CKD (eGFR ≥ 60 mL/min/1.73 m2), CKD stage 3 (30 ≤ eGFR < 60 mL/min/
1.73 m2), CKD stage 4 (15 ≤ eGFR < 30 mL/min/1.73 m2), and CKD stage 5 (eGFR < 15 mL/min/1.73 m2); †Significant CAD was defined as a stenosis of 50% or greater in at least one of the main coronary arteries; ‡P represents difference across the CKD group; §P < 0.05 vs Non-CKD; IIP < 0.05 vs CKD stage 3; ¶P < 0.05 vs CKD stage 4. BMI, body mass index; CAD, coronary artery disease; CKD, chronic kidney disease; CRP, C-reactive protein; eGFR, estimated glomerular filtration rate; HDL, high density lipoprotein; LDL, low density lipoprotein.
es in Gensini scores were significant in NonCKD vs CKD stage 3, CKD stage 3 vs CKD stage 4, and in CKD stage 4 vs CKD stage 5 (P < 0.05). In patients with DM (Fig. 1B) and Hypertension (Fig. 1C), Gensini score showed significant differences in Non
CKD vs CKD stage 3 and CKD stage 4 vs CKD stage 5 except CKD stage 3 vs CKD stage 4.
Table 2 and Table 3 show which variables were associated with the presence of significant CAD. In univariate logistic re
gression analysis (Table 2), age, male gender, DM, hypertension, CKD stage, uric acid, calcium, triglyceride, HDL cholesterol, LDL cholesterol, CRP, and hemoglobin were associated with the presence of significant CAD. In multivariate logistic regres
sion analysis (Table 3), age, DM, hypertension, and LDL cho
lesterol, and CKD stage was independently associated with the presence of significant CAD. Patients from CKD stage 3, CKD stage 4, and CKD stage 5 groups were 1.80 (95% confidence in
terval [CI], 1.34 2.40, P < 0.001), 2.47 (95% CI, 1.264.83, P = 0.008), and 5.07 (95% CI, 1.4218.15, P = 0.01) times more likely to have significant CAD compared with those patients from the non
CKD group.
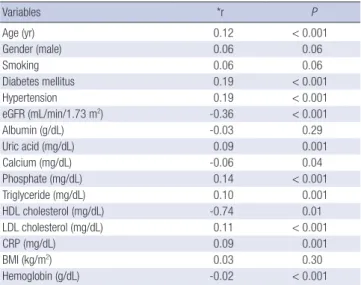
Table 4 and Table 5 present the association of variables with Gensini score in all patients. In univariate analysis (Table 4), age, DM, hypertension, eGFR, uric acid, calcium, phosphate, triglyceride, HDL cholesterol, LDL cholesterol, CRP, and hemo
globin correlated with Gensini score. In multivariate linear re
gression analysis (Table 5), eGFR was independently associated with Gensini score (β = 0.27, P < 0.001), in addition to DM (β =
0.07, P = 0.02), hypertension (β = 0.12, P < 0.001), LDL choles
terol (β = 0.08, P < 0.003), and hemoglobin (β = 0.07, P = 0.03).
DISCUSSION
The current study demonstrates an association between renal dysfunction and the severity of CAD. First, a patient’s CKD stage was an independent predictor for the presence of a significant CAD after controlling for confounding factors, including tradi
tional CVD risk factors. Patients with respective CKD stages of 3, 4, and 5 were 1.80, 2.47, and 5.07 times more likely to have sig
nificant CAD when compared to those patients who did not have chronic kidney disease. Second, eGFR was independently associated with severity of CAD quantified by Gensini score af
ter adjustment for traditional CVD risk factors.
The associations between kidney function and CAD in this study are consistent with the findings from several previous stu
dies. Davoodi et al. (8) recently showed that patients with re
duced kidney function be at a 1.1 (at 60 ≤ GFR < 90 mL/min/
1.73 m2) to 1.8 (at 15 < GFR < 45 mL/min/1.73 m2) fold risk of significant CAD (at least one major coronary artery with lumi
nal narrowing ≥ 50%) than subjects with a normal renal func
tion. Yagi et al. (9) demonstrated that CKD (GFR < 60 mL/min/
1.73 m2) was associated with a 2.9 fold risk of having multives
sel coronary artery disease (two or three of major coronary ar
tery with luminal narrowing ≥ 75%). Khalique et al. (10) found that patients with decreased GFR (GFR < 60 mL/min/1.73 m2)
Fig. 1. Comparison of Gensini score across the CKD groups in all patients (n = 1,192) (A), patients with DM (n = 456) (B), patients with hypertension (n = 441) (C), and patients without DM and hypertension (n = 526) (D) by ANOVA. *P < 0.05 vs non-CKD; †P < 0.05 vs CKD stage 3; ‡P < 0.05 vs CKD stage 4 by Games-Howell type multiple comparison.
Mean gensini score
CKD stage
Non-CKD CKD stage 3 CKD stage 4 CKD stage 5 250
200 150 100 50 0
All patients
P < 0.001 by ANOVA *, †, ‡
*, †
*
A
Mean gensini score
CKD stage
Non-CKD CKD stage 3 CKD stage 4 CKD stage 5 250
200 150 100 50 0
Patients with DM
P < 0.001 by ANOVA *, †, ‡
*
*
B
Mean gensini score
CKD stage
Non-CKD CKD stage 3 CKD stage 4 CKD stage 5 250
200 150 100 50 0
Patients with hypertension
P < 0.001 by ANOVA *, †, ‡
*
*
C
Mean gensini score
CKD stage
Non-CKD CKD stage 3 CKD stage 4 CKD stage 5 250
200 150 100 50 0
Patients without DM and hypertension
P < 0.001 by ANOVA *, †, ‡
*, †
*
D
were 4.1 times more likely to develop 3vessel CAD (3 major coronary arteries with luminal narrowing ≥ 50%) than those who had normal GFR. Chonchol et al. (11) showed that patients with CKD (GFR < 60 mL/min/1.73 m2) had a 3.2 fold higher risk of having significant CAD (at least one major coronary ar
tery with luminal narrowing ≥ 70%). Reis et al. (12) reported that mild renal insufficiency (serum creatinine 1.21.9 mg/dL) was associated with 1.9 times the risk of presence of significant angiographic CAD (at least one major coronary artery with lu
minal narrowing ≥ 50%) in women.
All of the studies above (812) have examined the relation
ship between CKD and CAD using the presence/absence of significant CAD (at least 1 stenotic coronary artery with ≥ 50%
75% reduction in diameter) or by the number of significantly obstructed coronary artery. All of these studies share the limita
tion arising from ignoring the importance of coronary artery anatomy.
The Gensini score system (13) used in this study is a method that attempts to quantify the overall coronary atherosclerosis
burden using a severity score influenced by the degree of lumi
nal narrowing and by the location(s) of CAD. Gensini score is preferable to other scoring system because it takes into consid
eration not only the product of number of lesions with their re
spective degrees of stenosis, but also the functional significance of lesions in terms of the area of myocardium at stake (13, 16, 17). Coskun et al. (18) showed eGFR to be associated with high
er SYNTAX score (19), the latter of which is another scoring sys
tem developed to approximate the CAD burden by the number of lesions, complexity of each CAD lesion, and the functional impact. Whereas Gensini score stratifies each CAD lesion into six groups (stenoses ≤ 25%, ≤ 50%, ≤ 75%, ≤ 90%, 99%, or 100%), SYNTAX score treats each CAD lesion mostly in a trimodal dis
tribution as in stenosis ≤ 50%, > 50%, or complete occlusion.
In addition to the lessthanideal stratification of SYNTAX score, the study was limited to patients with left main coronary artery and/or 3vessel involvement and cannot be generalized to the overall CKD population. Yan et al. (20) also demonstrated that the eGFR was independently associated with the SYNTAX score.
Table 2. Univariate logistic regression analysis for variables associated with the pres- ence of significant coronary artery disease*
Variables Odds ratio (95% CI) P
Age (per 1 yr increase) 1.04 (1.03-1.05) < 0.001
Male gender (vs female) 1.28 (1.02-1.61) 0.04
Smoking (vs no smoking) 1.22 (0.93-1.59) 0.15
Diabetes mellitus (vs no diabetes mellitus) 2.50 (1.95-3.19) < 0.001 Hypertension (vs no hypertension) 2.01 (1.58-2.56) < 0.001 CKD stage
Non- CKD (eGFR ≥ 60 mL/min/1.73 m2) Stage 3 (30 ≤ eGFR < 60 mL/min/1.73 m2) Stage 4 (15 ≤ eGFR < 30 mL/min/1.73 m2) Stage 5 (eGFR < 15 mL/min/1.73 m2)
1 2.36 (1.84-3.04) 4.12 (2.23-7.69) 9.42 (2.80-31.65)
< 0.001
< 0.001
< 0.001 Albumin (per 1 g/dL increase) 1.03 (0.70-1.53) 0.88 Uric acid (per 1 mg/dL increase) 1.10 (1.03-1.18) 0.007 Calcium (per 1 mg/dL increase) 0.72 (0.55-0.96) 0.03 Phosphate (per 1 mg/dL increase) 1.14 (0.97-1.35) 0.12 Triglyceride (per 1 mg/dL increase) 1.00 (1.00-1.00) 0.001 HDL cholesterol (per 1 mg/dL increase) 0.99 (0.98-1.00) 0.003 LDL cholesterol (per 1 mg/dL increase) 1.00 (1.00-1.00) 0.005 CRP (per 1 mg/dL increase) 2.49 (1.35-5.57) 0.003 BMI (per 1 kg/m2 increase) 1.02 (0.98-1.07) 0.40 Hemoglobin (per 1 g/dL increase) 0.85 (0.80-0.92) < 0.001
*Significant CAD was defined as a stenosis of 50% or greater in at least one of the main coronary arteries. BMI, body mass index; CI, confidence interval; CKD, chronic kidney disease; CRP, C-reactive protein; eGFR, estimated glomerular filtration rate;
HDL, high density lipoprotein; LDL, low density lipoprotein.
Table 3. Multivariate logistic regression analysis for variables associated with the presence of significant coronary artery disease*
Variables Odds ratio (95% CI) P
Age (per 1 yr increase) 1.03 (1.02-1.05) < 0.001 Diabetes mellitus (vs no diabetes mellitus) 1.82 (1.40-2.38) < 0.001 Hypertension (vs no hypertension) 1.53 (1.18-1.99) 0.002 CKD stage
Non-CKD (eGFR ≥ 60 mL/min/1.73 m2) Stage 3 (30 ≤ eGFR < 60 mL/min/1.73 m2) Stage 4 (15 ≤ eGFR < 30 mL/min/1.73 m2) Stage 5 (eGFR < 15 mL/min/1.73 m2)
1 1.80 (1.34-2.40) 2.47 (1.26-4.83) 5.07 (1.42-18.15)
< 0.001 0.008 0.01 LDL cholesterol (per 1 mg/dL increase) 1.00 (1.00-1.00) 0.005
*Significant CAD was defined as a stenosis of 50% or greater in at least one of the main coronary arteries. Other variables which did not show statistical significance were not in table, including gender, uric acid, calcium, triglyceride, HDL-cholesterol, CRP, and hemoglobin. CI, confidence interval; CKD, chronic kidney disease; eGFR, estimated glomerular filtration rate; LDL, low density lipoprotein.
Table 4. Correlation analysis for variables associated with Gensini score
Variables *r P
Age (yr) 0.12 < 0.001
Gender (male) 0.06 0.06
Smoking 0.06 0.06
Diabetes mellitus 0.19 < 0.001
Hypertension 0.19 < 0.001
eGFR (mL/min/1.73 m2) -0.36 < 0.001
Albumin (g/dL) -0.03 0.29
Uric acid (mg/dL) 0.09 0.001
Calcium (mg/dL) -0.06 0.04
Phosphate (mg/dL) 0.14 < 0.001
Triglyceride (mg/dL) 0.10 0.001
HDL cholesterol (mg/dL) -0.74 0.01
LDL cholesterol (mg/dL) 0.11 < 0.001
CRP (mg/dL) 0.09 0.001
BMI (kg/m2) 0.03 0.30
Hemoglobin (g/dL) -0.02 < 0.001
*r means Pearson’s correlation coefficients. BMI, body mass index; CRP, C-reactive protein; eGFR, estimated glomerular filtration rate; HDL, high density lipoprotein; LDL, low density lipoprotein.
Table 5. Multiple linear regression analysis for variables associated with Gensini score
Variables β* P
Diabetes mellitus 0.07 0.02
Hypertension 0.12 < 0.001
eGFR -0.27 < 0.001
LDL-cholesterol (mg/dL) 0.08 0.003
Hemoglobin (g/dL) -0.07 0.03
*β means standardized regression coefficients. Other variables which did not show statistical significance were not included in this table, including age, gender, smok- ing, uric acid, calcium, phosphate, triglyceride, HDL-cholesterol, and CRP. eGFR, esti- mated glomerular filtration rate; LDL, low density lipoprotein.
However, their study was limited by the lessthanideal stratifi
cation of SYNTAX score and the association between SYNTAX score and eGFR < 30 mL/min/1.73 m2 was not examined. Aba
ci et al. (21) did use the Gensini score system to study the rela
tionship between CKD and CAD, and found GFR to be an inde
pendent predictor of the severity of CAD (r = 0.35, P < 0.001).
However, the subjects in that study were limited to patients with DM and, again, could not be generalized to all CKD patients.
Cay et al. (22) also showed the independent association between GFR and Gensini score. Nevertheless, their study was limited by the small sample size. They only included 43 patients with decreased renal function and 49 patients without impaired re
nal function. Finally, Duran et al. (23) reported that the eGFR was an independent risk factor for SYNTAX and Gensini scores.
However, their study did not include patients with CKD stage 4 and 5.
How impaired renal function is closely associated with CAD remains unclear. Although this relationship could be explained by the higher prevalence of traditional CVD risk factors among CKD patients, nontraditional risk factors associated with ure
mia, secondary to progressive deterioration of renal function, have been proposed as a possible mechanism. These explana
tions include oxidative stress, inflammation, elevated calcium
phosphate product, secondary hyperparathyroidism, anemia, hyperhomocysteinemia, and neurohormonal factors such as activation of reninangiotensinaldosterone and the sympa
thetic nervous system (2427). Thus, the association between renal function and the severity of CAD might reflect a clinical phenotype for the recent idea embodied by the term “cardiore
nal syndrome” (28).
Our own study has several limitations. First, selection bias could not be avoided as with all studies of retrospective nature.
This study enrolled patients who underwent elective CAG be
cause of chest pain or discomfort and did not include those who underwent emergency CAG or asymptomatic patients with CAD.
In clinical practice, attending cardiologists tend to refrain from CAG in patients with decreased renal function due to the risk of contrast induced nephropathy, and therefore, the patients in this study may not represent the overall CKD population. Thus, it is unclear if the results of this study can be extrapolated to ev
ery patient with CKD. Second, the assessment of CAG was lim
ited to visual interpretation and might present inter and intra
observer variability. Third, this study did not include assessment about medication history, which might affect the degree of CAD severity.
In conclusion, this present study reveals eGFR is indepen
dently associated with the severity of CAD, quantified by Gen
sini score, even after controlling traditional CVD risk factors.
When compared with similar studies, the result of this study is unique in quantifying the overall atherosclerosis burden by the use of Gensini score in the CKD population. Although an inde
pendent association between renal function and the severity of CAD was demonstrated in this study, whether Gensini score has a prognostic power to predict adverse clinical outcomes, such as CAD related mortality, in patients with impaired renal function was not known. Further largescale prospective study is needed in order to evaluate Gensini score as a predictor CAD
related mortality in the CKD population.
DISCLOSURE
The authors have no conflicts of interest to disclose.
REFERENCES
1. Eknoyan G, Lameire N, Barsoum R, Eckardt KU, Levin A, Levin N, Lo
catelli F, MacLeod A, Vanholder R, Walker R, et al. The burden of kidney disease: improving global outcomes. Kidney Int 2004; 66: 1310-4.
2. Henry RM, Kostense PJ, Bos G, Dekker JM, Nijpels G, Heine RJ, Bouter LM, Stehouwer CD. Mild renal insufficiency is associated with increased cardiovascular mortality: the Hoorn Study. Kidney Int 2002; 62: 1402-7.
3. Go AS, Chertow GM, Fan D, McCulloch CE, Hsu CY. Chronic kidney disease and the risks of death, cardiovascular events, and hospitaliza- tion. N Engl J Med 2004; 351: 1296-305.
4. Muntner P, He J, Hamm L, Loria C, Whelton PK. Renal insufficiency and subsequent death resulting from cardiovascular disease in the Unit- ed States. J Am Soc Nephrol 2002; 13: 745-53.
5. Tonelli M, Jose P, Curhan G, Sacks F, Braunwald E, Pfeffer M; Choles
terol and Recurrent Events (CARE) Trial Investigators. Proteinuria, im- paired kidney function, and adverse outcomes in people with coronary disease: analysis of a previously conducted randomised trial. BMJ 2006;
332: 1426.
6. Best PJ, Lennon R, Ting HH, Bell MR, Rihal CS, Holmes DR, Berger PB.
The impact of renal insufficiency on clinical outcomes in patients under-
going percutaneous coronary interventions. J Am Coll Cardiol 2002; 39:
1113-9.
7. Nicholls SJ, Tuzcu EM, Hsu A, Wolski K, Sipahi I, Schoenhagen P, Crowe T, Kapadia SR, Hazen SL, Nissen SE. Comparison of coronary athero- sclerotic volume in patients with glomerular filtration rates < or = 60 versus > 60 ml/min/1.73 m(2): a meta-analysis of intravascular ultra- sound studies. Am J Cardiol 2007; 99: 813-6.
8. Davoodi G, Mehrabi Pari S, Rezvanfard M, Sheikh Fathollahi M, Amini M, Hakki E, Kazemisaeid A, Yaminisharif A. Glomerular filtration rate is related to severity of obstructive coronary artery disease in patients undergoing coronary angiography. Int Urol Nephrol 2012; 44: 1161-8.
9. Yagi H, Kawai M, Komukai K, Ogawa T, Minai K, Nagoshi T, Ogawa K, Sekiyama H, Taniguchi I, Yoshimura M. Impact of chronic kidney dis- ease on the severity of initially diagnosed coronary artery disease and the patient prognosis in the Japanese population. Heart Vessels 2011; 26:
370-8.
10. Khalique O, Aronow WS, Ahn C, Mazar M, Schair B, Shao J, Channam
setty V. Relation of moderate or severe reduction in glomerular filtration rate to number of coronary arteries narrowed > 50% in patients under- going coronary angiography for suspected coronary artery disease. Am J Cardiol 2007; 100: 415-6.
11. Chonchol M, Whittle J, Desbien A, Orner MB, Petersen LA, Kressin NR.
Chronic kidney disease is associated with angiographic coronary artery disease. Am J Nephrol 2008; 28: 354-60.
12. Reis SE, Olson MB, Fried L, Reeser V, Mankad S, Pepine CJ, Kerensky R, Merz CN, Sharaf BL, Sopko G, et al. Mild renal insufficiency is associat- ed with angiographic coronary artery disease in women. Circulation 2002; 105: 2826-9.
13. Gensini GG. A more meaningful scoring system for determining the se- verity of coronary heart disease. Am J Cardiol 1983; 51: 606.
14. Levey AS, Bosch JP, Lewis JB, Greene T, Rogers N, Roth D. A more accu- rate method to estimate glomerular filtration rate from serum creatinine:
a new prediction equation: Modification of Diet in Renal Disease Study Group. Ann Intern Med 1999; 130: 461-70.
15. National Kidney Foundation. K/DOQI clinical practice guidelines for chronic kidney disease: evaluation, classification, and stratification. Am J Kidney Dis 2002; 39: S1-266.
16. DePace NL, Hakki AH, Weinreich DJ, Iskandrian AS. Noninvasive as- sessment of coronary artery disease. Am J Cardiol 1983; 52: 714-20.
17. Masood A, Jafar SS, Akram Z. Serum high sensitivity C-reactive protein levels and the severity of coronary atherosclerosis assessed by angiograph- ic gensini score. J Pak Med Assoc 2011; 61: 325-7.
18. Coskun U, Orta Kilickesmez K, Abaci O, Kocas C, Bostan C, Yildiz A, Baskurt M, Arat A, Ersanli M, Gurmen T. The relationship between chron- ic kidney disease and SYNTAX score. Angiology 2011; 62: 504-8.
19. Sianos G, Morel MA, Kappetein AP, Morice MC, Colombo A, Dawkins K, van den Brand M, Van Dyck N, Russell ME, Mohr FW, et al. The SYN- TAX score: an angiographic tool grading the complexity of coronary ar- tery disease. EuroIntervention 2005; 1: 219-27.
20. Yan LQ, Guo LJ, Zhang FC, Gao W. The relationship between kidney function and angiographically-derived SYNTAX score. Can J Cardiol 2011; 27: 768-72.
21. Abaci A, Sen N, Yazici H, Tulmac M, Türkoglu S, Tavil Y, Yalcin R. Renal dysfunction is the most important predictor of the extent and severity of coronary artery disease in patients with diabetes mellitus. Coron Artery
Dis 2007; 18: 463-9.
22. Cay S, Metin F, Korkmaz S. Association of renal functional impairment and the severity of coronary artery disease. Anadolu Kardiyol Derg 2007;
7: 44-8.
23. Duran M, Uysal OK, Gunebakmaz O, Baran O, Turfan M, Ornek E, Cetin M, Murat SN, Yarlioglues M, Karadeniz M, et al. Glomerular filtration rate is associated with burden of coronary atherosclerosis in patients with acute coronary syndrome. Angiology 2013. doi: 10.1177/0003319713486536.
24. Best PJ, Reddan DN, Berger PB, Szczech LA, McCullough PA, Califf RM.
Cardiovascular disease and chronic kidney disease: insights and an up- date. Am Heart J 2004; 148: 230-42.
25. Schlaich MP, Socratous F, Hennebry S, Eikelis N, Lambert EA, Straznicky N, Esler MD, Lambert GW. Sympathetic activation in chronic renal fail-
ure. J Am Soc Nephrol 2009; 20: 933-9.
26. Zebrack JS, Anderson JL, Beddhu S, Horne BD, Bair TL, Cheung A, Mu
hlestein JB; Intermountain Heart Collaborative Study Group. Do asso- ciations with C-reactive protein and extent of coronary artery disease account for the increased cardiovascular risk of renal insufficiency? J Am Coll Cardiol 2003; 42: 57-63.
27. Zoccali C. Cardiorenal risk as a new frontier of nephrology: research needs and areas for intervention. Nephrol Dial Transplant 2002; 17: 50-4.
28. Ronco C, McCullough P, Anker SD, Anand I, Aspromonte N, Bagshaw SM, Bellomo R, Berl T, Bobek I, Cruz DN, et al. Cardio-renal syndromes:
report from the consensus conference of the acute dialysis quality initia- tive. Eur Heart J 2010; 31: 703-11.