Kor J Fish Aquat Sci 47(5),637-644,2014
한수지 47(5), 637-644, 2014Original Article
637
Copyright © 2014 The Korean Society of Fisheries and Aquatic Science pISSN:0374-8111, eISSN:2287-8815
서 론
대게류
(Chionoecetes spp.)
는절지동물문,
갑각강,
십각목,
물 맞이게과의대게속에속하는갑각류로서연안에서식하는Chi- onoecetes opilio, C. bairdi
와심해에서식하는C. japonicus, C.
tanneri, C. angulatus
의5
종이알려져있다(Luke et al., 1999;
NFRDI, 2010).
대게(C. opilio)
는그린란드서안,
베링해,
알라 스카연안,
북태평양캐나다연안,
오호츠크해,
우리나라동해안 및일본서부연안에주로서식하는냉수성갑각류이다(Yosho and Hayashi, 1994).
한국동해안에는대게(C. opilio),
붉은대 게(C. japonicus)
와대게와붉은대게의교잡종인너도대게라불 리는종을포함하여3
종이서식하고있다(Chun et al., 2009;
Kim et al., 2012).
대게는한국동해안에서맛이뛰어난고급수산물로서상품가 치가높고겨울에는동해안관광자원으로도중요한어종이다
.
한국연안에서는일반적으로자망이나저인망,
그리고통발어업에의해주로어획되고있으며현재연간
1,000
톤전후의어획량을보이고있다
.
한국은대게자원보호를위해총허용어획량(TAC)
제도를시행중에있으며,
모든크기의암컷과두흉갑장9 cm
이하의수컷은채포를금지하고있다.
또한6
월부터10
월 까지는금어기를설정하여자원을관리보호하고있다.
대게에 관한국내연구로는성숙과산란(Chun et al., 2008),
탈피와성 장(Chun et al., 2009)
에관한연구만이있으며,
국외에서는생 식소구조(Kon and Honma, 1970; Chiba and Honma, 1971),
난소내포란수(Kon, 1974; Kanno, 1987),
난의숙도(Ito, 1963;
Brown and Powell, 1972; Comeau and Conan, 1992),
교미및동해에 서식하는 대게류(Chionoecetes spp.)의 재생산 및 분포 특성
차형기·양재형*·이성일 1 ·윤상철 1
국립수산과학원 동해수산연구소 독도수산연구센터, 1국립수산과학원 자원관리과
Reproduction and distribution of Chionoecetes crabs (C. opilio and C. japonicus) in the East Sea
Hyung Kee Cha, Jae Hyeong Yang*, Sung Il Lee
1
and Sang Chul Yoon1
D okdo Fisheries Research Center, East Sea Fisheries Research Institute, National Fisheries Research and Development Institute, Pohang 791-110, Korea
1
Fisheries Resources Management Division, National Fisheries Research and Development Institute, Busan 619-705, Korea Two Chionoecetes crabs, C. opilio and C. japonicus are primary targets of trap fisheries in the East Sea. To promote the sustainable management of these species, we investigated their reproductive biology and spatial distribution based on samples collected in standardized traps in the coastal waters of eastern Korea from September 2007 to August 2008. The estimated spawning season of C. opilio was March- April, whereas that of C. japonicus continued year-round. The estimated molting period of both species was September- October. Fecundity of C. opilio was pro- portional to female, size, ranging from 44,791 to 151,538 eggs, and the estimated body size at 50% sexual maturity was 63.9 mm carapace width. Egg bearing female C. opilio were mostly collected depths of 200-300 m, particularly off Hupo and Chuksan, suggesting that these areas are their major spawning grounds. In contrast, female C. japonicus were mostly collected at depths of 400-600 m, peaking at 600 m. The species-specific catch rate was higher for C.
opilio above 400 m, similar at ca. 450 m, and higher for C. japonicus below 500 m. These vertical differences indi- cate apparent spatial segregation of the species, suggesting that spatially-explicit fisheries management plans may be necessary for mitigating conflicts between the respective crab fisheries and maintaining these crabs.
Key words: Snow crabs, Red queen crab, Distribution, Reproductive cycle, East Sea
This is an Open Access article distributed under the terms of the Creative Commons Attribution Non-Commercial Licens (http://creativecommons.org/licenses/by-nc/3.0/)which permits unrestricted non-commercial use, distribution, and reproduction in any medium, provided the original work is properly cited.
http://dx.doi.org/10.5657/KFAS.2014.0637 Kor J Fish Aquat Sci 47(5) 637-644, October 2014
Received 18 September 2014; Revised 29 September 2014; Accepted 7 October 2014
*Corresponding author: Tel: +82. 54.724.1020 Fax: +82. 54.724.1088
E-mail address: [email protected]
차형기
ㆍ
양재형ㆍ
이성일ㆍ
윤상철638
산란
(Watson, 1970),
성숙대게분포(Elner and Beninger, 1992;
Ennis et al., 1988)
및먹이생물(Hubert and Earl, 2003)
등많은 분야에서연구가수행되고있다.
붉은대게
(C. japonicus)
는수심400-2,300 m
에서서식하고있 으며대게에비해깊은수심에분포하고,
회색진흙또는모랫 바닥에서식한다(Hong et al., 2006).
대게와마찬가지로TAC
대상어종인붉은대게의어획은1980
년대부터본격적으로기타(
근해)
통발로조업이이루어지기시작하였다.
최근5
년간붉은대게의연간어획량은약
33,000
톤으로어획물의대부분은가공되어일본에수출되고있다
.
붉은대게에관한연구로는국내 에서어업생물학적연구(Gong et al., 1978),
식품성분에관한 연구(Park et al., 2003)
가있고,
국외에서는성숙과산란(Ito, 1976),
재생산과포란수에관한연구(Yosho, 2000)
가수행되어 전체적으로는생태학적연구가부족한실정이다.
본연구는한국동해안에분포하는대게류의재생산및분포 특성에대한생태를밝히고자대게와붉은대게의생식소숙도 지수
,
외포란단계변화,
포란수,
군성숙체장,
탈피단계를조사 하고,
대게류에대한수심별분포특성을구명하여최근감소되 는대게류자원의회복및관리방안을마련하는데목적을두 고있다.
재료 및 방법
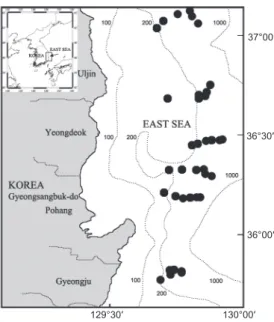
한국동해에서식하는대게류자원의산란생태및분포특성을 파악하기위해경상북도울진군에서경주시까지
6
개의정선을 선정한후,
각정선에수심별200, 300, 400, 450, 500, 600 m
로6
개의정점을나누어총36
개정점에서2007
년9
월부터2008
년8
월까지매월어획및생태조사를실시하였다(Fig. 1).
본조사에사용한어구는망목
125 mm
의붉은대게통발로,
각정점별로통발
10
개를투망하였고,
양망은투망후5
일이내 에실시하였다.
어획조사에 의해채집된대게류에대해어종별로 분류학적 형질을기준으로암컷과수컷으로분류한후생태학적정밀조 사를수행하였고
,
두흉갑장(carapace length)
과두흉갑폭(cara- pace width)
은0.1 mm
단위까지,
체중(total weight)
과생식선 중량(gonad weight),
외포란중량(egg weight)
은0.01 g
까지측 정하였다.
대게류의 생식소발달상태를알기위하여생식소숙도지수
(Gonadosomatic index, GSI)
를다음식으로구하여월별변화 를추정하였다.
GSI = GW BW ×100
여기서
GW
는생식소중량(g,
습중량), BW
는체중(g,
습중량)
을각각나타낸다.
대게류암컷성숙의육안판별을위해외포란단계를파악하였 는데
,
외포란단계는Ito (1963)
와Hilsinger (1976)
의방법을참 고하여난의색과광학현미경하에서의난내발생상태를기준 으로다음과같이4
단계로구분하였다.
Stage Ⅰ:
연한오렌지색을띠며,
현미경상에서는난내에작 은과립상난황으로채워져있으나눈은생기지않음.
Stage Ⅱ:
오렌지색을띠며,
현미경상에서는난내에3/4
가량 의난황이채워짐.
Stage Ⅲ:
다갈색을띠고,
현미경상에서는난내에삼각형의작은눈이생김
Stage Ⅳ:
난은거의흑갈색에가까우며,
현미경상의난내에 는눈이삼각형으로크고검음.
대게류의외포란수는성숙한암컷개체의복절에부착된외포 란을미세한침에의해완전히분리하여해부현미경으로계수 한후
,
습중량법(Bagenal and Brown, 1978)
으로구하였다.
생물학적성숙체장을구하기위해성숙개체의판별은
Watson
(1970)
의방법을참고하였고,
복절이작아복부전체를덮지못하고생식선내의난소색이유백색또는연한오렌지색을나타 내는개체는미숙
,
복절에외포란을가졌거나복부전체를덮고 생식선내의난소색이짙은오렌지색을나타내는개체를완숙 으로판정하여,
체장계급을1 mm
단위로구분하여성숙개체의 비율을구한후logistic
식(Zhang, 1991)
에적용시켜50%
군성 숙체장을구하였다.
대게류의탈피단계는손가락으로갑각을누르면함입되지않 고딱딱한것은경갑
(hard-shell)
이고,
손가락으로갑각을눌러바로합입되는 것은연갑
(soft-shell)
으로정하여월별비율을분석하였다
.
Fig. 1. Location of the sampling areas (●) in the East Sea.
2007 Sep.
Oct.
100 50 100 0 50 100 0 50 0 100 50 0 100 50 0 100 50 0 100 50 0 100 50 100 0 50 100 0 50 0 100 50 0 100 50 0
Nov.
Dec.
2008 Jan.
Feb.
Mar.
Apr.
May.
Jun.
Jul.
Aug.
Gonadosomatic index (GSI)
Frequency (%)
2007 Sep.
100 50 0 100 Oct.
50 0 100 50 0 100 50 100 0 50 100 0 50 100 0 50 0 100 50 0 100 50 0 100 50 0 100 50 100 0 50 0
Nov.
Dec.
2008 Jan.
Feb.
Mar.
Apr.
May.
Jun.
Jul.
Aug.
Gonadosomatic index (GSI)
Frequency (%)
37°00′
36°30′
36°00′
130°00′
129°30′
37°00′
36°30′
36°00′
130°00′
129°30′
37°00′
36°30′
36°00′
130°00′
129°30′
Month Sep. Oct. Nov.
2007
StageⅠ StageⅡ StageⅢ StageⅣ No eggs
Dec. Jan. Feb. Mar. Apr. May. Jun. Jul. Aug. 2008 (A)
Frequency (%)
0 20 40 60 80 100
(B)
Frequency (%)
0 20 40 60 80 100
Group maturity (%)
Carapace width (CW, mm) 0 30
10 20 30 40 50 60 70 80 90 100
40 50 60 70 80 90 100
CW50 = 63.9 mm
Fecundity (×10
3) 0 20 40 60 80 100 120 140 160 180
Fecundity (×10
3)
0 70 75 80 85 90 95 100
60 65 70 75 80 85 90 95 100
20 40 60 80 100 120 140 160 180
Month Sep. Oct. Nov.
2007
Hard-Shell Soft-Shell
Dec. Jan. Feb. Mar. Apr. May. Jun. Jul. Aug. 2008 (A)
Frequency (%)
0 20 40 60 80 100
(B)
Frequency (%)
0 20 40 60 80 100
Frequency (%)
200 300 400 450 500 600
0 10 20 30 40 50 60 70 80 90 100
Depth (m)
Chinoecetes opilio Chinoecetes sp. Chinoecetes japonicus F = 0.0036CW2.3102
R² = 0.6256
F = 608CWE4.7429 R² = 0.5256
(A)
(B)
Carapace width (CW, mm)
Carapace width (CW, mm)
대게류의 재생산 및 분포특성
639
대게류의분포특성을파악하기위하여수심별로대게및붉 은대게의종조성을조사하였고
,
대게류정점별분포를통해해 역별수심별분포를파악하였다.
그리고대게류의산란장을추 정하기위해암컷대게류의해역별수심별분포를조사하였다.
결 과
생식소 숙도지수의 월 변화
대게 암컷에대한생식소숙도지수
(GSI)
는2007
년9
월부터2008
년4
월까지GSI
값이0-12
까지의광범위한값을나타내었으며
, GSI
값이6
이하인개체들은대부분이난소가유백색이거나연한오렌지색으로미숙상태였다
. GSI
값이7
이상인개 체들의난소색은미숙상태보다짙은오렌지색을나타내었고,
난소가복강의대부분을차지하고있었으며,
외포란색은갈색 또는흑색을띄었다. 3
월이후GSI
값의주모드가크게감소하 여대부분이6
이하의낮은값을나타내었으며, 3
월-4
월에GSI
값이10-11
인개체가일부출현하였다[Fig. 2(A)].
붉은대게 암컷의
GSI
는2007
년9
월부터11
월에GSI
값이2-6
으로 범위가 가장 좁았고, 2007
년12
월-2008
년8
월에는GSI
값이0-13
으로대체로넓은분포범위를보였다. 2008
년5
월에GSI
값이최고치를나타내었고, 2008
년4
월과5
월에난소 의색이유백색이거나연한오렌지색인개체들이많이출현하 였으며,
그외에는대부분이짙은오렌지색을나타내었다[Fig.
2(B)].
외포란 발달단계의 월 변화
대게암컷에대한외포란단계를보면
Stage Ⅰ
과Ⅱ
의개체 들이2007
년9-10
월까지대부분을차지하였고, Stage Ⅲ
의개 체는2007
년9
월에약12%
로출현하여11
월에42%
로가장높 았으며, 2008
년3
월까지계속높은출현율을보였다. Stage Ⅲ
의개체는2008
년4
월이후에는거의출현하지않았고, 7-8
월에 일부개체가출현하였다. Stage Ⅳ
의개체들은2007
년12
월부 터출현하기시작하여2008
년4
월까지출현하였으며,
매월출 현율은20%, 5%, 15%, 13%
그리고5%
로월별출현율이다르 게나타났다[Fig. 3(A)].
붉은대게 암컷에대한외포란단계를보면
StageⅠ
의개체2007 Sep.
Oct.
100 50 0 100 50 0 100 50 0 100 50 0 100 50 100 0 50 100 0 50 0 100 50 0 100 50 0 100 50 0 100 50 0 100 50 0
Nov.
Dec.
2008 Jan.
Feb.
Mar.
Apr.
May.
Jun.
Jul.
Aug.
Gonadosomatic index (GSI)
Frequency (%)
2007 Sep.
100 50 0 100 Oct.
50 100 0 50 100 0 50 0 100 50 0 100 50 0 100 50 0 100 50 100 0 50 100 0 50 100 0 50 0 100 50 0
Nov.
Dec.
2008 Jan.
Feb.
Mar.
Apr.
May.
Jun.
Jul.
Aug.
Gonadosomatic index (GSI)
Frequency (%)
37°00′
36°30′
36°00′
130°00′
129°30′
37°00′
36°30′
36°00′
130°00′
129°30′
37°00′
36°30′
36°00′
130°00′
129°30′
Month Sep. Oct. Nov.
2007
StageⅠ StageⅡ StageⅢ StageⅣ No eggs
Dec. Jan. Feb. Mar. Apr. May. Jun. Jul. Aug. 2008 (A)
Frequency (%)
0 20 40 60 80 100
(B)
Frequency (%)
0 20 40 60 80 100
Group maturity (%)
Carapace width (CW, mm) 0 30
10 20 30 40 50 60 70 80 90 100
40 50 60 70 80 90 100
CW50 = 63.9 mm
Fecundity (×10
3) 0 20 40 60 80 100 120 140 160 180
Fecundity (×10
3)
0 70 75 80 85 90 95 100
60 65 70 75 80 85 90 95 100
20 40 60 80 100 120 140 160 180
Month Sep. Oct. Nov.
2007
Hard-Shell Soft-Shell
Dec. Jan. Feb. Mar. Apr. May. Jun. Jul. Aug. 2008 (A)
Frequency (%)
0 20 40 60 80 100
(B)
Frequency (%)
0 20 40 60 80 100
Frequency (%)
200 300 400 450 500 600
0 10 20 30 40 50 60 70 80 90 100
Depth (m)
Chinoecetes opilio Chinoecetes sp. Chinoecetes japonicus F = 0.0036CW2.3102
R² = 0.6256
F = 608CWE4.7429 R² = 0.5256
(A)
(B)
Carapace width (CW, mm) Carapace width (CW, mm) 2007 Sep.
Oct.
100 50 0 100 50 0 100 50 100 0 50 100 0 50 100 0 50 0 100 50 0 100 50 0 100 50 0 100 50 0 100 50 100 0 50 0
Nov.
Dec.
2008 Jan.
Feb.
Mar.
Apr.
May.
Jun.
Jul.
Aug.
Gonadosomatic index (GSI)
Frequency (%)
2007 Sep.
100 50 0 100 Oct.
50 0 100 50 0 100 50 0 100 50 0 100 50 0 100 50 100 0 50 100 0 50 0 100 50 0 100 50 0 100 50 0
Nov.
Dec.
2008 Jan.
Feb.
Mar.
Apr.
May.
Jun.
Jul.
Aug.
Gonadosomatic index (GSI)
Frequency (%)
37°00′
36°30′
36°00′
130°00′
129°30′
37°00′
36°30′
36°00′
130°00′
129°30′
37°00′
36°30′
36°00′
130°00′
129°30′
Month Sep. Oct. Nov.
2007
StageⅠ StageⅡ StageⅢ StageⅣ No eggs
Dec. Jan. Feb. Mar. Apr. May. Jun. Jul. Aug. 2008 (A)
Frequency (%)
0 20 40 60 80 100
(B)
Frequency (%)
0 20 40 60 80 100
Group maturity (%)
Carapace width (CW, mm) 0 30
10 20 30 40 50 60 70 80 90 100
40 50 60 70 80 90 100
CW50 = 63.9 mm
Fecundity (×10
3) 0 20 40 60 80 100 120 140 160 180
Fecundity (×10
3)
0 70 75 80 85 90 95 100
60 65 70 75 80 85 90 95 100
20 40 60 80 100 120 140 160 180
Month Sep. Oct. Nov.
2007
Hard-Shell Soft-Shell
Dec. Jan. Feb. Mar. Apr. May. Jun. Jul. Aug. 2008 (A)
Frequency (%)
0 20 40 60 80 100
(B)
Frequency (%)
0 20 40 60 80 100
Frequency (%)
200 300 400 450 500 600
0 10 20 30 40 50 60 70 80 90 100
Depth (m)
Chinoecetes opilio Chinoecetes sp. Chinoecetes japonicus F = 0.0036CW2.3102
R² = 0.6256
F = 608CWE4.7429 R² = 0.5256
(A)
(B)
Carapace width (CW, mm) Carapace width (CW, mm)
(A) (B)
Fig. 2. Monthly changes in gonadosomatic index (GSI) of female (A) Chionoecetes opilio and (B) Chionoecetes japonicus in the East Sea.
차형기
ㆍ
양재형ㆍ
이성일ㆍ
윤상철640
들은
2007
년12
월을제외하고전조사기간중13-65%
로출현 하였고, Stage Ⅱ
의개체는2007
년12
월부터2008
년8
월까지1-31%
로출현하였다. Stage Ⅲ
의개체들은2008
년8
월에출현 하였고, Stage Ⅳ
의개체들은2007
년12
월과2008
년3
월에출 현하여월별뚜렷한경향을보이지않았다[Fig. 3(B)].
포란수
대게의재생산력을알아보기위해외포란을하고있는암컷 개체
49
마리를대상으로포란수를계수한결과,
포란수는최소44,791
개(
갑폭66.9 mm),
최다151,538
개(
갑폭90.0 mm)
로계 수되었다.
갑폭에따른절대포란수는체장이커질수록증가하 는것으로나타났다[Fig. 4(A)].
붉은대게
45
마리를 대상으로 포란수를 계수한 결과,
최소35,012
개(
갑폭74.1 mm),
최다159,593
개(
갑폭89.6 mm)
로 계수되었다.
갑폭에따른포란수는체장이커질수록증가하는 것으로나타났다[Fig. 4(B)].
생물학적 성숙체장
대게암컷이재생산에참여하는생물학적성숙체장을알아보 기위해산란기전후로추정되는
1-5
월의암컷260
마리를대상 으로체급별성숙개체의출현율을조사하였다.
체급별성숙개체는갑폭
54 mm
이하에서는성숙개체가출현하지않았고, 62
mm
에서50%, 66 mm
에서57%, 68 mm
에서80%, 69 mm
에 서86%,
그리고70 mm
이상에서는모든개체가성숙개체로판명되었다
.
따라서대게암컷의50%
군성숙체장은이들체급별성숙개체의출현비율을
logistic
식에적용하여추정한결과,
갑 폭63.9 mm
로산출되었다(Fig. 5).
탈피단계의 월 변화
대게수컷의경갑상태개체의출현율은
2007
년9
월에49%
로Fig. 3. Monthly changes in maturity stages of female (A) Chion- oecetes opilio and (B) Chionoecetes japonicus in the East Sea.
2007 Sep.
Oct.
100 50 100 0 50 100 0 50 100 0 50 0 100 50 0 100 50 0 100 50 0 100 50 0 100 50 100 0 50 100 0 50 0 100 50 0
Nov.
Dec.
2008 Jan.
Feb.
Mar.
Apr.
May.
Jun.
Jul.
Aug.
Gonadosomatic index (GSI)
Frequency (%)
2007 Sep.
100 50 0 100 Oct.
50 0 100 50 0 100 50 0 100 50 100 0 50 100 0 50 0 100 50 0 100 50 0 100 50 0 100 50 0 100 50 0
Nov.
Dec.
2008 Jan.
Feb.
Mar.
Apr.
May.
Jun.
Jul.
Aug.
Gonadosomatic index (GSI)
Frequency (%)
37°00′
36°30′
36°00′
130°00′
129°30′
37°00′
36°30′
36°00′
130°00′
129°30′
37°00′
36°30′
36°00′
130°00′
129°30′
Month Sep. Oct. Nov.
2007
StageⅠ StageⅡ StageⅢ StageⅣ No eggs
Dec. Jan. Feb. Mar. Apr. May. Jun. Jul. Aug. 2008 (A)
Frequency (%)
0 20 40 60 80 100
(B)
Frequency (%)
0 20 40 60 80 100
Group maturity (%)
Carapace width (CW, mm) 0 30
10 20 30 40 50 60 70 80 90 100
40 50 60 70 80 90 100
CW50 = 63.9 mm
Fecundity (×10
3) 0 20 40 60 80 100 120 140 160 180
Fecundity (×10
3)
0 70 75 80 85 90 95 100
60 65 70 75 80 85 90 95 100
20 40 60 80 100 120 140 160 180
Month Sep. Oct. Nov.
2007
Hard-Shell Soft-Shell
Dec. Jan. Feb. Mar. Apr. May. Jun. Jul. Aug. 2008 (A)
Frequency (%)
0 20 40 60 80 100
(B)
Frequency (%)
0 20 40 60 80 100
Frequency (%)
200 300 400 450 500 600
0 10 20 30 40 50 60 70 80 90 100
Depth (m)
Chinoecetes opilio Chinoecetes sp. Chinoecetes japonicus F = 0.0036CW2.3102
R² = 0.6256
F = 608CWE4.7429 R² = 0.5256
(A)
(B)
Carapace width (CW, mm) Carapace width (CW, mm)
2007 Sep.
Oct.
100 50 0 100 50 100 0 50 100 0 50 100 0 50 0 100 50 0 100 50 0 100 50 0 100 50 100 0 50 100 0 50 100 0 50 0
Nov.
Dec.
2008 Jan.
Feb.
Mar.
Apr.
May.
Jun.
Jul.
Aug.
Gonadosomatic index (GSI)
Frequency (%)
2007 Sep.
100 50 0 100 Oct.
50 0 100 50 0 100 50 0 100 50 0 100 50 100 0 50 100 0 50 0 100 50 0 100 50 0 100 50 0 100 50 0
Nov.
Dec.
2008 Jan.
Feb.
Mar.
Apr.
May.
Jun.
Jul.
Aug.
Gonadosomatic index (GSI)
Frequency (%)
37°00′
36°30′
36°00′
130°00′
129°30′
37°00′
36°30′
36°00′
130°00′
129°30′
37°00′
36°30′
36°00′
130°00′
129°30′
Month Sep. Oct. Nov.
2007
StageⅠ StageⅡ StageⅢ StageⅣ No eggs
Dec. Jan. Feb. Mar. Apr. May. Jun. Jul. Aug. 2008 (A)
Frequency (%)
0 20 40 60 80 100
(B)
Frequency (%)
0 20 40 60 80 100
Group maturity (%)
Carapace width (CW, mm) 0 30
10 20 30 40 50 60 70 80 90 100
40 50 60 70 80 90 100
CW50 = 63.9 mm
Fecundity (×10
3) 0 20 40 60 80 100 120 140 160 180
Fecundity (×10
3)
0 70 75 80 85 90 95 100
60 65 70 75 80 85 90 95 100
20 40 60 80 100 120 140 160 180
Month Sep. Oct. Nov.
2007
Hard-Shell Soft-Shell
Dec. Jan. Feb. Mar. Apr. May. Jun. Jul. Aug. 2008 (A)
Frequency (%)
0 20 40 60 80 100
(B)
Frequency (%)
0 20 40 60 80 100
Frequency (%)
200 300 400 450 500 600
0 10 20 30 40 50 60 70 80 90 100
Depth (m)
Chinoecetes opilio Chinoecetes sp. Chinoecetes japonicus F = 0.0036CW2.3102
R² = 0.6256
F = 608CWE4.7429 R² = 0.5256
(A)
(B)
Carapace width (CW, mm) Carapace width (CW, mm)
Fig. 4. Relationship between carapace width (CW) and fecundity of female (A) Chionoecetes opilio and (B) Chionoecetes japonicus in the East Sea.
2007 Sep.
Oct.
100 50 100 0 50 100 0 50 0 100 50 0 100 50 0 100 50 0 100 50 100 0 50 100 0 50 100 0 50 0 100 50 0 100 50 0
Nov.
Dec.
2008 Jan.
Feb.
Mar.
Apr.
May.
Jun.
Jul.
Aug.
Gonadosomatic index (GSI)
Frequency (%)
2007 Sep.
100 50 0 100 Oct.
50 0 100 50 0 100 50 100 0 50 100 0 50 0 100 50 0 100 50 0 100 50 0 100 50 0 100 50 100 0 50 0
Nov.
Dec.
2008 Jan.
Feb.
Mar.
Apr.
May.
Jun.
Jul.
Aug.
Gonadosomatic index (GSI)
Frequency (%)
37°00′
36°30′
36°00′
130°00′
129°30′
37°00′
36°30′
36°00′
130°00′
129°30′
37°00′
36°30′
36°00′
130°00′
129°30′
Month Sep. Oct. Nov.
2007
StageⅠ StageⅡ StageⅢ StageⅣ No eggs
Dec. Jan. Feb. Mar. Apr. May. Jun. Jul. Aug. 2008 (A)
Frequency (%)
0 20 40 60 80 100
(B)
Frequency (%)
0 20 40 60 80 100
Group maturity (%)
Carapace width (CW, mm) 0 30
10 20 30 40 50 60 70 80 90 100
40 50 60 70 80 90 100
CW50 = 63.9 mm
Fecundity (×10
3) 0 20 40 60 80 100 120 140 160 180
Fecundity (×10
3)
0 70 75 80 85 90 95 100
60 65 70 75 80 85 90 95 100
20 40 60 80 100 120 140 160 180
Month Sep. Oct. Nov.
2007
Hard-Shell Soft-Shell
Dec. Jan. Feb. Mar. Apr. May. Jun. Jul. Aug. 2008 (A)
Frequency (%)
0 20 40 60 80 100
(B)
Frequency (%)
0 20 40 60 80 100
Frequency (%)
200 300 400 450 500 600
0 10 20 30 40 50 60 70 80 90 100
Depth (m)
Chinoecetes opilio Chinoecetes sp. Chinoecetes japonicus F = 0.0036CW2.3102
R² = 0.6256
F = 608CWE4.7429 R² = 0.5256
(A)
(B)
Carapace width (CW, mm) Carapace width (CW, mm)
Fig. 5. Relationship between carapace width (CW) and group ma- turity of female Chionoecetes opilio in the East Sea.
대게류의 재생산 및 분포특성
641
가장낮았고
, 10
월에60%, 11
월86%, 12
월에90%
로나타났 으며, 2008
년1-3
월까지는출현한모든개체가경갑상태였다. 4
월이후부터다시연갑상태가일부개체에서출현하기시작 하였고, 8
월에경갑상태개체의출현율은91%
였다[Fig. 6(A)].
붉은대게수컷경갑상태개체의출현율은
2007
년9
월에26%
로가장낮았고
, 10
월에41%
이었다. 11
월부터경갑상태개체 가크게증가하여2008
년6
월까지80%
이상의출현율을보였 으며, 7
월이후다소감소하여69%, 8
월에72%
를나타내었다[Fig. 6(B)].
대게류 분포특성
대게류의수심별종조성은수심
200-300 m
에서대게만이출현하였고
, 400 m
에서는대게가85%,
붉은대게가15%
로대게 의출현율이높았다(Fig. 7). 450 m
에서는대게가51%,
붉은대 게가49%
로출현율이비슷하였으며, 500-600 m
에서는대게가3-8%,
붉은대게가92-97%
로수심별로어종별출현율의차이가명확하였다
(Fig. 7).
대게류의정점별분포를살펴보면
(Fig. 8),
수심200-300 m
에 서는대게만이출현하였고,
대게암컷및두흉갑폭9 cm
이하의 소형수컷개체들이많이어획되어조사수심이대게의주요산란장및성육장의역할을하고있는것으로추정된다
.
수심400
m
에서는울진정점에서한시기에붉은대게가우점하여출현한 정점이있었으나,
대체로대게의출현율이높았다.
수심450 m
에서는지역에따라대게의분포밀도가높거나혹은붉은대게 의분포밀도가높았으며,
동일한조사정점이더라도시기에따 라대게와붉은대게의분포밀도및출현양상이서로상반되게나타났다
.
수심500-600 m
에서는대게가일부출현한정점이있었으나출현한개체의대부분이붉은대게로
500 m
이심에서 는대게의분포밀도가극히감소하였다.
대게암컷의출현은주로수심
200-300 m
에서출현하였는데,
울진후포해역수심200-300 m
와영덕축산해역수심200-300 m
를중심으로높은분포밀도를나타내어이해역이대게의주 요산란장인것으로추정되었다(Fig. 9).
Fig. 7. Variations in species composition of biomass of the three snow crab species, Chionoecetes spp. in the East Sea.
2007 Sep.
Oct.
100 50 0 100 50 0 100 50 100 0 50 100 0 50 100 0 50 0 100 50 0 100 50 0 100 50 0 100 50 0 100 50 100 0 50 0
Nov.
Dec.
2008 Jan.
Feb.
Mar.
Apr.
May.
Jun.
Jul.
Aug.
Gonadosomatic index (GSI)
Frequency (%)
2007 Sep.
100 50 0 100 Oct.
50 0 100 50 0 100 50 0 100 50 0 100 50 0 100 50 100 0 50 100 0 50 0 100 50 0 100 50 0 100 50 0
Nov.
Dec.
2008 Jan.
Feb.
Mar.
Apr.
May.
Jun.
Jul.
Aug.
Gonadosomatic index (GSI)
Frequency (%)
37°00′
36°30′
36°00′
130°00′
129°30′
37°00′
36°30′
36°00′
130°00′
129°30′
37°00′
36°30′
36°00′
130°00′
129°30′
Month Sep. Oct. Nov.
2007
StageⅠ StageⅡ StageⅢ StageⅣ No eggs
Dec. Jan. Feb. Mar. Apr. May. Jun. Jul. Aug. 2008 (A)
Frequency (%)
0 20 40 60 80 100
(B)
Frequency (%)
0 20 40 60 80 100
Group maturity (%)
Carapace width (CW, mm) 0 30
10 20 30 40 50 60 70 80 90 100
40 50 60 70 80 90 100
CW50 = 63.9 mm
Fecundity (×10
3) 0 20 40 60 80 100 120 140 160 180
Fecundity (×10
3)
0 70 75 80 85 90 95 100
60 65 70 75 80 85 90 95 100
20 40 60 80 100 120 140 160 180
Month Sep. Oct. Nov.
2007
Hard-Shell Soft-Shell
Dec. Jan. Feb. Mar. Apr. May. Jun. Jul. Aug. 2008 (A)
Frequency (%)
0 20 40 60 80 100
(B)
Frequency (%)
0 20 40 60 80 100
Frequency (%)
200 300 400 450 500 600
0 10 20 30 40 50 60 70 80 90 100
Depth (m)
Chinoecetes opilio Chinoecetes sp. Chinoecetes japonicus F = 0.0036CW2.3102
R² = 0.6256
F = 608CWE4.7429 R² = 0.5256
(A)
(B)
Carapace width (CW, mm) Carapace width (CW, mm)
Fig. 6. Monthly changes in molting stages of male (A) Chionoece- tes opilio and (B) Chionoecetes japonicus in the East Sea.
2007 Sep.
Oct.
100 50 0 100 50 0 100 50 0 100 50 100 0 50 100 0 50 100 0 50 0 100 50 0 100 50 0 100 50 0 100 50 0 100 50 0
Nov.
Dec.
2008 Jan.
Feb.
Mar.
Apr.
May.
Jun.
Jul.
Aug.
Gonadosomatic index (GSI)
Frequency (%)
2007 Sep.
100 50 0 100 Oct.
50 100 0 50 0 100 50 0 100 50 0 100 50 0 100 50 0 100 50 100 0 50 100 0 50 0 100 50 0 100 50 0
Nov.
Dec.
2008 Jan.
Feb.
Mar.
Apr.
May.
Jun.
Jul.
Aug.
Gonadosomatic index (GSI)
Frequency (%)
37°00′
36°30′
36°00′
130°00′
129°30′
37°00′
36°30′
36°00′
130°00′
129°30′
37°00′
36°30′
36°00′
130°00′
129°30′
Month Sep. Oct. Nov.
2007
StageⅠ StageⅡ StageⅢ StageⅣ No eggs
Dec. Jan. Feb. Mar. Apr. May. Jun. Jul. Aug. 2008 (A)
Frequency (%)
0 20 40 60 80 100
(B)
Frequency (%)
0 20 40 60 80 100
Group maturity (%)
Carapace width (CW, mm) 0 30
10 20 30 40 50 60 70 80 90 100
40 50 60 70 80 90 100
CW50 = 63.9 mm
Fecundity (×10
3) 0 20 40 60 80 100 120 140 160 180
Fecundity (×10
3)
0 70 75 80 85 90 95 100
60 65 70 75 80 85 90 95 100
20 40 60 80 100 120 140 160 180
Month Sep. Oct. Nov.
2007
Hard-Shell Soft-Shell
Dec. Jan. Feb. Mar. Apr. May. Jun. Jul. Aug. 2008 (A)
Frequency (%)
0 20 40 60 80 100
(B)
Frequency (%)
0 20 40 60 80 100
Frequency (%)
200 300 400 450 500 600
0 10 20 30 40 50 60 70 80 90 100
Depth (m)
Chinoecetes opilio Chinoecetes sp. Chinoecetes japonicus F = 0.0036CW2.3102
R² = 0.6256
F = 608CWE4.7429 R² = 0.5256
(A)
(B)
Carapace width (CW, mm) Carapace width (CW, mm)
2007 Sep.
Oct.
100 50 0 100 50 100 0 50 100 0 50 0 100 50 0 100 50 0 100 50 0 100 50 0 100 50 100 0 50 100 0 50 0 100 50 0
Nov.
Dec.
2008 Jan.
Feb.
Mar.
Apr.
May.
Jun.
Jul.
Aug.
Gonadosomatic index (GSI)
Frequency (%)
2007 Sep.
100 50 0 100 Oct.
50 0 100 50 0 100 50 0 100 50 100 0 50 100 0 50 100 0 50 0 100 50 0 100 50 0 100 50 0 100 50 0
Nov.
Dec.
2008 Jan.
Feb.
Mar.
Apr.
May.
Jun.
Jul.
Aug.
Gonadosomatic index (GSI)
Frequency (%)
37°00′
36°30′
36°00′
130°00′
129°30′
37°00′
36°30′
36°00′
130°00′
129°30′
37°00′
36°30′
36°00′
130°00′
129°30′
Month Sep. Oct. Nov.
2007
StageⅠ StageⅡ StageⅢ StageⅣ No eggs
Dec. Jan. Feb. Mar. Apr. May. Jun. Jul. Aug. 2008 (A)
Frequency (%)
0 20 40 60 80 100
(B)
Frequency (%)
0 20 40 60 80 100
Group maturity (%)
Carapace width (CW, mm) 0 30
10 20 30 40 50 60 70 80 90 100
40 50 60 70 80 90 100
CW50 = 63.9 mm
Fecundity (×10
3) 0 20 40 60 80 100 120 140 160 180
Fecundity (×10
3)
0 70 75 80 85 90 95 100
60 65 70 75 80 85 90 95 100
20 40 60 80 100 120 140 160 180
Month Sep. Oct. Nov.
2007
Hard-Shell Soft-Shell
Dec. Jan. Feb. Mar. Apr. May. Jun. Jul. Aug. 2008 (A)
Frequency (%)
0 20 40 60 80 100
(B)
Frequency (%)
0 20 40 60 80 100
Frequency (%)
200 300 400 450 500 600
0 10 20 30 40 50 60 70 80 90 100
Depth (m)
Chinoecetes opilio Chinoecetes sp. Chinoecetes japonicus F = 0.0036CW2.3102
R² = 0.6256
F = 608CWE4.7429 R² = 0.5256
(A)
(B)
Carapace width (CW, mm) Carapace width (CW, mm)
Fig. 8. Distribution of Chionoecetes opilio and Chionoecetes ja- ponicus in the East Sea. White circle, Chionoecetes opilio; black circle, Chionoecetes japonicus; gray circle, Chionoecetes opilio and Chionoecetes japonicus.