Kor J Fish Aquat Sci 46(6),930-940,2013 한수지 46(6), 930-940, 2013
Original Article
930
서 론하구역은강물과해수가만나는전이지대로서강물을통해육 지에서공급되는부유물질과용존화학성분들이물리적인희 석작용
,
생물에의한흡수,
부유물질에의한탈착과흡착등과 같은공급과제거과정을통해급격한변화를보이는곳이다.
특 히,
계절적인강우량의차이와하구둑건설로인한강물유출량 의변화,
지형적인특성,
해수유동의변동,
주변도시하수의유 입과같은인간활동의영향으로그변화양상은매우복잡하다(Yang et al., 1999).
하구퇴적물은주로하천기원부유물질로구성되어져있으며 부유물질의기원
,
운반및퇴적과정,
하구역의환경요인에따라그분포가달라진다
(Seo and Park, 2007).
한반도서해안의경 우,
연안을따라한강,
금강,
만경강,
동진강,
영산강등과같은 큰강이위치하고있고이들해역의하구퇴적물에있어서강물 로부터유입되는부유물질의영향이매우중요할것으로여겨 지고있다(Park and Khim, 1990).
이러한강물을통해유입되 는하천기원부유물질의분포는하구퇴적물중화학성분들의 분포에도큰영향을줄수있다.
특히미량금속은반응성으로서 하천기원부유물질과함께강에서바다로이동하는동안여러 가지물리·
화학적환경변화에따른공급과제거과정을거쳐최 종적으로하구퇴적물에침적된다.
따라서,
하구퇴적물중미량 금속은그해역의미량금속오염정도에대한지표로사용될수 있다(Bruland et al., 1974; Förstner and Wittman, 1979).
Article history;
Received 1 October 2013; Revised 16 December 2013; Accepted 16 December 2013
*Corresponding author: Tel: +82. 51. 720. 2532 Fax: +82. 51. 720. 2515 E-mail address: [email protected]
Kor J Fish Aquat Sci 46(6) 930-940, December 2013 http://dx.doi.org/10.5657/KFAS.2013.0930 pISSN:0374-8111, eISSN:2287-8815
ⓒ The Korean Society of Fishereis and Aquatic Science. All rights reserved
퇴적물 오염기준을 이용한 금강 하구역 표층 퇴적물내 유기물 및 미량금속 오염 평가
황동운
*·이인석·최민규·김숙양·최희구
국립수산과학원 어장환경과
Evaluation of Organic Matter and Trace Metal Contamination in Surface Sediments around the Geum River Estuary using
Sediment Quality Guidelines
Dong-Woon Hwang*, In-Seok Lee, Minkyu Choi, Sook-Yang Kim and Hee-Gu Choi
Marine Environment Research Division, National Fisheries Research & Development Institute, Busan 619-705, Korea We evaluated contamination with organic matter and trace metals by analyzing grain size, ignition loss (IL), chemical oxygen de- mand (COD), acid volatile sulfide (AVS), and trace metals (Al, Fe, Cu, Pb, Zn, Cd, Ni, Cr, Mn, Hg, and As) in surface sediments at 28 stations around the Geum River estuary in July 2008. The surface sediments in the estuary were mainly composed of coarse sediment (sand and muddy sand), with mean grain size (Mz) ranging between 2-4 Ø. The high concentrations of IL, COD, and trace metals were mainly found at stations in front of the Gusan outer port and industrial complex, and near the Seocheon coast with relatively fine sediments. In addition, the concentrations of IL and all trace metals, except Pb and As, showed good positive cor- relations with Mz, indicating that the concentrations of organic matter and trace metals were mainly dependent on sediment grain size. The concentrations of COD, AVS, and trace metals in most sediments did not exceed the sediment quality guideline (SQGs).
Although the sediments in the study region are not polluted with organic matter and trace metals, there are many point sources of pollutants, such as Gusan port and industrial complex, Janghang refinery, and a thermoelectric power plant around the Geum River estuary. Thus, the management of coastal environments through periodic monitoring of organic matter and trace metals is required in the future.
Key words: Sediment, Organic matter, Trace metal, Contamination, Sediment quality guidelines, Geum River estuary
한반도중부에위치한금강은우리나라의
5
대강에속하는큰 강으로인근의만경강과동진강과더불어한반도서해중부연 안해역에다량의퇴적물을공급하는중요한하천중에하나이 다(Choi et al., 1995a).
하지만,
매년발생하는가뭄과홍수의폐해
,
염수의침입을방지하기위하여1988
년전라북도옥구군성산면성덕리와충청남도서천군마서면도삼리를연결하는 금강하구둑
(
길이: 1,841 m)
이건설되었고(Yang et al., 1999;
Seo and Park, 2007),
하구인근해역에새만금간척사업,
군산 신외항및해상도시건설등대규모방조제축조와매립사업이 완료되었거나수행중에있다(Ryu et al., 2006).
또한,
하구둑에 서부터바다쪽으로군산내항,
장항항,
군산외항이위치하고있 으며(Shin et al., 2006),
매립지와인근육상에는공단이조성되 어비료및제조공장,
동판가공공장,
제지·
펄프공장,
조선소등 각종산업시설들이들어서고있다.
이러한금강하구주변의개 발은연안지역의산업화와도시화를가속화하여육상으로부터 미량금속의유입을가중시키고금강하구역을비롯한인근해역 에확산되어퇴적물오염을일으킬가능성이높다.
특히,
금강하구서천군장항인근육상에는
1936
년부터50
여년동안제련활동이있었던장항제련소가위치하고있으며
(Kim and Chon,
1993),
제련과정에서발생한미량금속들이분진이나폐수를통하여배출되어주변토양과하구퇴적물의오염원으로작용하 였을지모른다
.
지금까지 금강하구역과 인근해역에서미량금속의 지화학 적순환과정을이해하기위하여금강주변육상토양
(Kim and Chon, 1993),
하천수및하천기원부유물질(Lee, 1992; Choi, 1993a; Ra, 1993; Choi et al., 1995a, 1996; Kim, 2002; Youn, 2013),
하상 퇴적물(Choi et al., 1996; Hwang et al., 2001;
Kang, 2009; Park, 2013),
하구퇴적물(Chi et al., 2000; Seo
and Park, 2007)
중미량금속분포특성및육상지질과의상관성에대하여지속적인연구가진행되어져왔다
.
그러나,
금강본류 를따라하천기원부유물질과하상퇴적물중미량금속의거동 에대한연구는많이이루어져왔지만강물을통해유입되는미 량금속의영향을받는하구퇴적물중미량금속의분포및오염현황을파악할수있는연구는매우미비한실정이다
.
따라서
,
이연구에서는금강하구퇴적물중미량금속의분포 특성및오염현황을파악하기위하여하구둑에서부터군산외 항바깥쪽인근해역까지하구퇴적물을채취하여퇴적물중미 량금속농도와이들의분포에영향을줄수있는여러지화학 적인요인들(
입도,
강열감량,
화학적산소요구량,
산휘발성황화 물)
을조사하였다.
재료 및 방법
연구지역
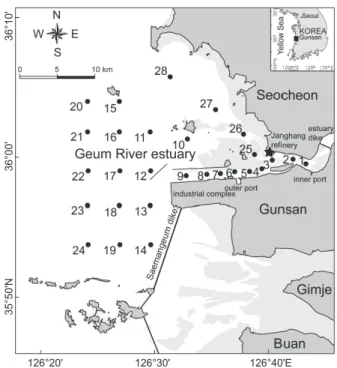
연구지역인금강하구는한반도서쪽중앙부의충청남도서천 과전라북도군산의경계부근에위치하고있다
(Fig. 1).
금강은발원지인전라북도진안에서군산까지총연장
412 km,
유역면적이약
9,900 km
2에달하는큰강이다(Yang et al., 1999).
연평 균강물유출량은약6.4×10
9m
3/year
에달하며한반도중부지 방의농공업용수와주변도시의상수원으로서이용되고있다(Yang and Kim, 1990; Kim et al., 1998).
또한,
강물을통해하 구로유출되는부유물의양은연간약1.0-1.5×10
6m
3/year
에 이른다(Choi, 1993b; Choi et al., 1995b).
강의하류쪽에건설 된하구둑과몬순기후의영향으로강물과이를통한부유물유 출량의시간적변화가매우크고,
하계에집중적으로공급되는 부유물질의대부분은하구둑건설로인한하구지형및해수유 동의변화로군산외항에서부터하구둑까지부유물질의퇴적이 우세한환경으로바뀌면서군산내항까지선박의입·
출항을위 해주기적인준설이이루어지고있다(Choi, 1993b; Choi et al., 1995b; Shin et al., 2006).
금강하구는복잡한지형및천해특성에기인한조석현상이뚜 렷하게나타나며
,
강물유출량에비하여상대적으로조석의영 향이우세한해역이다(Shin et al., 2006, Seo and Park, 2007).
이해역의조석은일조부등인반일주조로군산내항을기준으 로평균조차가
4.3 m (
대조기5.7 m,
소조기2.8 m)
로서대조 차환경을보인다(Choi et al., 1989; Lee, 1992).
이로인해강 물유출시완전혼합형또는부분혼합형의순환형태를갖는염 하구환경이발달하고,
강물유출량이적은시기에는최대혼탁 수(turbidity maximum)
가형성된다(Choi et al., 1996).
조석의Fig. 1. A map showing the study area and the sampling stations for analyzing the trace metals in the surface sediment around Geum River estuary.
Fig. 2. The sedimentary type of surface sediment around Geum River estuary (Abbreviations:
sZ - sandy silt; (g)M - slightly gravelly mud; sM - sandy mud; S - sand; zS - silty sand; mS – muddy sand; (g)S – slightly gravelly sand; (g)mS - slightly gravelly muddy sand).
Fig. 3. Mean grain size (Mz) and the concentrations of ignition loss (IL), chemical oxygen demand (COD), and acid volatile sulfide (AVS) in surface sediment of the study region. The solid and dotted lines represent the guideline values of COD and AVS applied in Japan, respectively, for evaluating the sediment pollution.
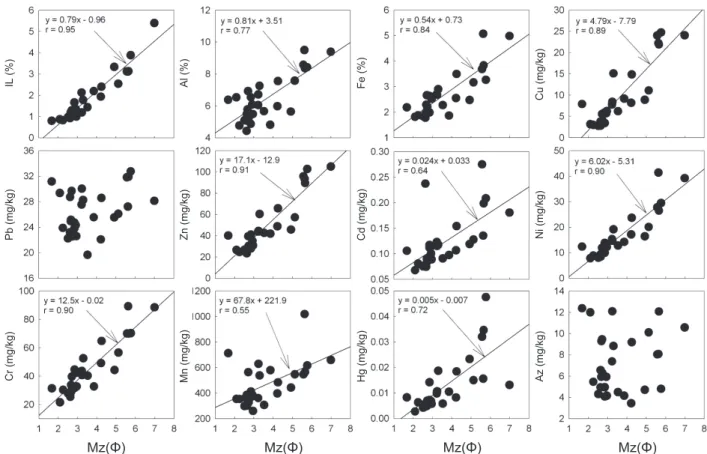
Fig. 4. Plots of mean grain size (Mz) versus ignition loss (IL) and trace metals (Al, Fe, Cu, Pb, Zn, Cd, Ni, Cr, Mn, Hg, and As) in sediment around Geum River estuary.
Fig. 5. The concentrations of trace metals with each station in the surface sediment of the study region. The solid and dotted lines repr the values of effect range low (ERL) in the United States and threshold effects level (TEL) in Korea, respectively,
guidelines for evaluating trace metals pollution in sediment.
0 2 4 6 8 10
0 1 2 3 4 5 6 7 8 9 10111213141516171819202122232425262728 5
10 15 20
25 0
2 4 6 8
0.0 0.2 0.4 0.6 0.8 1.0
36°10'36°00'35°50'N
126°20' 126°30' 126°40'E
36°10'36°00'35°50'N
Mz(Φ) COD (mg02-dry)
IL(%)AVS (mgS/g-dry)
126°20'
Station Number
126°30' 126°40'E
CODAVS MzIL
Seocheon
Gunsan
Gimje Buan
IL (%) Al (%) Fe (%) Cu (mg/kg)
Pb (mg/kg) Zn (mg/kg) Cd (mg/kg) Ni (mg/kg)
Cr (mg/kg) Mn (mg/kg) Hg (mg/kg) Az (mg/kg)
Mz(Φ) Mz(Φ) Mz(Φ) Mz(Φ)
Al (%) Fe (%)
Cu (mg/kg) Cd (mg/kg) Pb (mg/kg)
Hg (mg/kg) As (mg/kg) Cr (mg/kg) Mn (mg/kg) Zn (mg/kg) Ni (mg/kg)
Station No. Station No.
Station No.
Fig. 1. A map showing the study area and the sampling stations for analyzing the trace metals in the surface sediment around Geum River estuary.
황동운
ㆍ
이인석ㆍ
최민규ㆍ
김숙양ㆍ
최희구932
방향은북동
-
남서방향이우세하며최강유속은2 m/sec
이상이 다(Choi, 1993b).
강한조석현상에 의해하구역내에대규모조석사주인 대죽 사주가발달하여금강본류의담수는장항쪽의북수로와군산
쪽의남수로로양분되어해양으로유입된다
(Choi, 1993b).
또한
,
군산외항개발로인해군산쪽의갯벌이상당히감소하였지 만서천장항쪽으로넓은갯벌이발달해있으며특히,
군산외항앞쪽유부도및서천연안갯벌은
2008
년연안습지보호지역(coastal wetland protected area)
으로지정되어정부에서지속 적인관리가이루어지고있다(http://www.tidalfl at.go.kr).
유역 의지질은주로선캄브리아기의변성암복합체와중생대화강 암체로구성되어져있으며옥천대의변성퇴적암도금강을따라 넓게분포하고있다(Choi et al., 1996).
시료채취 및 분석방법
금강하구퇴적물중미량금속의분포특성및오염현황을파악 하기위하여
2008
년7
월국립수산과학원탐구18
호를이용하여 하구둑에서부터군산외항바깥쪽서천-
고군산군도인근해역까 지총28
개정점에서채니기(van Veen grab sampler)
로표층(0-2 cm)
퇴적물을채취하였다(Fig. 1).
채취한시료는미리산 세척한고밀도폴리에틸렌병(high density polyethylene bottle)
에담아냉동상태로실험실로운반하여입도(grain size)
와강 열감량(ignition loss, IL),
화학적산소요구량(chemical oxygen demand, COD),
산휘발성황화물(acid volatile sulfi de, AVS)
및 미량금속(Al, Fe, Cu, Pb, Zn, Cd, Ni, Cr, Mn, Hg, and As)
을Hwang et al. (2011)
이실시한동일한방법으로분석하였다.
분 석방법을간략히설명하면,
입도는Ingram (1971)
의표준입도 분석방법에따라유기물과탄산염을 제거한퇴적물을4Ø
표 준체로물체질을하여조립질과세립질퇴적물을분리한다음 조립질퇴적물은진탕기(Ro-tap sieve shaker, Fritsch, Model- Analysette 3)
를이용하여건식체질(dry sieving)
을,
세립질퇴 적물은피펫팅법으로처리한후무게를측정하여퇴적물조성 을알아내었고Folk and Ward (1957)
의계산식으로평균입도(mean grain size, Mz)
를구하였으며Folk (1968)
의삼각좌표 를이용하여퇴적상을 분류하였다. IL
은퇴적물의 회화전후 의 무게차이로, COD
는 알카리성 과망간산칼륨(KMnO
4)
법, AVS
는황화수소검지관법으로분석하였다.
미량금속은퇴적 물을동결건조한후플라스틱재질의체(Ø < 63 μm)
를이용하여체를통과한퇴적물을 회수하여혼합산
(HNO
3:HF:HClO
4= 2:2:1)
을이용한완전분해법으로퇴적물을용해한다음2%
질산
(HNO
3)
으로정용한후수은을제외한미량금속은유도결 합플라즈마질량분석기(ICP-MS, Perkin Elmer, Model-Elan
9000)
로분석하였다.
수은의경우에는동결건조한퇴적물시료를직접수은자동분석기
(Mercury analyzer, Milestone, Model
DMA-80)
로분석하였다.
이때,
미량금속자료의신뢰성을확보하기위하여인증표준물질을시료와함께분석하였고
,
인증표준물질
(certifi ed reference material)
로는MESS-3 (marine sediment, NRC)
를 이용하였다.
각 미량금속의 회수율은Al 97%, Fe 104%, Cu 105%, Pb 105%, Zn 94%, Cd 104%, Ni 106%, Cr 98%, Mn 99%, Hg 100%, As 106%
로서90-110%
사이범위였다
.
결과 및 고찰
하구 퇴적물의 조성 및 분포
퇴적물의입도는퇴적학적관점에서퇴적지부근의파도
,
조 석등과같은해수의수리·
역학적해양환경특성을반영하는중 요한인자이며(Lee et al., 2004),
퇴적물중유기물과미량금속 의농도분포를조절하는요인중에하나이다(Cho et al., 2001;
Hwang and Kim, 2011) .
따라서,
하구역과같이강물의유출과 조석에따른해수유동의변화에의한물리화학적해양환경이 급격하게변화하는해역에서유기물및미량금속의농도분포와 오염을평가하기위해서는무엇보다퇴적물의입도조성및분 포를파악할필요가있다.
금강하구퇴적물중자갈
,
모래,
실트,
점토함량은각각0.0- 3.0% (
평균0.3±0.8%), 21.5-98.9% (
평균77.3±23.5%), 0.4- 59.7% (
평균14.3±16.1%), 0.6-25.7% (
평균8.1±7.7%)
범위 였다.
자갈은개야도인근St. 10
과금강하구입구쪽의St. 12
에 서약3%
의조성을보일뿐그외정점에서는나타나지않았으며
,
실트와점토의함량이50%
이상을보인군산외항과산업단지앞쪽의
St. 6-8,
개야도인근의St. 10
과서천연안쪽의St.
26
정점을제외한거의모든정점에서모래가약70%
이상으로가장높은함량을나타내었다
.
각정점별퇴적물조성을기초 로Folk (1968)
의삼각좌표에표시한결과총8
개의퇴적물유 형(sedimentary type)
으로분류되었다.
연구해역내퇴적물분 포를살펴보면, St. 8
은사질실트(sandy silt, sZ), St. 6
와St.26
은사질니(sandy mud, sM), St. 7
와St. 10
은약역질니[slightly gravely mud, (g)M], St. 5
와St.16
은약역질사[slightly grav- elly sand, (g)S], St. 1
와St. 12
는약역니질사[slightly gravelly muddy sand, (g)mS], St. 14
와St. 19
는실트질사(silty sand, zS), St. 2, 4, 15, 18, 24, 25, 27
은니질사(muddy sand, mS)
였고그외나머지정점들은모두사
(sand, S)
퇴적물로이루어져있었다
(Fig. 2).
하구둑부근의정점들은니가함유된사질퇴적물
(mS),
새만금방조제앞쪽에실트가함유된사질퇴적물(zS),
군산산업단지바깥쪽해역의정점들에서는사퇴적물(S)
이우 세하게분포하여전반적으로조립질의사퇴적물이연구해역내 넓게분포하는것으로나타났다.
하지만,
군산외항및산업단지 와도류제사이의수로내정점들에서는다른해역과달리상대 적으로세립한니질퇴적물[sZ, sM, (g)M]
이분포하였다.
이는 하구둑건설및산업단지북쪽으로유부도에서부터외해역으로 도류제설치로인하여이해역내조류의유속이현저히감소함 으로서세립질퇴적물이퇴적되었기때문인것으로생각된다.
금강하구역
933
이전에
Choi et al. (2002)
은금강하구둑건설에따른해수유동 의변화로인해연구해역의St. 5
과St. 9
사이에서강물과해수 가만나급격한염분변화를보이는염분전선이형성된다고하 였으며, Choi et al. (1995b)
은하구언갑문폐쇄이후저에너지 의환경조건으로변하여금강하구역에육상에서바다쪽으로 공급·
운반되는세립질부유물질의지속적인퇴적이일어날것 으로보고하였다.
퇴적물의Mz
는1.7-7.0Ø (
평균3.6±1.4Ø)
범위였으며,
실트와점토의함량이높았던군산외항과산업단지앞쪽
,
서천연안쪽의일부정점을제외하면대부분이2-4Ø
로중립사
(medium sand)
와극세립사(very fi ne sand)
사이였 다(Fig. 3).
하구 퇴적물중 유기물 함량 및 오염현황
해저퇴적물중유기물량은퇴적환경특성및오염을평가하는 중요한척도중에하나이다
.
연구해역내퇴적물중유기물분포 특성을파악하기위하여표층퇴적물중IL
함량을Fig. 3
에나타 내었다.
퇴적물중IL
은0.8-5.4% (
평균1.9±1.1%)
범위였으 며서천연안의St. 26
에서가장높고장항제련소앞쪽의St. 3
에서가장낮았다.
전반적으로대부분이2.0%
이하의낮은IL
농도를보였으나상대적으로실트와점토함량이높은군산외 항과산업단지앞쪽수로부근의St. 6-8,
개야도인근의St. 10,
연도부근의St. 15,
서천연안쪽의St. 26
에서3.0%
이상으로다른정점들에비해높은농도를보였다
.
이는연구해역내퇴적 물의평균입도와IL
의농도사이에좋은양의상관성(r = 0.95)
을보인다는사실에비추어볼때
(Fig. 4),
퇴적물중유기물함량이입도와밀접한관련이있으며이들에의해분포양상이달 라지는것으로생각된다
.
퇴적물중
COD
와AVS
는퇴적물내유기물오염및건강도를평 가하는기준으로서널리이용되어져왔으며(Yoon, 2000; Hyun et al., 2003, 2004),
이연구에서도퇴적물중유기물오염을평가 하기위하여COD
와AVS
농도를이용하였다.
연구해역내COD
와AVS
농도는각각1.2-13.0 mgO
2/g·dry (
평균4.4±3.3 mgO
2/ g·dry),
불검출-0.70 mgS/g·dry (
평균0.006±0.049 mgS/g·dry)
범위였다(Fig. 3). COD
의경우군산외항앞쪽의St. 6
에서가장 높고인접한St. 5
에서가장낮았다.
전반적으로IL
함량이높았던군산내항앞쪽의
St. 1,
군산외항과산업단지앞쪽수로부근의St. 6-8,
개야도인근의St. 10,
연도부근의St. 15,
산업단지바깥 쪽의St. 18
과St. 24,
서천연안쪽의St. 26
에서7.0 mgO
2/g·dry
이상으로다른정점들에비해
COD
농도가높았다. AVS
의경우에는가장높은
COD
농도를보였던군산외항앞쪽의St. 6
에 서가장높았으며산업단지앞쪽의일부정점을제외한거의모 든정점에서검출되지않거나0.005 mgS/g·dry
이하의낮은농 도를나타내었다.
한편
,
우리나라의해양환경기준중퇴적물내COD
와AVS
에 대한기준이없어이연구에서는연구해역의퇴적물중유기물 오염정도를파악하기위하여일본의퇴적물기준을적용하였 다.
일본에서수산생물의보호를위하여생물에영향을주는기 준농도로서COD
와AVS
에대하여각가20 mgO
2/g·dry
과0.2
Fig. 2. The sedimentary type of surface sediment around GeumRiver estuary (Abbreviations: sZ - sandy silt; (g)M - slightly grav- elly mud; sM - sandy mud; S - sand; zS - silty sand; mS – muddy sand; (g)S – slightly gravelly sand; (g)mS - slightly gravelly muddy sand).
Fig. 3. Mean grain size (Mz) and the concentrations of ignition loss (IL), chemical oxygen demand (COD), and acid volatile sul- fi de (AVS) in surface sediment of the study region. The solid and dotted lines represent the guideline values of COD and AVS ap- plied in Japan, respectively, for evaluating the sediment pollution.
Fig. 1. A map showing the study area and the sampling stations for analyzing the trace metals in the surface sediment around Geum River estuary.
Fig. 2. The sedimentary type of surface sediment around Geum River estuary (Abbreviations:
sZ - sandy silt; (g)M - slightly gravelly mud; sM - sandy mud; S - sand; zS - silty sand; mS – muddy sand; (g)S – slightly gravelly sand; (g)mS - slightly gravelly muddy sand).
Fig. 3. Mean grain size (Mz) and the concentrations of ignition loss (IL), chemical oxygen demand (COD), and acid volatile sulfide (AVS) in surface sediment of the study region. The solid and dotted lines represent the guideline values of COD and AVS applied in Japan, respectively, for evaluating the sediment pollution.
Fig. 4. Plots of mean grain size (Mz) versus ignition loss (IL) and trace metals (Al, Fe, Cu, Pb, Zn, Cd, Ni, Cr, Mn, Hg, and As) in sediment around Geum River estuary.
Fig. 5. The concentrations of trace metals with each station in the surface sediment of the study region. The solid and dotted lines repr the values of effect range low (ERL) in the United States and threshold effects level (TEL) in Korea, respectively,
guidelines for evaluating trace metals pollution in sediment.
0 2 4 6 8 10
0 1 2 3 4 5 6 7 8 9 10111213141516171819202122232425262728 5
10 15 20
25 0
2 4 6 8
0.0 0.2 0.4 0.6 0.8 1.0
36°10'36°00'35°50'N
126°20' 126°30' 126°40'E
36°10'36°00'35°50'N
Mz(Φ) COD (mg02-dry)
IL(%)AVS (mgS/g-dry)
126°20'
Station Number
126°30' 126°40'E
CODAVS MzIL
Seocheon
Gunsan
Gimje Buan
IL (%) Al (%) Fe (%) Cu (mg/kg)
Pb (mg/kg) Zn (mg/kg) Cd (mg/kg) Ni (mg/kg)
Cr (mg/kg) Mn (mg/kg) Hg (mg/kg) Az (mg/kg)
Mz(Φ) Mz(Φ) Mz(Φ) Mz(Φ)
Al (%) Fe (%)
Cu (mg/kg) Cd (mg/kg) Pb (mg/kg)
Hg (mg/kg) As (mg/kg) Cr (mg/kg) Mn (mg/kg) Zn (mg/kg) Ni (mg/kg)
Station No. Station No.
Station No.
Fig. 1. A map showing the study area and the sampling stations for analyzing the trace metals in the surface sediment around Geum River estuary.
Fig. 2. The sedimentary type of surface sediment around Geum River estuary (Abbreviations:
sZ - sandy silt; (g)M - slightly gravelly mud; sM - sandy mud; S - sand; zS - silty sand; mS – muddy sand; (g)S – slightly gravelly sand; (g)mS - slightly gravelly muddy sand).
Fig. 3. Mean grain size (Mz) and the concentrations of ignition loss (IL), chemical oxygen demand (COD), and acid volatile sulfide (AVS) in surface sediment of the study region. The solid and dotted lines represent the guideline values of COD and AVS applied in Japan, respectively, for evaluating the sediment pollution.
Fig. 4. Plots of mean grain size (Mz) versus ignition loss (IL) and trace metals (Al, Fe, Cu, Pb, Zn, Cd, Ni, Cr, Mn, Hg, and As) in sediment around Geum River estuary.
Fig. 5. The concentrations of trace metals with each station in the surface sediment of the study region. The solid and dotted lines repr the values of effect range low (ERL) in the United States and threshold effects level (TEL) in Korea, respectively,
guidelines for evaluating trace metals pollution in sediment.
0 2 4 6 8 10
0 1 2 3 4 5 6 7 8 9 10111213141516171819202122232425262728 5
10 15 20
25 0
2 4 6 8
0.0 0.2 0.4 0.6 0.8 1.0
36°00'35°50'N
126°20' 126°30' 126°40'E
36°10'36°00'35°50'N
Mz(Φ) COD (mg02-dry)
IL(%)AVS (mgS/g-dry)
126°20'
Station Number
126°30' 126°40'E
CODAVS MzIL
Seocheon
Gunsan
Gimje Buan
IL (%) Al (%) Fe (%) Cu (mg/kg)
Pb (mg/kg) Zn (mg/kg) Cd (mg/kg) Ni (mg/kg)
Cr (mg/kg) Mn (mg/kg) Hg (mg/kg) Az (mg/kg)
Mz(Φ) Mz(Φ) Mz(Φ) Mz(Φ)
Al (%) Fe (%)
Cu (mg/kg) Cd (mg/kg) Pb (mg/kg)
Hg (mg/kg) As (mg/kg) Cr (mg/kg) Mn (mg/kg) Zn (mg/kg) Ni (mg/kg)
Station No. Station No.
Station No.
황동운
ㆍ
이인석ㆍ
최민규ㆍ
김숙양ㆍ
최희구934
mgS/g·dry
를설정해놓고있다(Yokoyama, 2000).
이기준을 적용하였을때,
연구해역내퇴적물중COD
는모든정점에서 일본의퇴적물기준보다낮았으며대부분의정점에서1/3
이하 의낮은농도수준이었다. AVS
또한군산내항인근의St. 2
과군산외항과산업단지앞쪽수로의
St. 6-7
에서일본의퇴적물기준을초과하는것으로나타났으나대부분의정점에서
1/50
이 하의낮은농도를수준을보였다.
또한,
연구해역의IL, COD, AVS
농도를이전의연구결과와비교해보면(Table 1),
연구해 역인근의변산반도(Jung et al., 2010)
와새만금안쪽(Kim et al., 2003)
조간대퇴적물에서측정된IL, COD, AVS
농도보다 는비슷하거나다소높았으나,
우리나라의대표적인항만인부 산항(Park et al., 1995)
과마산항(Hwang et al., 2006),
그리고 양식활동이 활발한반폐쇄적인 내만인 득량만(Yoon, 2003),
여자만(Hue et al., 2000),
가막만(Noh et al., 2006),
함평만(Hwang and Koh, 2012)
보다는낮았다.
따라서,
연구해역인 금강하구퇴적물은유기물에대하여우려할만큼오염이진행 되지않은것으로생각된다.
하구 퇴적물중 미량금속 함량 및 오염현황
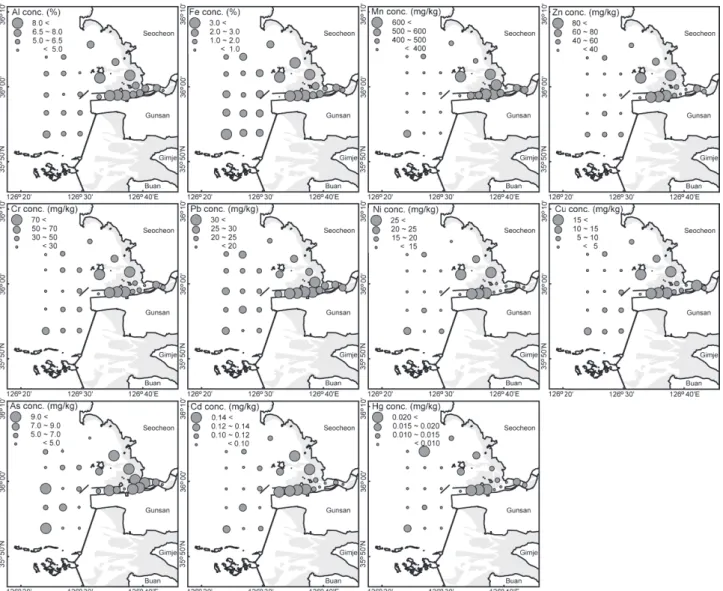
연구해역내 퇴적물중 미량금속 분포특성을 파악하기 위하
여 표층퇴적물중 각정점별미량금속 농도를
Fig. 5
에나타내었다
.
퇴적물중미량금속은알루미늄(Al)
은4.4-9.5% (
평균6.4±1.4%),
철(Fe)
은1.7-5.1% (
평균2.7±0.9%),
망간(Mn)
은260-1,020 mg/kg (
평균467±167 mg/kg),
아연(Zn)
은23- 106 mg/kg (
평균49±26 mg/kg),
크롬(Cr)
은21.6-89.2 mg/
kg (
평균45.1±9.1 mg/kg),
니켈(Ni)
은7.8-41.4 mg/kg(
평균16.5±9.1 mg/kg),
구리(Cu)
는2.8-24.7 mg/kg (
평균9.5±7.3 mg/kg),
납(Pb)
은19.7-32.8 mg/kg (
평균26.5±3.4 mg/kg),
비 소(As)
는3.4-12.4 mg/kg (
평균7.3±2.9 mg/kg),
카드뮴(Cd)
은0.06-0.28 mg/kg (
평균0.12±0.05 mg/kg),
수은(Hg)
은0.003-0.048 mg/kg (
평균0.013±0.011 mg/kg)
범위였으며평 균농도를기준으로Al > Fe > Mn > Zn > Cr > Pb > Ni > Cu >
As > Cd > Hg
순으로높은농도를나타내었다. IL
과유사하게 거의모든미량금속들이상대적으로점토와실트함량이높았 던군산외항과산업단지앞쪽수로부근,
개야도인근,
서천연 안의일부정점들에서다른정점들에비해2
배이상높은농도 를보였다(Fig. 6).
특히, Pb
과As
를제외한모든미량금속들이Mz
와좋은양의상관성을보였다(r =0.55-0.91; Fig. 4).
일반적 으로연안해역에서퇴적물중금속원소의농도는주로퇴적물의 입도와쇄설성광물의영향을크게받는것으로알려져있으며 Fig. 4. Plots of mean grain size (Mz) versus ignition loss (IL) and trace metals (Al, Fe, Cu, Pb, Zn, Cd, Ni, Cr, Mn, Hg, and As) in surface sediment around Geum River estuary.Fig. 1. A map showing the study area and the sampling stations for analyzing the trace metals in the surface sediment around Geum River estuary.
Fig. 2. The sedimentary type of surface sediment around Geum River estuary (Abbreviations:
sZ - sandy silt; (g)M - slightly gravelly mud; sM - sandy mud; S - sand; zS - silty sand; mS – muddy sand; (g)S – slightly gravelly sand; (g)mS - slightly gravelly muddy sand).
Fig. 3. Mean grain size (Mz) and the concentrations of ignition loss (IL), chemical oxygen demand (COD), and acid volatile sulfide (AVS) in surface sediment of the study region. The solid and dotted lines represent the guideline values of COD and AVS applied in Japan, respectively, for evaluating the sediment pollution.
Fig. 4. Plots of mean grain size (Mz) versus ignition loss (IL) and trace metals (Al, Fe, Cu, Pb, Zn, Cd, Ni, Cr, Mn, Hg, and As) in sediment around Geum River estuary.
Fig. 5. The concentrations of trace metals with each station in the surface sediment of the study region. The solid and dotted lines repr the values of effect range low (ERL) in the United States and threshold effects level (TEL) in Korea, respectively,
guidelines for evaluating trace metals pollution in sediment.
0 2 4 6 8 10
0 1 2 3 4 5 6 7 8 9 10111213141516171819202122232425262728 5
10 15 20
25 0
2 4 6 8
0.0 0.2 0.4 0.6 0.8 1.0
36°10'36°00'35°50'N
126°20' 126°30' 126°40'E
36°10'36°00'35°50'N
Mz(Φ) COD (mg02-dry)
IL(%)AVS (mgS/g-dry)
126°20'
Station Number
126°30' 126°40'E
CODAVS MzIL
Seocheon
Gunsan
Gimje Buan
IL (%) Al (%) Fe (%) Cu (mg/kg)
Pb (mg/kg) Zn (mg/kg) Cd (mg/kg) Ni (mg/kg)
Cr (mg/kg) Mn (mg/kg) Hg (mg/kg) Az (mg/kg)
Mz(Φ) Mz(Φ) Mz(Φ) Mz(Φ)
Al (%) Fe (%)
Cu (mg/kg) Cd (mg/kg) Pb (mg/kg)
Hg (mg/kg) As (mg/kg) Cr (mg/kg) Mn (mg/kg) Zn (mg/kg) Ni (mg/kg)
Station No. Station No.
Station No.
금강하구역
935
Fig. 5. The concentrations of trace metals with each station in the surface sediment of the study region. The solid and dotted lines represent the values of effect range low (ERL) in the United States and threshold effects level (TEL) in Korea, respectively, as the sediment quality guidelines for evaluating trace metals pollution in sediment
Table 1. The content of ignition loss (IL) and the concentrations of chemical oxygen demand and acid volatile sulfi de (AVS) in surface sediment around Geum River estuary. The parenthesis represents the average of each paramenter in surface sediment
Study region Sampling zone IL
(%) COD
(mgO2/g·dry) AVS
(mgS/g·dry) Reference Coastal sea of Korea Sublittoral zone 1.4-10.8 (6.7) 3.2-21.7 (12.4) ND*-1.12(0.24) Kang et al. (1993) Pusan Harbor Sublittoral zone 6.3-18.5 (12.1) 5.1-43.7 (17.5) 0.06-4.37 (1.18) Park et al. (1995) Masan Harbor Sublittoral zone 7.2-14.3 (11.2) 11.3-29.9 (19.6) 0.20-4.47 (1.83) Hwang et al. (2006) Deukryang Bay Sublittoral zone 3.1-21.5 (5.6) 0.4-18.2 (5.7) ND-3.30 (0.36) Yoon (2003) Yeoja Bay Sublittoral zone 6.2-12.2 (8.9) 5.5-29.7 (13.2) 0.02-0.10 (0.05) Hue et al. (2000) Gamak Bay Sublittoral zone 4.6-11.6 (7.1) 2.3-99.3 (31.0) ND-10.3 (1.02) Noh et al. (2006) Hampyeong Bay Intertidal zone 1.6-9.0 (4.5) 1.1-14.4 (8.1) ND-0.15 (0.01) Hwnag and Koh (2012) Byeonsan Peninsula Intertidal zone 0.2-2.8 (1.4) 0.2-18.5 (3.9) ND Jung et al. (2010) Saemanguem (inner) Intertidal zone 0.5-5.8 (2.2) 1.0-10.8 (3.5) 0.10-1.56 (0.75) Kim et al. (2003) Geum River Estuary Sublittoral zone 0.8-5.4 (1.9) 1.2-13.0 (4.4) ND-0.70 (0.01) This study
*ND : Not detected.
Fig. 1. A map showing the study area and the sampling stations for analyzing the trace metals in the surface sediment around Geum River estuary.
Fig. 2. The sedimentary type of surface sediment around Geum River estuary (Abbreviations:
sZ - sandy silt; (g)M - slightly gravelly mud; sM - sandy mud; S - sand; zS - silty sand; mS – muddy sand; (g)S – slightly gravelly sand; (g)mS - slightly gravelly muddy sand).
Fig. 3. Mean grain size (Mz) and the concentrations of ignition loss (IL), chemical oxygen demand (COD), and acid volatile sulfide (AVS) in surface sediment of the study region. The solid and dotted lines represent the guideline values of COD and AVS applied in Japan, respectively, for evaluating the sediment pollution.
Fig. 4. Plots of mean grain size (Mz) versus ignition loss (IL) and trace metals (Al, Fe, Cu, Pb, Zn, Cd, Ni, Cr, Mn, Hg, and As) in sediment around Geum River estuary.
Fig. 5. The concentrations of trace metals with each station in the surface sediment of the study region. The solid and dotted lines repr the values of effect range low (ERL) in the United States and threshold effects level (TEL) in Korea, respectively,
guidelines for evaluating trace metals pollution in sediment.
0 2 4 6 8 10
0 1 2 3 4 5 6 7 8 9 10111213141516171819202122232425262728 5
10 15 20
25 0
2 4 6 8
0.0 0.2 0.4 0.6 0.8 1.0
36°00'35°50'N
126°20' 126°30' 126°40'E
36°10'36°00'35°50'N
Mz(Φ) COD (mg02-dry)
IL(%)AVS (mgS/g-dry)
126°20'
Station Number
126°30' 126°40'E
CODAVS MzIL
Seocheon
Gunsan
Gimje Buan
IL (%) Al (%) Fe (%) Cu (mg/kg)
Pb (mg/kg) Zn (mg/kg) Cd (mg/kg) Ni (mg/kg)
Cr (mg/kg) Mn (mg/kg) Hg (mg/kg) Az (mg/kg)
Mz(Φ) Mz(Φ) Mz(Φ) Mz(Φ)
Al (%) Fe (%)
Cu (mg/kg) Cd (mg/kg) Pb (mg/kg)
Hg (mg/kg) As (mg/kg) Cr (mg/kg) Mn (mg/kg) Zn (mg/kg) Ni (mg/kg)
Station No. Station No.
Station No.
황동운
ㆍ
이인석ㆍ
최민규ㆍ
김숙양ㆍ
최희구936
(Cho and Park, 1998; Cho et al., 2001; Hwang et al., 2010),
이 전에Choi et al. (1996)
은금강하천퇴적물중미량금속함량이 평균입도와밀접한관련이있고,
다른금속과달리Pb
은조립질 모래에서높은농도를보이는데이는모래에많이함유된정장 석에의한영향때문이라고보고하였다.
또한금강유역주변에 넓게분포하고있는옥천대의변성퇴적암류에는황철석,
황동 석,
유비철석등황화광석광물들을포함하고있어높은비소함 량을보인다(Chon et al., 2009).
따라서,
연구해역내퇴적물중 미량금속의농도분포는유기물과마찬가지로퇴적물내입도의 영향을받고있으나Pb
과As
의경우에는퇴적물내암석물질중 금속함량과밀접한관련이있는것으로생각된다.
한편,
연구 해역내퇴적물중미량금속농도는이전에Choi et al. (1995a)
이측정한금강부유물질중미량금속농도
(Al 9.7%, Fe, 5.2%, Mn 6,700 mg/kg, Cu 54 mg/kg, Pb 79 mg/kg, Zn 327 mg/kg, Cd 0.85 mg/kg, Cr 98 mg/kg, Ni 58 mg/kg)
보다낮았다.
일반적으로퇴적물내금속원소의오염에대한평가는주로각 나라별로설정해놓은금속원소의오염기준
(sediment quality guidelines; SQGs)
이나혹은분석된금속원소의농도를지각물 질중의자연적인배경농도와연구해역의오염되지않은퇴적 물중의미량금속농도를이용하여수치적으로환산한값을비 교하는농축계수(enrichment factor)
와농집지수(geoaccumu- lation index),
농축부화비(cocnetration enrichment ratios),
오 염지수(contamination index)
등다양한방법이있다(Bruland et al., 1974; Müller, 1979; Prusty et al., 1994; Sutherland,
Fig. 6. The horizontal distributions of trace metal (Al, Fe, Mn, Zn, Cr, Pb, Ni, Cu, As, Cd, and Hg) concentrations in surface sediment around Guem River estuary.Fig. 1. A map showing the study area and the sampling stations for analyzing the trace metals in the surface sediment around Geum River estuary.
Fig. 2. The sedimentary type of surface sediment around Geum River estuary (Abbreviations:
sZ - sandy silt; (g)M - slightly gravelly mud; sM - sandy mud; S - sand; zS - silty sand; mS – muddy sand; (g)S – slightly gravelly sand; (g)mS - slightly gravelly muddy sand).
Fig. 3. Mean grain size (Mz) and the concentrations of ignition loss (IL), chemical oxygen demand (COD), and acid volatile sulfide (AVS) in surface sediment of the study region. The solid and dotted lines represent the guideline values of COD and AVS applied in Japan, respectively, for evaluating the sediment pollution.
Fig. 4. Plots of mean grain size (Mz) versus ignition loss (IL) and trace metals (Al, Fe, Cu, Pb, Zn, Cd, Ni, Cr, Mn, Hg, and As) in sediment around Geum River estuary.
Fig. 5. The concentrations of trace metals with each station in the surface sediment of the study region. The solid and dotted lines repr the values of effect range low (ERL) in the United States and threshold effects level (TEL) in Korea, respectively,
guidelines for evaluating trace metals pollution in sediment.
0 2 4 6 8 10
0 1 2 3 4 5 6 7 8 9 10111213141516171819202122232425262728 5
10 15 20
25 0
2 4 6 8
0.0 0.2 0.4 0.6 0.8 1.0
36°10'36°00'35°50'N
126°20' 126°30' 126°40'E
36°10'36°00'35°50'N
Mz(Φ) COD (mg02-dry)
IL(%)AVS (mgS/g-dry)
126°20'
Station Number
126°30' 126°40'E
CODAVS MzIL
Seocheon
Gunsan
Gimje Buan
IL (%) Al (%) Fe (%) Cu (mg/kg)
Pb (mg/kg) Zn (mg/kg) Cd (mg/kg) Ni (mg/kg)
Cr (mg/kg) Mn (mg/kg) Hg (mg/kg) Az (mg/kg)
Mz(Φ) Mz(Φ) Mz(Φ) Mz(Φ)
Al (%) Fe (%)
Cu (mg/kg) Cd (mg/kg) Pb (mg/kg)
Hg (mg/kg) As (mg/kg) Cr (mg/kg) Mn (mg/kg) Zn (mg/kg) Ni (mg/kg)