Kor J Fish Aquat Sci 47(6),1006-1013,2014
한수지 47(6), 1006-1013, 2014Original Article
1006
Copyright © 2014 The Korean Society of Fisheries and Aquatic Science pISSN:0374-8111, eISSN:2287-8815
서 론
부산수영강은온천천
,
동래천,
석대천의지류를가지고있으 며,
총연장28 km,
폭50-90 m
이고전체면적은200 km 2
에달 하며,
동해바다로직접연결된다.
수영강하구역(estuary)
주변 은주거지역,
상업지역,
공업지역이혼재된지역으로,
주변에대 형주거단지가건설됨에따라도시화되면서오염화가가중된대 표적인지역이다(Kwon et al., 2008).
수영강하구역에는중대 형인수영(SY)
과동부(DB)
하수처리장이위치하고있고,
방류 수는수영강을통해연안으로배출된다(ME, 2012). SY
하수처 리장은1985
년에건설되었으며,
하루에452,000
톤의하수를 처리하는부산에서가장큰하수처리장중하나이며
,
표준활성 슬러지법(activated sludge treatment process)
으로처리후방류수를배출하고있다
. DB
하수처리장은2007
년에건설되었으며
,
하루에135,000
톤의하수를처리하고있으며,
최종처리방법은생물막여과법
(biofilm filteration process)
을 이용하고 있다.
또한,
수영강하구역은동래구,
수영구,
해운대구가위치 하고있으며,
이들의하수관거보급율은46-51%
으로전국평 균73%
에크게낮고,
우수관거보급률은2.4-18.9%
로전국평 균59%
에크게낮은수준으로도시하수(municipal effluents)
로인한오염이우려된다(ME, 2012). Kim et al. (2009)
은수영 강수계퇴적물조사결과에서수영강중류지역은중금속과총 인이미국환경청의퇴적물기준을초과하는수준의오염도를보 고한바있다. Jeon et al. (2010)
의저서성대형무척추동물과어 류를이용해수영강중류수생태건강성을평가한연구결과에 따르면,
약간나쁨(B
등급)-
아주나쁨(D
등급)
수준으로평가되었 지만,
수영강하구역에서환경오염도에대한연구는현재매우 미비한실정이다.
따라서하수처리장방류수뿐만아니라다양 한하수가유입하는수영강하구역에서도시하수로인한오염 도를평가하는것은매우중요하다.
하수처리장 방류수역에서 분변계스테롤과 노닐페놀류의 분포 특성
백승홍·윤세라·이인석·황동운·최민규*
국립수산과학원 기반연구부 어장환경과
Distribution of Fecal Sterols and Nonylphenolic Compounds in Sediments from Busan Suyeong Estuary, Impacted by Wastewater
Treatment Plant Effluents
Seung-Hong Baek, Sera Yoon, In-Seok Lee, Dong-Woon Hwang and Minkyu Choi*
Marine Environment Research Division, National Fisheries Research and Development Institute, Busan 619-705, Korea Wastewater organic compounds, that is, nonylphenolic compounds (NPs) and fecal sterols, were measured in surface sediments from Busan Suyeong Estuary, where two wastewater treatment plants (WWTPs) are located, to assess contamination from municipal effluents. The NPs analyzed were nonylphenol, and nonylphenol mono- and di-ethox- ylates, all synthetic endocrine disruptors. The fecal sterols analyzed were coprostanol (COP), cholestanol, and epico- prostanol. Concentrations of NPs in the sediments ranged from 146 to 3,723 ng/g, and those of COP ranged from 366 to 13,018 ng/g. Their detection in all of the sediments analyzed indicates widespread pollution by municipal effluents.
The highest concentrations of NPs and COP were detected at stations close to outfalls of WWTPs. Their levels in sediments are categorized in the higher range of those previously reported in Korean coastal areas. Moreover, in comparison with screening values of NPs in the Netherlands, Norway, and Canada, more than 50% of the sampling stations exceeded the guidelines. This indicates that the estuary may be adversely influenced by municipal effluents.
Key words: Sewage, Nonylphenol, Coprostanol, Wastewater treatment plant, Ecotoxicology
This is an Open Access article distributed under the terms of the Creative Commons Attribution Non-Commercial Licens (http://creativecommons.org/licenses/by-nc/3.0/)which permits unrestricted non-commercial use, distribution, and reproduction in any medium, provided the original work is properly cited.
http://dx.doi.org/10.5657/KFAS.2014.1006 Kor J Fish Aquat Sci 47(6) 1006-1013, December 2014
Received 12 September 2014; Revised 3 November 2014; Accepted 6 November 2014
*Corresponding author: Tel: +82. 51. 720. 2531 Fax: +82. 51. 720. 2515
E-mail address: [email protected]
도시하수로 인한 오염을모니터링하기 위해
,
분변계스테롤(fecal sterols)
과노닐페놀류(nonylphenolic compounds; NPs)
를많이이용하고있다(Li et al., 2008; Froehner et al., 2009;
Choi et al., 2009, 2011a; Kim et al., 2010; Lee et al., 2012; Choi et al., 2014).
분변계스테롤중coprostanol (COP)
은포유류의 장에서cholesterol (CHOE)
로부터생성되는주요한분변계스 테롤로서,
인간이배설하는분변계스테롤중50-80%
를차지하 고있어서수생태계중분변오염의지시자로널리활용되고있 다(Leeming et al., 1996; Chan et al., 1998).
분변계스테롤은독 특한분포특성을가지고있어서COP
및cholestanol (CHOA)
와같은분변계스테롤과의분포특성을비교하면하수기인오염 에대한유용한정보를제공하며, COP/(COP+CHOA)
비율이0.3
이하이면비오염, 0.6
이상이면도시하수로인한오염을의미한다
(Grimalt et al., 1990). NPs
는비이온계면활성제(non- ionic surfactants)
의 분해물질(biodegradation products)
이다. NPs
는1940
년이후로가정용/
상업용세제및산업공정에널리 사용되다가유해성이보고되면서선진국을중심으로사용규 제되었다.
국내에서도2007
년부터가정용으로전면사용금지 되었지만,
현재도하수처리장방류수,
하천수,
해수,
퇴적물등 에서널리검출되고있다(Choi et al., 2011a; Lee et al., 2012;
Choi et al., 2014).
본연구에서는수영강하구역에위치한하수처리장배출구로 부터동백섬인근까지일정간격별퇴적물을채취한후
,
하수기 인오염지시자(
분변계스테롤과NPs)
를분석하여수영강의도 시하수로인한오염수준을파악하였다.
재료 및 방법
시료채취
부산수영강하구역퇴적물은
2010
년6
월에하수처리장방류 구인근부터해운대동백섬인근까지10
개정점(SY01-SY10)
에서채취하였다(Fig. 1).
퇴적물시료는van Veen grab sampler
를이용하여표층(<4 cm)
을채취하였으며,
채취된퇴적물은조 사선에서냉동하여실험실로운반하였다.
퇴적물시료는동결 건조하고균질화하여2 mm
체로걸러갈색병(amber bottle)
에 보관하였다.
분석방법
분변계스테롤과
NPs
의 분석은Choi et al. (2009, 2011a,
2014)
의분석방법과동일하게수행하였다.
분변계스테롤의분석대상성분은
COP, CHOA, CHOE, epicoprostanol (ECOP)
이며,
분변계스테롤의전처리과정은다음과같은순서로진행 하였다.
우선동결건조된퇴적물약5 g
을테프론원심분리관에 넣고,
내부표준물질1-nonadecanol (Dr. Theodor Schuchardt
& Co.)
주입후,
추출용매1:1 methylene chloride-chloroform (J.T. Baker,
잔류농약급)
으로60
분간2
회진탕하여 추출하였 다.
추출시료는질소농축하여Florisil
컬럼(60-100 mesh, Sig- ma-Aldrich, 10 g)
으로방해물질을 제거하였다.
정제된시료 액은다시질소농축후, 99:1 bis (trimethylsilyl) trifluoroacet- amide-trimethylchlorosilane (Sigma-Aldrich)
으로유도체화하Fig. 1. Sampling locations of sediments from Suyeong Estuary of Busan, Korea.
0.0
0 2 4
COP/ECOP ratio
COP/(COP+CHOA) ratio Biogenic
Source
Sewage Pollution
6 12 14
0.2 0.4 0.6 0.8 1.0
0.0
1 10 100
COP (ng/g)
COP/(COP+CHOA) ratio Biogenic
Source
Sewage Pollution
1000 10000 0.2
0.4 0.6 0.8 1.0
0.0 1 10 100
COP (ng/g)
COP/ECOP ratio
Biogenic Source
Sewage Pollution
1000 10000 2.0
4.5 6.0 12.0 14.0
a b
Concentration (ng/g)
Rank (%)
(a) NP
10 100 1000 10000
0 20 40 60 80 100
Rank (%)
10000 a
Concentration (ng/g) (b) NP 1+2 EO
10 100 1000
0 20 40 60 80 100
Rank (%)
(c) NP-TEQs
10 100 1000 10000
0 20 40 60 80 100
Concentration (ng-TEQ/g, TOC1%) c
126°00' 128°00' 130°00'
129°09' 129°11' 129°13' 129°15'E
0 50 100 km 34 °00' 35 °15' 35 °17' 35 °19'N
36 °00' 38 °00'N
KOREA
N
백승홍
ㆍ
윤세라ㆍ
이인석ㆍ
황동운ㆍ
최민규1008
여정량용시료액으로사용하였다
.
NPs
의 분석대상성분은nonylphenol (NP), nonylphenol mono- & di-ethoxylates (NP 1+2 EO)
이며, NPs
의전처리과정 은다음과같은순서로진행하였다.
테프론원심분리관에동결 건조된퇴적물약5 g
을넣고,
내부표준물질nonylphenol- 13 C 6 (Cambridge Isotope Laboratories)
을주입후, methylene chlo- ride (J.T. Baker,
잔류농약급)
로60
분간2
회진탕추출하였다.
추출시료는1 mL
까지질소농축하여활성된구리(Sigma-Al-
drich)
로황화합물을제거하였다.
황화합물이제거된추출시료는
99:1 bis (trimethylsilyl) trifluoroacetamide-trimethylchlo- rosilane
를이용하여유도체화한후, Florisil
컬럼(1 g)
으로방 해물질을제거하였다.
정제된시료액은질소농축하여정량용 시료액으로사용하였으며, gas chromatograph-mass selective detector (Agilent 6890/5973N)
로정량하였다.
분변계스테롤과
NPs
의 농도는ng/g
의 단위(
건중량; dry weight)
로나타내었다.
분석대상성분의검출한계(limit of de- tection)
는signal-to-noise ratio
의3
배로계산하였고,
분변계스 테롤의검출한계는4-14 ng/g
이었고, NPs
는1-4 ng/g
이었다.
회수율(recovery)
은5
개의sea sand (washed sea sand, Fisher Scientific)
에분변계스테롤과NPs
표준용액을spike
하여동일 한전처리방법을거친후계산하였다.
분변계스테롤의회수율 은77±14%
이었고, NPs
는104±15%
이었다.
현장퇴적물시 료에서내부표준물질nonylphenol- 13 C 6
및1-nonadecanol
의회 수율은각각81±11%, 78±9.5%
로양호한수준이었다. 총유기탄소 분석
퇴적물내총유기탄소
(Total organic carbon; TOC)
는1 N HCl (Merck, Suprapur 30%)
로calcium carbonate
를제거한후,
원 소분석기(Perkin Emler, Model 2400)
로정량하였다(Choi et al., 2011a).
결과 및 고찰
분변계스테롤
퇴적물내
COP
의농도는366-13,018 ng/g (
평균6,136 ng/g)
의 범위를 보였다(Table 1). COP
의 가장 높은 농도(13,018 ng/g)
는SY
와DB
하수처리장방류구인근SY01
정점에서조 사되었고,
가장낮은농도는외측SY10
에서조사되었다(Fig.
2a).
수영강하구역에서COP
의농도는하수처리장방류구인근에서외측으로갈수록뚜렷한감소패턴을보였다
.
한편,
하수처리장방류구의 하류에서
COP
농도가조사정점SY03
과SY05
보다SY04, SY06, SY07, SY09
에서다소증가된농도 를보였다.
이것은수영강으로유입되는합류식하수관거월류 수(combined sewer overflows: CSO)
로인한영향일수있다.
조사정점SY04
와SY06
주변에CSO
유입구가있었고,
이것은 우천시미처리된도시하수가수영강으로직접유입될수있음을의미한다
.
퇴적물내COP
농도에따라하수영향수준평가가 가능하며, COP 10 ng/g
이하의농도이면하수오염영향이없는 해역(Hatcher and McCillivary, 1979), 100 ng/g
이상의농도는 하수유입영향과상관성이있는해역(Writer et al., 1995),
그리고
500 ng/g
이상의농도는하수처리장방류수역으로하수유입에의한상당한분변및하수영향해역
(Nichols et al., 1993;
Gonzalez-Oreja and Saiz-Salinas, 1998)
으로보고된다.
본연 구에서모든정점이100 ng/g
이상이었으며, SY10
정점을제외 한9
개정점이500 ng/g
이상으로수영강하구역은분변및하 수영향해역으로확연히구분되었다.
수영강하구역중하수처리장방류구인근퇴적물
(SY01)
에서 조사된COP
의농도를국내다른연안의하수처리장방류구인 근퇴적물에서보고된자료와비교하였다(Fig. 3a).
보고된결 과들은본조사결과와같이국가해양환경측정망조사지침에따 라동일한시료채취및분석방법으로생산된자료로써,
오염수 준비교에좋은정보를제공할수있다.
하수처리장방류구인 근COP
농도는군산연안(30 ng/g; Lee et al., 2012),
안산시화 반월공단(1,300 ng/g; Choi et al., 2011a),
마산만(1,380 ng/g;
Moon et al., 2008),
목포연안(7,900 ng/g; Choi et al., 2007),
울산만(8,260 ng/g; Choi et al., 2011b)
으로 수영강 하구역(13,018 ng/g)
이국내에서가장높은수준의오염도를보였다.
국외의하수처리장방류수역결과와비교시,
본연구결과는캐 나다(150-38,000 ng/g; Mayer et al., 2007)
와미국(70-45,000 ng/g; Venkatesan et al., 2010)
보다낮은수준이였으며,
베트남(5-4,800 ng/g; Isobe et al., 2002)
보다높은수준으로나타났다.
Fig. 2. Spatial distribution of coprostanol (COP) and nonylpheno- lic compounds (the sum of nonylphenol and nonylphenolic mono-
& di-ethoxylates; ΣNP) in sediments from Suyeong Estuary of Busan. Dotted line indicates 500 ng/g.
SY01
Concentration (ng/g) Concentration (ng/g)
SY02 SY03 SY04 SY05 SY06 SY07 SY08 SY09 SY10 4,000
0 8,000 12,000 16,000
(a) COP
2,000 1,000 0 3,000 4,000 5,000
SY01 SY02 SY03 SY04 SY05 SY06 SY07 SY08 SY09 SY10 (b) ∑ NP
0 2,000 4000
Gunsan Ansan Masan Mokpo Ulsan Suyeong
6,,000 8,000 10,000 12,000 14,000
(a) COP
Concentration (ng/g)
0 1,000 2,000
Mokpo Ansan Masan Gunsan Suyeong Ulsan
3,000 4,000 5,000 6,000 7,000
(b) NP
Concentration (ng/g)
도시하수 유입으로 인한 오염도 평가
1009
분변계스테롤은 배출원에 따라 특이한 분포패턴
(profile)
을 보인다.
인간과다른 동물들(
가축,
조류및해양포유류)
의배 설물내분포분포는매우상이하고,
해양플랑크톤과식물들은COP
을전혀생성하지않는다.
따라서분변계스테롤의분포및COP
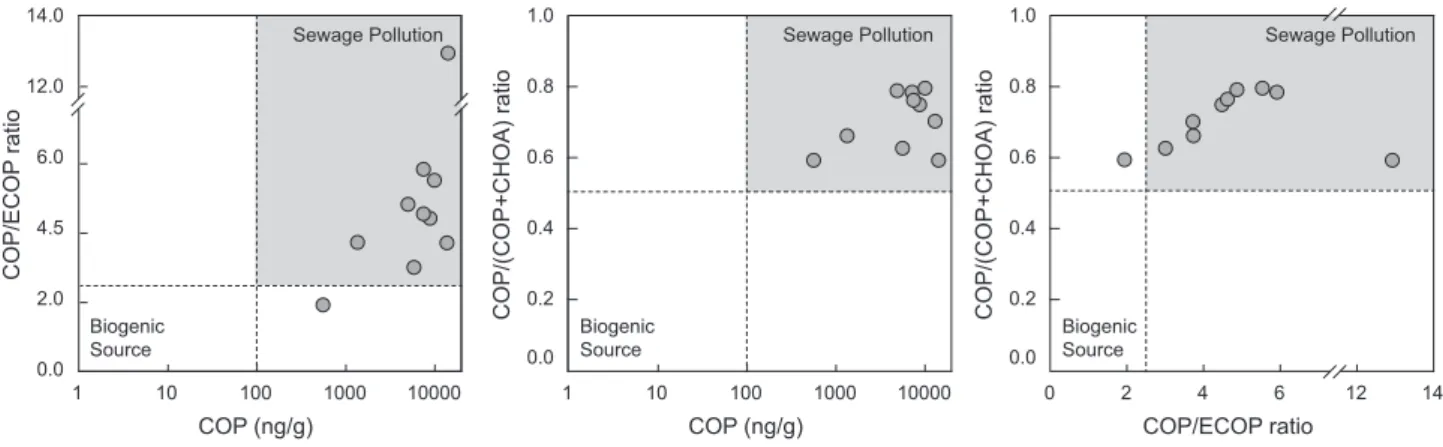
과다른스테롤간의비율등은배출원을구분하는데유용 하다. COP
과ECOP
는인간의배설물과직접관련성이있어서 하수로오염된퇴적물에서검출된다(Grimalt et al., 1990).
반 면,
고래등해양포유류의배설물에도포함되기때문에이들의 영향은생물기원배출(biogenic sources)
으로구분이필요하다(Venkatesan and Santiago, 1989; Martins et al., 2002).
많은연 구자들은생물기원배출의영향을최소화하여하수오염도및유기물의기원을평가하기위해
COP
농도와함께여러종류의비율을동시에사용한다
(Fig. 4). COP/ECOP
비율이2.5
이하시 생물기원배출의영향이크므로,
비율2.5
이상과COP
농도100
ng/g
이상은도시하수유입에따른오염과관련성이있다(Ven-
katesan and Santiago, 1989).
수영강하구역의퇴적물에서조 사된COP/ECOP
비율은5.04±3.00
이었으며, SY10
정점을 제외한모든정점에서모두초과하여생물기원보다도시하수 유입으로인한오염이주요원인이었다. COP/(COP+CHOA)
비율은하수오염평가에가장널리사용되고있으며,
비율0.5
이상과함께
COP 100 ng/g
이상인정점도도시하수유입으로인한오염으로구분된다
(Grmialt et al., 1990; Leeming et al., 1998).
본연구에서COP/(COP+CHOA)
비율은0.71±0.08
이 었으며,
모든정점에서초과하였다. SY10
정점을제외한모든 정점이COP/(COP+CHOA)
비율0.5
이상, COP/ECOP 2.5
이 상이었다.
따라서분변계스테롤의비율과COP
농도결과에서 보듯이,
수영강하구역에서COP
등분변계스테롤의농도는생 물보다대부분도시하수에서기원하였다.
노닐페놀류 화합물
수영강하구역의 퇴적물내
NP
와NP 1+2 EO
의 농도는각각SY01
Concentration (ng/g) Concentration (ng/g)
SY02 SY03 SY04 SY05 SY06 SY07 SY08 SY09 SY10 4,000
0 8,000
2,000 1,000 0 3,000 4,000 5,000
SY01 SY02 SY03 SY04 SY05 SY06 SY07 SY08 SY09 SY10 (b) ∑ NP
0 2,000 4000
Gunsan Ansan Masan Mokpo Ulsan Suyeong
6,,000 8,000 10,000 12,000 14,000
(a) COP
Concentration (ng/g)
0 1,000 2,000
Mokpo Ansan Masan Gunsan Suyeong Ulsan
3,000 4,000 5,000 6,000 7,000
(b) NP
Concentration (ng/g)
Fig. 3. Comparison of (a) coprostanol (COP) and (b) nonylphenol (NP) in sediment samples collected around outfalls of wastewater treatment plants in Korea coastal waters, Gunsan (Lee et al. 2012), Ansan (Choi et al. 2011a), Masan (Moon et al. 2008), Mokpo (Choi et al. 2007), and Ulsan (Choi et al. 2011b).
Fig. 4. Scatterplots of (a) coprostanol/epicoprostanol, (b) coprostanol/(coprostanol+cholestanol) vs. coprostanol concentrations and (c) co- prostanol/(coprostanol+cholestanol) vs. coprostanol/epicoprostanol in sediments from Suyeong Estuary of Busan.
0.0
0 2 4
COP/ECOP ratio
COP/(COP+CHOA) ratio Biogenic
Source
Sewage Pollution
6 12 14
0.2 0.4 0.6 0.8 1.0
0.0
1 10 100
COP (ng/g)
COP/(COP+CHOA) ratio Biogenic
Source
Sewage Pollution
1000 10000 0.2
0.4 0.6 0.8 1.0
0.0 1 10 100
COP (ng/g)
COP/ECOP ratio
Biogenic Source
Sewage Pollution
1000 10000 2.0
4.5 6.0 12.0 14.0
a b
Concentration (ng/g)
Rank (%)
(a) NP
10 100 1000 10000
0 20 40 60 80 100
Rank (%)
10000 a
Concentration (ng/g) (b) NP 1+2 EO
10 100 1000
0 20 40 60 80 100
Rank (%)
(c) NP-TEQs
10 100 1000 10000
0 20 40 60 80 100
Concentration (ng-TEQ/g, TOC1%) c
126°00' 128°00' 130°00'
129°09' 129°11' 129°13' 129°15'E
0 50 100 km 34 °00' 35 °15' 35 °17' 35 °19'N
36 °00' 38 °00'N
KOREA
N
백승홍
ㆍ
윤세라ㆍ
이인석ㆍ
황동운ㆍ
최민규1010
80.0-1,583 ng/g (
평균553 ng/g), 66.0-2,384 ng/g (
평균1,072 ng/g)
를보였고, ΣNP (NP
와NP 1+2 EO
의 합)
의농도는146- 3,723 ng/g (
평균1,625 ng/g)
의범위를보였다(Table 1).
ΣNP
의가장높은농도(3,723 ng/g)
는하수처리장방류구인 근정점SY01
에서조사되었고,
가장낮은농도는외측SY10
에 서조사되었다(Fig. 2b). ΣNP
의농도는내측에서외측으로갈 수록감소하였다. ΣNP
의공간적분포는COP
의분포와잘일 치하였다(r=0.837, P<0.01).
이것은NPs
와분변계스테롤이수 영강하구역에서유사한배출원과거동을가지는것을제안한 다(Choi et al., 2007, 2011b; Li et al., 2008; Moon et al., 2008).
또한
, ΣNP
과COP
는퇴적물내TOC
농도와도높은상관성을 보였다(r=00.758-0.764, P <0.01).
퇴적물중TOC
농도는1.22- 47.8 mg/g
로TOC
에대한ΣNP
과COP
의기여율은평균0.02- 0.09%
이었다.
따라서퇴적물내TOC
에대한ΣNP
과COP
의 기여율은낮지만,
수영강하구역의퇴적물내TOC
분포에도시 하수가크게기여한것으로판단된다(Choi et al., 2007; Moon et al., 2008; Kim et al., 2010).
수영강하구역중하수처리장방류구인근퇴적물
(SY01)
에서 조사된NP
의농도를국내다른연안의하수처리장방류구인 근퇴적물에서보고된자료와비교하였다(Fig. 3b).
하수처리장 방류수역에서보고된NP
농도는목포연안(170 ng/g; Choi et al., 2007),
안산시화반월공단(270 ng/g; Choi et al., 2011a),
마 산만(270 ng/g; Moon et al., 2008),
군산연안(1,120 ng/g: Lee et al., 2012),
울산만(5,770 ng/g; Choi et al., 2011b)
으로수영 강하구역(1,583 ng/g)
에서NP
오염도는울산만다음으로높 았다.
국외의하수처리장방류수역결과와비교시,
본연구결과는캐나다
(40-293 ng/g; Sabik et al., 2003),
스페인(8-1,050 ng/g; Petrovic et al., 2002)
에비해비교적높은수준으로나타 났고,
일본(500-13,000 ng/g; Isobe et al., 2001)
과중국(3,500- 32,400 ng/g; Wu et al., 2007)
보다는낮은수준이었다.
퇴적물내
ΣNP
중NP
가차지하는기여율은40±19%
로NP
보다NP 1+2 EO
가높은기여율을보였다.
하수처리장에서NPs
의생물학적분해는ethoxylate (EO) chain
의분해로시작되기 때문에, NP 1+2 EO
와NP
와같은짧은사슬대사체(short-chain metabolic intermediates)
로 분해되고, NPs
중NP
의 기여율 은증가된다(Ying, 2006; González et al., 2010). Clara et al.
(2007)
는하수처리장유입수에비해배출수에서NP
의기여율의증가
(
유입수28%,
배출수65%)
를보고한바있다.
본연구 에서NP
의 기여율(40±19%)
은 마산만(36±13%, Moon et al., 2008),
울산만(41±17%; Choi et al., 2011b)
와유사한수 준이었지만,
안산시화반월공단(52±7.9%; Choi et al., 2011a)
및목포연안(68±37%; Choi et al., 2007)
보다낮은수준이었 다.
따라서수영강하구역은처리되지않은하수의유입이높거 나하수처리장에서NPs
제거효율이낮은것으로판단된다.
실 제로, Choi et al. (2007)
이부산시내8
개하수처리장유입수와 방류수내비이온계면활성제를분석한연구결과에따르면,
비 이온계면활성제의제거율은7
개하수처리장70-100%
인반면SY
하수처리장은42-45%
로가장낮았고,
방류수내비이온계 면활성제의농도도가장높았다고보고하였다.
노닐페놀류의 오염에 따른 위해도 평가
NP
와NP 1+2 EO
와같은NPs
는수생물종의단백질과상호반Table 1. Concentrations (ng/g) of nonylphenolic compounds and fecal sterols in sediments from Busan Suyeong Estuary of Korea
(mg/g)TOC COP ECOP CHOE CHOA NP NP1+2EO ΣNP COP/
(COP+CHOA) COP/
ECOP
SY01 47.8 13,018 1,008 12,848 8,954 1,583 2,141 3,723 0.59 12.9
SY02 21.0 10,519 2,844 6,957 4,464 717 2,384 3,101 0.70 3.70
SY03 1.54 6,262 1,072 5,212 1,725 174 254 427 0.78 5.84
SY04 6.39 8,368 1,518 5,961 2,179 208 1,876 2,083 0.79 5.51
SY05 9.70 4,206 871 7,222 1,123 224 1,647 1,871 0.79 4.83
SY06 22.8 7,145 1,609 6,548 2,383 516 398 914 0.75 4.44
SY07 17.3 6,144 1,350 9,102 1,897 1,153 1,444 2,597 0.76 4.55
SY08 1.22 1,062 286 2,716 539 172 134 307 0.66 3.71
SY09 12.5 4,274 1,438 2,682 2,569 700 381 1,081 0.62 2.97
SY10 6.21 366 191 1,468 250 80.0 66.0 146 0.59 1.92
Min 1.22 366 191 1,468 250 80.0 66.0 146 0.59 1.92
Max 47.8 13,018 2,844 12,848 8,954 1,583 2,384 3,723 0.79 12.9
Mean 14.6 6,136 1,219 6,072 2,608 553 1,072 1,625 0.71 5.04
SD 13.9 3,927 750 3,369 2,523 495 911 1,245 0.08 3.00
Total organic carbon (TOC), coprostanol (COP), epicoprostanol (ECOP), cholesterol (CHOE), cholestanol (CHOA), nonylphenol (NP), nonylphenol mono- & di-ethoxylates (NP
1+2
EO), the sum of NP and NP1+2
EO (ΣNP), standard deviation (SD).도시하수 유입으로 인한 오염도 평가
1011
응하여만성독성과내분비계교란등수생태계에악영향을미 치는 것으로보고된다
(Scott-Fordsmand and Krough, 2004;
Soares et al., 2008).
수생물종 중먹이사슬하부위치의 생물 인Daphnia magna
에NPs
는급·
만성독성과번식이상을일 으키며(Comber et al., 1993; Baldwin et al., 1998),
어류의경 우성장및효소의활성변화그리고체내다량축적으로인한 치사율에영향을미치는것으로알려져있다(Jeon et al., 2004;
Jin et al., 2008). NPs
는내분비계장애추정물질(endocrine dis- rupting chemicals)
로분류되었고, NP
는유럽연합수질기본지 침(European Union Water Framework Directive)
의우선관리 대상성분(priority substance)
에 포함되었다(European Com- mission, 2001).
더욱이네덜란드,
노르웨이,
캐나다는NPs
로 부터수생물종을보호하기위해퇴적물가이드라인을제안하 였다(Environment Canada, 2002; Jonkers et al., 2005; Bakke et al., 2010).
본연구에서는네덜란드(NP 105 ng/g, NP 1+2 EO 150 ng/g),
노르웨이(NP 220 ng/g),
캐나다(NPs 1,000 ng NP-
TEQ/g, TOC 1%)
가이드라인과비교하여수영강하구역퇴적물내
NPs
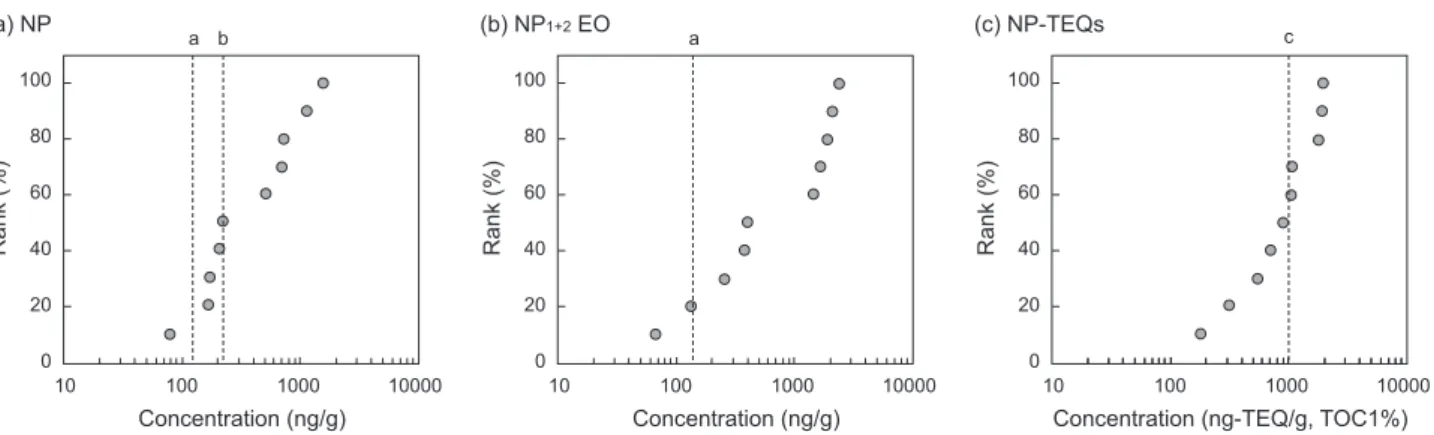
의잔류로인한위해도를평가하였다(Fig. 5).
네덜란 드의가이드라인과비교할때, NP
가이드라인을초과한정점 은조사정점중90%
나되었고, NP 1+2 EO
가이드라인을초과한 정점은80%
나조사되었다.
노르웨이NP
가이드라인을초과한 정점은60%
조사되었다.
캐나다의가이드라인과비교에앞서,
본연구의NP
와NP 1+2 EO
농도는독성등가계수(toxic equiva- lency factor; NP 1.0, NP 1+2 EO 0.5)
를곱하여합한후TOC 1%
로표준화하였다
(ng NP-TEQ/g, TOC 1%).
그결과,
조사정점 중50%
가캐나다의가이드라인을초과하였다.
따라서,
부산수 영강하구역퇴적물에서NPs
의농도는수생태계에서식하는 민감한수생물종에게잠재적인악영향을줄수있을것으로판 단된다.
사 사
본 연구는국립수산과학원
(RP-2014-ME-45)
의 연구지원에 의해수행되었습니다.
References
Bakke T, Källqvist T, Ruus A, Breedveld GD and Hylland K.
2010. Development of sediment quality criteria in Norway.
J Soils Sediments 10, 172-178. http://dx.doi.org/10.1007/
s11368-009-0173-y.
Baldwin WS, Graham SE, Shea D and LeBalc GA. 1998. Al- tered metabolic elimination of testosterone and associated toxicity following exposure of Daphnia magna to nonyl- phenol polyethoxylate. Ecotoxicol Environ Saf 39, 104-111.
http://dx.doi.org/10.1006/eesa.1997.1614.
Chan K, Lam MHW, Poon K, Yeung H and Chiu TKT. 1998.
Application of sedimentary fecal stanols and sterols in trac- ing sewage pollution in coastal waters. Water Res 32, 225–
235. http://dx.doi.org/10.1016/S0043-1354(97)00175-9.
Choi M, Choi HG, Moon HB, Yu J, Kang SK and Choi SK.
2007. Sources and distributions of organic wastewater com- pounds on the Mokpo coast of Korea. J Fish Sci Technol 10, 205-214. http://dx.doi.org/10.5657/fas.2007.10.4.205.
Choi M, Furlong ET, Moon HB, Yu J and Choi HG. 2011a.
Contamination of nonylphenolic compounds in creek wa- ter, wastewater treatment plant effluents, and sediments from Lake Shihwa and vicinity, Korea: comparison with fecal pollution. Chemosphere 85, 1406-1413. http://dx.doi.
org/10.1016/j.chemosphere.2011.08.016.
Choi M, Lee IS, Hwang DW, Yoon SR and Jung RH. 2014.
Evaluation of sewage pollution by sedimentary nonylpheno- lic compounds facal sterols in Busan Coastal area of Korea.
J Korea Soc Environ Anal 17, 95-103.
Choi M, Moon HB and Choi HG. 2011b. Tracing wastewater
Fig. 5. Concentrations of nonylphenolic compounds in Busan coastal area with comparison of screening values reported elsewhere.
a
maxi- mum permission concentration (MPC) for NP1+2
EO and NP in the Netherlands (Jonkers et al. 2005);b
sediment quality guideline (SQG) for NP in Norway (Bakke et al. 2010);c
SQG for NPs in Canada (Environment Canada, 2002)0.0
0 2 4
COP/ECOP ratio
COP/(COP+CHOA) ratio Biogenic
Source
Sewage Pollution
6 12 14
0.2 0.4 0.6 0.8 1.0
0.0
1 10 100
COP (ng/g)
COP/(COP+CHOA) ratio Biogenic
Source
Sewage Pollution
1000 10000 0.2
0.4 0.6 0.8 1.0
0.0 1 10 100
COP (ng/g)
COP/ECOP ratio
Biogenic Source
Sewage Pollution
1000 10000 2.0
4.5 6.0 12.0 14.0
a b
Concentration (ng/g)
Rank (%)
(a) NP
10 100 1000 10000
0 20 40 60 80 100
Rank (%)
10000 a
Concentration (ng/g) (b) NP 1+2 EO
10 100 1000
0 20 40 60 80 100
Rank (%)
(c) NP-TEQs
10 100 1000 10000
0 20 40 60 80 100
Concentration (ng-TEQ/g, TOC1%) c
126°00' 128°00' 130°00'
129°09' 129°11' 129°13' 129°15'E
0 50 100 km 34 °00' 35 °15' 35 °17'
36 °00'
KOREA
백승홍
ㆍ
윤세라ㆍ
이인석ㆍ
황동운ㆍ
최민규1012
contamination in sediments from Ulsan Bay of Korea using nonylphenolic compounds. J Korea Soc Environ Anal 14, 5-11.
Choi M, Moon HB, Yu J, Kim SS, Pait AS and Choi HG. 2009.
Nationwide monitoring of nonylphenolic compounds and coprostanol in sediments from Korean coastal waters. Mar Pollut Bull 58, 1086–1092. http://dx.doi.org/10.1016/j.mar- polbul.2009.04.010.
Choi YJ, Jang EH, Kim MK, Lim HS and Lee KS. 2007. Re- search on nonionic surfactant of River water and sewage treatment water in Busan. Busan Metropolitan City Institute of Health & Environment Rep 17, 103-115.
Clara M, Scharf S, Scheffknecht C and Gans O. 2007. Occur- rence of selected surfactants in untreated and treated sew- age. Water Res 41, 4339-4348. http://dx.doi.org/10.1016/j.
watres.2007.06.027.
Comber MHI, Willams TD and Stewart KM. 1993. The effects of nonylphenol on Daphnia magna. Water Res 27, 273-276.
http://dx.doi.org/10.1016/0043-1354(93)90086-W.
European Commission. 2001. European Commission decision no. 2455/2001/EC of the European Parliament and of the council of 20 November 2001 establishing the list of pri- ority substances in the field of water policy and amending directive 2000/60/EC, Official Journal L331, 15/12/2001, 0001-0005.
Environment Canada. 2002. Canadian Environmental Quality Guidelines for nonylphenol and its ethoxylates (water, sedi- ment, and soil) for the protection of aquatic life: nonylphe- nol and its ethoxylates. Environment Canada Rep, 1-3.
Froehner S, Martins RF and Errer MF. 2009. Assessment of fecal sterols in Barigui River sediments in Curitiba, Brazil. Envi- ron Monit Assess 157, 591–600. http://dx.doi.org/10.1007/
s10661-008-0559-0.
González MM, Martin J, Santos JL, Aparicio I and Alonso E.
2010. Occurrence and risk assessment of nonylphenol and nonylphenol ethoxylates in sewage sludge from different conventional treatment processes. Sci Total Environ 408, 563-570. http://dx.doi.org/10.1016/j.scitotenv.2009.10.027.
Gonzalez-Oreja JA and Saiz-Salina J.I. 1998. Short-term spa- tio-temporal changes in urban pollution by means of faecal sterols analysis. Mar Pollut Bull 36, 868-875. http://dx.doi.
org/10.1016/S0025-326X(98)00037-X.
Grimalt J, Fernadez O, Bayona P and Albaiges JM. 1990. As- sessment of fecal sterols and ketones as indicators of urban sewage inputs to coastal waters. Environ Sci Technol 24, 357–363. http://dx.doi.org/10.1021/es00073a011.
Hatcher PG and McGillivary PA. 1979. Sewage contamination in the New York Bight, coprostanol as an indicator. Envi- ron Sci Technol 12, 1225–1229. http://dx.doi.org/10.1021/
es60158a015.
Isobe KO, Tarao M, Zakaria MP, Chiem NH, Minh LY and Takada H. 2002. Quantitative application of fecal sterols us-
ing gas chromatography-mass spectrometry to investigate fecal pollution in tropical waters: Western Malaysia and Mekong Delta, Vietnam. Environ Sci Techol 36, 4497-4507.
http://dx.doi.org/10.1021/es020556h.
Isobe T, Nishiyama H, Nakashima A and Takada H. 2001. Dis- tribution and behavior of nonylphenol, Octylphehnol and nonylphenol monoehtoxylate in Tokyo metropolitan area:
their association with aquatic particles and sedimentary distributions. Environ Sci Technol 35, 1041-1049. http://
dx.doi.org/10.1021/es001250i.
Jeon DY, Lee SL, Son JW, Cha YU, Kwon KW and Yoo PJ.
2010. Aquatic ecosystem health assessment in middle reach of Suyoung River using characteristics of benthic macro- invertebrate and fish fauna. J Korea Soc Water Quality 26, 934-942.
Jeon JK, Lee JS, Shon YC, Shim WJ, Jeung JH, Hong GP, Kim PK and Han CH. 2004. Responses of cytochrome P450 and EROD activity in rockfish (Sebastes schlegeli) administered intraperitoneal injection of 4-nonylphenol. J Korea Environ Biol 22, 171-176.
Jin YG, Kim CH, Lee CW and Lee JS. 2008. Survival rate, growth and NP accumulation of the striped bitterling, Achei-
lognathus yamatsutae long-term exposed to nonylphenol
(NP). J Fish Pathol 21, 57-66.Jonkers N, Laane RWPM, De Graaf C and De Voogt P. 2005.
Fate modeling of nonylpheno ethoxylates and their me- tabolites in the Duch Scheldt and Rhine estuaries: Valida- tion with new field data. Estuar Cast Shelf Sci 62, 141-160.
http://dx.doi.org/10.1016/j.ecss.2004.08.014.
Kim BG, Jung KW and Kim HJ. 2009. Study on the characteris- tics of sediment in Suyeong River. Busan Metropolitan City Institute of Health & Environment Rep 19, 154-167.
Kim YH, Choi M, Jung RH, Yoon SP, Yu J, Choi HG, Ahn SM and Moon HB. 2010. Distributions of polycyclic aromatic hydrocarbons and fecal sterols in sediment from Gamak Bay and their impact on benthic community. J Korea Soc Environ Anal 13, 1-10.
Kwon DM, Yoo EH, Kwon KW and Bin JH. 2008. Evaluation of the Suyeong River by multivariate analysis. Busan Met- ropolitan City Institute of Health & Environment Rep 18, 98-107.
Lee WS, Choi M, Hwang DW, Lee IS and Kim SY. 2012.
Chemical contamination and toxicity of sediments from the Gunsan Coast, Korea. Fish Aquat Sci 15, 1-10. http://dx.doi.
org/10.5657/FAS.2012.0241.
Leeming R., Bate N, Hewlett R and Nichols PD, 1998. Discrim- inating faecal pollution: a case study of storm water entering Port Phillip Bay, Australia. Water Sci Technol 38, 15–22.
http://dx.doi.org/10.1016/S0273-1223(98)00728-8.
Leeming RA, Ball A, Ashbolt N and Nichols P. 1996. Using faecl sterols from humans and animals to distinguish faecal pollution in receiving waters. Wat Res 30, 2893-2900. http://
dx.doi.org/10.1016/S0043-1354(96)00011-5.
Li D, Dong M, Shim WJ, Yim UH, Hong SH and Kannan N. 2008. Distribution characteristics of nonylphenolic chemicals in Masan Bay environments, Korea. Chemo- sphere 71, 1162–1172. http://dx.doi.org/ 10.1016/j.chemo- sphere.2007.10.023.
Martins CC, Venkatesan MI, Montone RC, 2002. Sterols and lin- ear alkylbenzenes in marine sediments from Admiralty Bay, King George Island, South Shetland Islands. Antarct Sci. 14, 244–252. http://dx.doi.org/10.1017/S0954102002000093.
Mayer T, Bennie D, Rosa F, Rekas G, Palabrica V and Schachtschneider J. 2007. Occurrence of alkylphenolic sub- stances in a Great Lakes coastal marsh, Cootes Paradaise, ON, Canada. Environ Pollut 147, 683-690. http://dx.doi.
org/10.1016/j.envpol.2006.09.012.
ME (Ministry of Environment). 2012. Statistics of sewage.
Retrieved from http://www.me.go.kr/home/web/index.
do?menuId=130 on July 10.
Moon HB, Yoon SP, Jung RH and Choi M. 2008. Wastewater treatment plants (WWTPs) as a source of sediment contami- nation by toxic organic pollutants and fecal sterols in a semi- enclosed bay in Korea. Chemosphere 73, 880-889. http://
dx.doi.org/10.1016/j.chemosphere.2008.07.038.
Nichols PD, Leeming R, Rayner MS, Latham V, Ashbolt NJ and Christine T. 1993. Comparison of the abundance of the fecal sterol coprostanol and fecal bacterial groups in inner-shelf waters and sediments near Sydney, Australia. J Chromatog A 643, 189-195. http://dx.doi.org/10.1016/0021- 9673(93)80552-J.
Petrovic M, Fernandez-Alba AR, Borull F, Marce RM, Mazo EG and Barcelo D. 2002. Occurrence and distribution of nonionic surfactants, their degradation products, and linear alkylbenzene sulfonates in coastal waters and sediments in Spain. Eviron Toxicol Chem 21, 37-46. http://dx.doi.
org/10.1002/etc.5620210106.
Savik H, Gagne F, Blaise C, Marcogliese DJ and Jeannot R.
2003. Occrrence of alkylphenol polyethoxylates in the St.
Lawrence River and their bioconcentration by mussels (El-
liptio complanata). Chemosphere 51, 349-356. http://dx.doi.
org/10.1016/S0045-6535(02)00862-7.
Scott-Fordsmand JJ and Krogh PH. 2004. The influence of application form on the toxicity of nonylphenol to Folso- mia fimetaria (Collembola: Isotomidae). Ecotoxicol En- viron Saf 58, 294-299. http://dx.doi.org/10.1016/S0147- 6513(03)00023-X.
Soares A, Guieysse B, Jefferson B, Cartmell E and Lester JN.
2008. Nonylphenol in the environment: a critical review on occurrence, fate, toxicity and treatment in wastewaters.
Environ Int 34, 1033-1049. http://dx.doi.org/10.1016/j.en- vint.2008.01.004.
Venkatesan MI and Santiago CA, 1989. Sterols in oceans sedi- ments: novel tracers to examine habitats of cetaceans, pinni-
peds, penguins and humans. Mar Biol 102, 431–437. http://
dx.doi.org/10.1007/BF00438343.
Venkatesan MI, Merino O, Baek J, Northrup T, Sheng Y and Shisko J. 2010. Trace organic contaminants and their sources in surface sediments of Santa Monica Bay, California, USA.
Mar Environ Res 69, 350-362. http://dx.doi.org/10.1016/j.
marenvres.2009.12.010.
Writer JH, Leenheer JA, Barber LB, Amy GL and Chapra SC.
1995. Sewage contamination in the upper Mississippi River as measured by the fecal sterol, coprostanol. Wat Res 29, 1427-1436. http://dx.doi.org/10.1016/0043-1354(94)00304- Wu ZB, Zhang Z, Chen SP, He F, Fu GP and Liang W. 2007. P.
Nonylphenol and octylphenol in urban eutrophic lakes of the subtropical China. Fresenius Environ Bull 16, 227-234.
Ying GG. 2006. Fate, behavior and effects of surfactants and their degradation products in the environment. Environ Int 32, 417-431. http://dx.doi.org/10.1016/j.envint.2005.07.004.