Obesity Is Inversely Related to Hydrogen-Producing Small Intestinal Bacterial Overgrowth in Non-Constipation Irritable Bowel Syndrome
There have been inconsistent findings on the association of obesity and non-constipation irritable bowel syndrome (IBS). Small intestinal bacterial overgrowth (SIBO) with hydrogen (H2) gas forming-microflora causes non-constipation IBS. But, the effect of H2 producing SIBO on obesity in non-constipation IBS patients has not been studied yet. The aim of this study was to investigate the association between obesity and SIBO in non-constipation IBS patients. We reviewed the charts of patients who showed IBS symptoms along with the documented results of their lactulose hydrogen breath test (LHBT) for SIBO. Multivariate models were used to assess the association between obesity and SIBO. Four-hundred fifty- eight patients were retrospectively included in the study. Of the 485 IBS patients, 158 (30.7%) subjects had positive results for LHBT. Subjects without SIBO showed significantly higher levels of body mass index (24.8 vs. 23.3; P < 0.001) and waist circumference (86.5 vs. 82.7; P < 0.001) as compared to subjects with SIBO. In multivariate analysis, the odds ratios of SIBO were 0.396 (P = 0.018) for obesity and 0.482 (P = 0.021) for abdominal obesity. This is the first human study to demonstrate that obesity is inversely related to SIBO with H2 gas production in non-constipation IBS patients.
Keywords: Small Intestinal Bacterial Overgrowth; Lactulose Hydrogen Breath Test; Obesity Seung-Eun Jung, Nam-Seok Joo,
Kyung-Sun Han, and Kyu-Nam Kim Department of Family Practice and Community Health, Ajou University School of Medicine, Suwon, Korea
Received: 7 December 2016 Accepted: 19 March 2017 Address for Correspondence:
Kyu-Nam Kim, MD
Department of Family Practice and Community Health, Ajou University School of Medicine, 164 Worldcup-ro, Youngtong-gu, Suwon 16499, Republic of Korea
E-mail: [email protected]
https://doi.org/10.3346/jkms.2017.32.6.948 • J Korean Med Sci 2017; 32: 948-953
INTRODUCTION
Obesity is clearly acknowledged as a risk factor for several chro- nic diseases, including diabetes mellitus, cardiovascular disease, and some kinds of cancer (1,2). In addition, epidemiologic data indicate that obesity is associated with a wide range of chronic gastrointestinal (GI) complaints, many of which overlap with functional gastrointestinal disorders (FGIDs) such as irritable bowel syndrome (IBS) or dyspepsia (3-5). Recently, this associ- ation raises the possibility that altered gut microbiota, especial- ly small intestinal bacterial overgrowth (SIBO), may play a sig- nificant role in both obesity and IBS (6,7).
SIBO is defined as an increase in the number and/or altera- tion in the type of bacteria in the upper GI tract (8). Hydrogen (H2)/methane (CH4) breath tests using glucose or lactulose have been widely used as a diagnostic tool to establish SIBO. Of these breath tests using carbohydrate ingestion, an increase in H2/CH4
concentration in the exhaled breath following glucose adminis- tration has a high specificity for diagnosing SIBO. However, since glucose is rapidly absorbed in the upper gut, its usefulness is limited to diagnosing SIBO of the proximal intestine. Hence, in- creased response of H2/CH4 in the breath within 90 minutes af- ter ingestion of the lactulose, which is resistant to hydrolysis by
mammalian enzymes, is more commonly used to diagnose prox- imal and distal SIBO in patients with IBS (9-11).
In humans, H2 and CH4 are produced by intestinal bacteria.
Any imbalance of this intestinal microbiota, both qualitative and quantitative, might have serious health problems. For ex- ample, the over-production of CH4 gas by CH4-producing mi- croflora could lead to an increase in weight gain and the devel- opment of obesity (12). The detection of CH4 is demonstrated to be significantly associated with a functional GI disease, con- stipation-predominant IBS (IBS-C) (13-15). While, H2 gas form- ing-microflora causes non-constipation IBS (16). Some recent studies demonstrated that obesity is related to the non-consti- pation IBS, especially diarrhea IBS (17,18). Another study re- ported that obesity may not predict the occurrence of non-con- stipation GI symptoms such as lower abdominal pain and diar- rhea (19). Therefore, up to now, there have been inconsistent findings on the association of obesity and non-constipation IBS, and additionally, these studies were reported without assessing H2 gas forming SIBO.
To our best knowledge, the relationship between obesity and SIBO with H2 gas forming-microflora has not yet been studied in non-constipation IBS. Therefore, the aim of this study was to examine the relationship between obesity and SIBO as assessed ORIGINAL ARTICLE
Gastroenterology & Hepatology
2017-03-16 https://crossmark-cdn.crossref.org/widget/v2.0/logos/CROSSMARK_Color_square.svg
by the lactulose H2 breath test (LHBT) in subjects with non-con- stipation IBS.
MATERIALS AND METHODS Study subjects and design
Patients with abdominal symptoms such as bloating, abdomi- nal pain or discomfort, and abnormal bowel habit changes who visited the Health Promotion Center and the Department of Family Medicine at Ajou University Hospital, Suwon, Korea from September 2012 through July 2014 were selected as the subjects of this study. Among those with GI symptoms for this period, IBS was diagnosed as according to Rome III criteria after a de- tailed interview by a physician. IBS was defined recurrent ab- dominal pain or discomfort (at least 3 days per month in the last 3 months) with onset at least 6 months before diagnosis and association with 2 or more of the following: 1) improvement with defecation, 2) onset associated with a change in the fre- quency of stools, and 3) onset associated with a change in the form of stools. IBS subgroups were classified as IBS-C, diarrhea- predominant IBS (IBS-D), and mixed constipation and diarrhea IBS (IBS-M). These subjects were identified through an electron- ic search of the scheduling database of the clinic. We included 784 subjects, each aged over 20 years, who had undergone gas- troduodenoscopy, colonoscopy, abdomen ultrasonography with- in the previous 2 years and, lactulose breath test (LBT) includ- ing those with current IBS symptoms at the time of the hospital visit 20). Of these, 726 patients were diagnosed with IBS; 153 patients with IBS-M (21.0%), 332 patients with IBS-D (45.7%), and 241 patients with IBS-C (33.1%).
Of the initial 784 subjects, we excluded 299 subjects who met one of the following conditions: Subjects with a history of, or symptoms consistent with, IBS-C; subjects with a history of oth- er GI disorders (such as inflammatory bowel disease or peptic ulcer disease) and intestinal surgery (except appendectomy), or who for 1 month prior to the study used antibiotics, probiot- ics, or any other drug that could influence bowel function. Thus, 485 subjects were included in the final analyses (Fig. 1).
Anthropometry and data collection
The height and body weight of the participants were measured.
Body mass index (BMI) was calculated as the weight divided by height squared (kg/m2). Waist circumference (WC) was mea- sured by a trained nurse at the central part between the 12th rib and the iliac crest. The BMI groups were classified as “under- weight and healthy” (BMI < 23), “overweight” (23 ≤ BMI < 25), and “obesity” (BMI ≥ 25) using Asian BMI classifications. Obe- sity was defined as a BMI equal to or above 25. Abdominal obe- sity was defined as a WC equal to or above 85 cm in women and 90 cm in men, according to the World Health Organization rec- ommendation.
Data on alcohol consumption were collected through admin- istration of a self-report questionnaire. Alcohol consumption in subjects was calculated and then converted to weekly alcohol consumption (grams of ethanol per week) by the graduated fre- quency method (21). At the time of the hospital visit, subjects were asked about their amount of moderate physical activity as follows: “During the last 7 days, on how many days did you do moderate physical activities for at least 30 minutes (e.g. bicycling at a regular pace, swimming at a regular pace)?” We used the data; and the frequency of weekly moderate physical activities was recorded. Subjects who had regularly smoked cigarettes during the past year were considered to be current smokers. Hy- pertension was defined as a systolic blood pressure (BP) ≥ 140 mmHg or a diastolic BP ≥ 90 mmHg, or the use of antihyperten- sive medication. Diabetes mellitus was defined as a fasting blood glucose ≥ 126 mg/dL or the use of oral hypoglycemic agents or insulin. Dyslipidemia was defined as a previously diagnosed hy- perlipidemia and currently being on cholesterol medication.
LBT
All subjects were asked to have carbohydrate-restricted diets 1 day before the test to minimize their basal H2 excretion. Smok- ing and physical exercises were not allowed 2 hours prior to and during the test. Breath testing was initiated after mouth washing with 20 mL of 1% chlorhexidine solution. After an initial base- line breath sample was collected, subjects ingested 15 mL of syrup containing 10 g lactulose (Duphalac®; ChoongWaePhar- ma Corporation, Seoul, Korea) taken with 200 mL of water. The breath samples were then measured thrice at 20-minute inter- vals during the first 1 hour and 15-minute interval 4 times dur- ing the following 1 hour. The samples were analyzed for H2 gas and CH4, using a model Breath Tracker SC Quintron gas chro- Fig. 1. Flow chart of study design.
IBS-C = constipation-predominant irritable bowel syndrome, GI = gastrointestinal, IBS = irritable bowel syndrome, SIBO = small intestinal bacterial overgrowth.
Excluded (n = 299) due to
· Missing data
· IBS-C
· Organic GI, hepatobiliary diseases
· Taking drugs that may affect bowel function
All data (n = 784) was assessed for eligibility
Grouping process according to lactulose breath test results in patients with non-
constipated IBS
Non-SIBO Group (n = 327)
SIBO Group (n = 158) Final Analysis
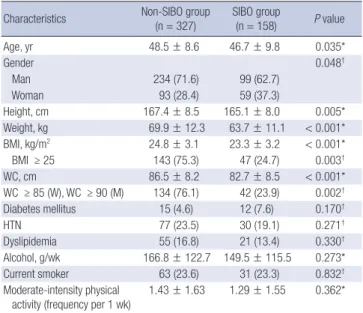
Table 1. Comparisons between the SIBO group and the non-SIBO group (n = 485) Characteristics Non-SIBO group
(n = 327) SIBO group
(n = 158) P value
Age, yr 48.5 ± 8.6 46.7 ± 9.8 0.035*
Gender 0.048†
Man 234 (71.6) 99 (62.7)
Woman 93 (28.4) 59 (37.3)
Height, cm 167.4 ± 8.5 165.1 ± 8.0 0.005*
Weight, kg 69.9 ± 12.3 63.7 ± 11.1 < 0.001*
BMI, kg/m2 24.8 ± 3.1 23.3 ± 3.2 < 0.001*
BMI ≥ 25 143 (75.3) 47 (24.7) 0.003†
WC, cm 86.5 ± 8.2 82.7 ± 8.5 < 0.001*
WC ≥ 85 (W), WC ≥ 90 (M) 134 (76.1) 42 (23.9) 0.002†
Diabetes mellitus 15 (4.6) 12 (7.6) 0.170†
HTN 77 (23.5) 30 (19.1) 0.271†
Dyslipidemia 55 (16.8) 21 (13.4) 0.330†
Alcohol, g/wk 166.8 ± 122.7 149.5 ± 115.5 0.273*
Current smoker 63 (23.6) 31 (23.3) 0.832†
Moderate-intensity physical
activity (frequency per 1 wk) 1.43 ± 1.63 1.29 ± 1.55 0.362*
Data are expressed as a mean ± SD or number (percentage), as appropriate.
SIBO = small intestinal bacterial overgrowth, BMI = body mass index, WC = waist circumference, W = woman, M = man, HTN = hypertension, SD = standard deviation.
*P value was calculated using the independent t-test. †P value was calculated using the χ2 test.
Table 2. Effect of obesity on SIBO as shown by univariate and multivariate analysis
Obesity measurement Univariate analysis Multivariate analysis*
OR (95% CI) P value OR (95% CI) P value
BMI, kg/m2
BMI < 23 1.000 - 1.000 -
23 ≤ BMI < 25 0.364 (0.218–0.595) < 0.001 0.468 (0.206–0.178) 0.097
BMI ≥ 25 0.362 (0.236–0.579) < 0.001 0.396 (0.232–0.824) 0.018
WC, cm
WC < 85 (W), WC < 90 (M) 1.000 - 1.000 -
WC ≥ 85 (W), WC ≥ 90 (M) 0.521 (0.344–0.791) 0.002 0.482 (0.286–0.909) 0.021
SIBO = small intestinal bacterial overgrowth, OR = odds ratio, CI = confidence interval, BMI = body mass index, WC = waist circumference, W = woman, M = man.
*Multivariate analysis was performed by using binary logistic regression analysis. Adjusted for age, gender, current smoking habits, weekly frequency of moderate physical ac- tivity, diabetes mellitus, hypertension, dyslipidemia, and alcohol consumption.
matograph (Quintron Instrument Company, Milwaukee, WI, USA) and the results were recorded in parts per million (ppm).
The LBT was considered positive for SIBO on the basis of the following criteria: A baseline value of H2≥ 20 or CH4≥ 10 ppm or/and a > 20 ppm increase in H2 or ≥ 10 in CH4 over the base- line within 90 minutes (10,11,22).
Statistical analysis
All continuous variables were expressed as means ± standard deviation (SD), whereas categorical variables were presented as numbers and percentages. For intergroup comparisons, con- tinuous variables were analyzed using the independent t-test.
Categorical variables were analyzed using the χ2 test. Multivari- ate logistic analysis was used to evaluate correlation between obesity and SIBO and then, in order to examine the trend of positive or inverse relation between obesity and SIBO, subjects were categorized into 4 quartile groups according to BMI and WC. Analysis of variance (ANOVA) Trend analysis using poly- nomial contrasts was used to evaluate these associations. A P value of < 0.05 was considered statistically significant. The sta- tistical analysis was performed using SPSS version 21.0 for Win- dows (SPSS Inc., Chicago, IL, USA).
Ethics statement
This study was approved by the Institutional Review Board of the Ajou University Hospital (IRB No. MED-MDB-14-313). In- formed consent was waived by the board.
RESULTS
General characteristics of the study subjects
A comparison of the characteristics of patients in both the SIBO patients and the non-SIBO subjects in non-constipation IBS is summarized in Table 1. A total of 485 patients (152 women, age [mean ± SD]: 48.0 ± 8.8 years) were included in the study. Of the 485 IBS patients, 158 (32.6%) subjects had positive results for LHBT. With respect to methanogenic infections, there were only 3 subjects among SIBO patients with a positive LHBT (data
not shown). Alcohol consumption, moderate-intensity physical activity, the prevalence in diabetes mellitus, hypertension, dys- lipidemia, and current smoking habits were similar between the 2 groups. However, compared to subjects without SIBO, those with SIBO had significantly lower values for BMI (24.8 ± 3.1 vs.
23.2 ± 3.2; P < 0.001) and WC (86.5 ± 8.2 vs. 82.7 ± 8.5; P < 0.001).
In addition, the prevalence of obesity according to both BMI and WC levels was significantly lower in subjects with SIBO than for those in the non-SIBO group (obesity by BMI: 75.3% vs. 24.7%, P = 0.003; abdominal obesity by WC: 76.1% vs. 23.9%, P = 0.002).
Obesity and SIBO
We used a logistic regression model to evaluate the relationship between the existence of SIBO and obesity (as assessed with BMI and WC) (Table 2). According to the univariate analysis, the lev- els of BMI and WC were inversely associated with SIBO.
In order to prove the independent inverse association between obesity and SIBO, multivariate regression analysis—incorpo- rating age; gender; current smoking habits; the frequency of weekly moderate physical activity; the amount of alcohol con- sumption; and the existence of metabolic diseases such as dia- betes mellitus, hypertension, and dyslipidemia—was used. Af- ter the adjustment for these potentially confounding factors, a significant negative association between obesity and SIBO has been observed. According to the analysis, the odds ratios (ORs) of SIBO were 0.396 (P = 0.018) for obesity (as defined by BMI) and 0.482 (P = 0.021) for abdominal obesity (as assessed by WC).
Subjects were then categorized into 4 quartile groups (Q1–
Q4) according to BMI and WC (Table 3). We, again, examined the relationship between obesity and SIBO according to BMI and WC quartile categories. ORs decreased in an almost linear fashion as the BMI and WC quartile category increased from Q1 to Q4 (P for trend < 0.001). Consistently, compared to sub- jects in the lowest BMI and WC quartile, those in the highest BMI and highest WC quartile category had significantly lower odds for being at risk for SIBO after adjustment for potential con- founders.
DISCUSSION
In this cross-sectional study, we found that subjects without H2- producing SIBO showed significantly higher levels of BMI and WC as compared to subjects with H2-producing SIBO. In addi- tion, the prevalence of obesity (as defined according to both BMI and WC levels) were significantly lower in subjects with SIBO than among those in the non-SIBO group. Furthermore, when subjects were grouped based on BMI and WC quartile levels, increasing the quartiles of BMI and WC was significantly inversely associated with almost linear trends in SIBO. These associations were also consistent after adjustment for potential
confounders. Therefore, these findings suggest that there is an inverse association between obesity and SIBO in non-constipa- tion IBS.
The relationship between the status of obesity and SIBO has not yet been established. In this study, there was a negative cor- relation between obesity and SIBO of H2-gas-forming microflo- ra. Even though it is hard for us to provide definite clarification between obesity and SIBO in non-constipation IBS, there are several possible explanations for the decreased prevalence of obesity in SIBO patients with H2-gas-forming microflora. One potential explanation for this association could be that SIBO, which was diagnosed via LHBT, can cause malabsorption and weight loss. In other words, SIBO may be accompanied by both maldigestion and malabsorption, which can lead to a variety of nutrient deficiencies and systemic manifestations. Bacteria, which are the principle offender in SIBO, might affect the enzymatic, absorptive, and metabolic actions of the macro-organism (23- 26). For example, in the small gut, H2-producing microbiota with hydrolytic enzymes (e.g., sulfatases and β-glucuronidases) such as Bacteroides fragilis can deconjugate bile salts, which conse- quently limits the reabsorption across the mucosa (7,27,28). The deconjugated bile acids are toxic to intestinal mucosa which re- sults in mucosal inflammation. And then, in order to protect our body from toxins, the gut transit accelerates—which causes malabsorption of fat. In addition, when bile acids escape the enterohepatic cycle, free bile acids are excreted in the feces; this stimulates mucosal inflammation and malabsorption, leading to impaired micelle formation, fat malabsorption, and finally, fat storage reduction (29-31).
Carbohydrate malabsorption may result from the intralumi- nal degradation of sugars by bacteria and from bacteria-related decreases in disaccharidase and brush-border hydrolase activ- ity, and impaired monosaccharide absorption (32). Malabsorp- tion of carbohydrates may also cause increased production of Table 3. The relationship between the BMI & WC quartiles and SIBO
Obesity measurement Univariate analysis Multivariate analysis*
OR (95% CI) P value OR (95% CI) P value
BMI, kg/m2
1st quartile (15.5–22.1) 1.000 - 1.000 -
2nd quartile (22.2–24.1) 0.403 (0.242–0.692) 0.001 0.444 (0.216–0.191) 0.109
3rd quartile (24.2–26.2) 0.228 (0.137–0.425) < 0.001 0.321 (0.178–0.786) 0.020
4rd quartile (26.3–47.1) 0.301 (0.179–0.524) < 0.001 0.294 (0.164–0.742) 0.010
P for trend < 0.001 - < 0.001 -
WC, cm
1st quartile (63–79) 1.000 - 1.000 -
2nd quartile (80–85) 0.515 (0.322–0.895) 0.011 0.522 (0.197–1.915) 0.208
3rd quartile (86–90) 0.411 (0.241–0.725) 0.002 0.631 (0.290–1.346) 0.329
4rd quartile (91–119) 0.291 (0.170–0.516) < 0.001 0.282 (0.116–0.564) 0.007
P for trend < 0.001 - < 0.001 -
BMI = body mass index, WC = waist circumference, SIBO = small intestinal bacterial overgrowth, OR = odds ratio, CI = confidence interval.
*Multivariate analysis was performed by using binary logistic regression analysis. Adjusted for age, gender, current smoking habits, weekly frequency of moderate physical ac- tivity, diabetes mellitus, hypertension, dyslipidemia, and alcohol consumption.
H2 gas, which is associated mainly with IBS-D (33). In addition, bacteria in the small intestine in patients with SIBO may produce more short-chain fatty acids (SCFAs). An increase in the con- centration of SCFAs leads to acidification of the gut and decon- jugation of bile acid (34,35). This in turn may cause significant changes in water and electrolyte transport in the colon which can result in diarrhea (36,37). Therefore, the prevalence of SIBO is inversely associated with obesity, which is paralleled by reduc- ed absorption of micronutrients in non-constipated IBS.
In brief, the inverse relationship between H2-gas-forming mi- croflora and the obesity may be due to insufficient absorption of fats and carbohydrates. Both the production of excess H2 gas and SCFAs from insufficient absorption of nutrients also affects shorter gastric transit time which results in non-constipated IBS.
From these courses, subjects with SIBO tend to have a lower BMI and a lower WC.
The present study has several limitations. First of all, it is hard to prove causality since the study is retrospective and cross-sec- tional at a single center, which could have led to selection bias.
Second, the LBT is not a gold-standard method in the diagnosis of SIBO, even though it is a great tool. LHBT has a low sensitivity and specificity in patients with rapid intestinal transit (38,39).
Thus, the possibility of false-positive and false-negative test re- sults cannot be ignored. Third, there is an omission of data re- garding caloric intake which is a crucial factor for obesity and IBS. However, despite these limitations, our study has numer- ous strengths. Not only has this research used a large-scale co- hort of 485 subjects, but it has also been the first study to evalu- ate the relationship between obesity and SIBO. Also, this study has newly suggested that H2-gas-forming microflora play an in- fluential role in the obesity of patients with non-constipation dominant IBS.
In summary, the present study has demonstrated that obesi- ty (as assessed by measurement of BMI and WC) is negatively associated with SIBO with H2-gas-forming flora among subjects with non-constipated IBS. Since this study was the first of its kind to investigate the inverse association between obesity and LH- BT-diagnosed SIBO in non-constipation IBS, further studies—
particularly, prospective cohort studies—are needed to eluci- date the relationship between obesity and SIBO.
DISCLOSURE
The authors have no potential conflicts of interest to disclose.
AUTHOR CONTRIBUTION
Conceptualization: Jung SE, Kim KN. Investigation: Joo NS, Han KS. Writing - original draft: Jung SE, Kim KN. Validation: Joo NS, Han KS. Writing - review & editing: Jung SE, Joo NS, Han KS, Kim KN.
ORCID
Seung-Eun Jung http://orcid.org/0000-0002-1798-2085 Nam-Seok Joo http://orcid.org/0000-0001-5895-1800 Kyung-Sun Han http://orcid.org/0000-0002-7509-4393 Kyu-Nam Kim http://orcid.org/0000-0002-1213-5004 REFERENCES
1. Park YS, Kim JS. Obesity phenotype and coronary heart disease risk as estimated by the Framingham risk score. J Korean Med Sci 2012; 27: 243- 9.
2. Choi JB, Moon HW, Park YH, Bae WJ, Cho HJ, Hong SH, Lee JY, Kim SW, Han KD, Ha US. The impact of diabetes on the risk of prostate cancer de- velopment according to body mass index: a 10-year nationwide cohort study. J Cancer 2016; 7: 2061-6.
3. Nam SY. Obesity-related digestive diseases and their pathophysiology.
Gut Liver Forthcoming 2016.
4. Delgado-Aros S, Locke GR 3rd, Camilleri M, Talley NJ, Fett S, Zinsmeister AR, Melton LJ 3rd. Obesity is associated with increased risk of gastroin- testinal symptoms: a population-based study. Am J Gastroenterol 2004;
99: 1801-6.
5. Acosta A, Camilleri M. Gastrointestinal morbidity in obesity. Ann N Y Acad Sci 2014; 1311: 42-56.
6. Ghoshal UC, Shukla R, Ghoshal U, Gwee KA, Ng SC, Quigley EM. The gut microbiota and irritable bowel syndrome: friend or foe?. Int J Inflam 2012;
2012: 151085.
7. Aguirre M, Venema K. Does the gut microbiota contribute to obesity? Go- ing beyond the gut feeling. Microorganisms 2015; 3: 213-35.
8. Bures J, Cyrany J, Kohoutova D, Förstl M, Rejchrt S, Kvetina J, Vorisek V, Kopacova M. Small intestinal bacterial overgrowth syndrome. World J Gastroenterol 2010; 16: 2978-90.
9. Rana SV, Malik A. Breath tests and irritable bowel syndrome. World J Gas- troenterol 2014; 20: 7587-601.
10. Burgell RE, Gibson PR. The lactulose breath test in irritable bowel syndrome:
is it all hot air? Dig Dis Sci 2016; 61: 655-7.
11. Gabrielli M, D’Angelo G, Di Rienzo T, Scarpellini E, Ojetti V. Diagnosis of small intestinal bacterial overgrowth in the clinical practice. Eur Rev Med Pharmacol Sci 2013; 17 Suppl 2: 30-5.
12. Basseri RJ, Basseri B, Pimentel M, Chong K, Youdim A, Low K, Hwang L, Soffer E, Chang C, Mathur R. Intestinal methane production in obese in- dividuals is associated with a higher body mass index. Gastroenterol Hep- atol (N Y) 2012; 8: 22-8.
13. Hwang L, Low K, Khoshini R, Melmed G, Sahakian A, Makhani M, Pok- kunuri V, Pimentel M. Evaluating breath methane as a diagnostic test for constipation-predominant IBS. Dig Dis Sci 2010; 55: 398-403.
14. Pimentel M, Gunsalus RP, Rao SS, Zhang H. Methanogens in human health and disease. Am J Gastroenterol Suppl 2012; 1: 28-33.
15. Kunkel D, Basseri RJ, Makhani MD, Chong K, Chang C, Pimentel M. Meth- ane on breath testing is associated with constipation: a systematic review and meta-analysis. Dig Dis Sci 2011; 56: 1612-8.
16. Ghoshal UC, Kumar S, Mehrotra M, Lakshmi C, Misra A. Frequency of small intestinal bacterial overgrowth in patients with irritable bowel syn- drome and chronic non-specific diarrhea. J Neurogastroenterol Motil 2010;
16: 40-6.
17. Sadik R, Björnsson E, Simrén M. The relationship between symptoms, body mass index, gastrointestinal transit and stool frequency in patients with irritable bowel syndrome. Eur J Gastroenterol Hepatol 2010; 22: 102-8.
18. Lee CG, Lee JK, Kang YS, Shin S, Kim JH, Lim YJ, Koh MS, Lee JH, Kang HW. Visceral abdominal obesity is associated with an increased risk of ir- ritable bowel syndrome. Am J Gastroenterol 2015; 110: 310-9.
19. van Oijen MG, Josemanders DF, Laheij RJ, van Rossum LG, Tan AC, Jan- sen JB. Gastrointestinal disorders and symptoms: does body mass index matter? Neth J Med 2006; 64: 45-9.
20. Ford AC, Bercik P, Morgan DG, Bolino C, Pintos-Sanchez MI, Moayyedi P.
Characteristics of functional bowel disorder patients: a cross-sectional survey using the Rome III criteria. Aliment Pharmacol Ther 2014; 39: 312- 21.
21. Greenfield TK. Ways of measuring drinking patterns and the difference they make: experience with graduated frequencies. J Subst Abuse 2000;
12: 33-49.
22. Eisenmann A, Amann A, Said M, Datta B, Ledochowski M. Implementa- tion and interpretation of hydrogen breath tests. J Breath Res 2008; 2: 046002.
23. Fan X, Sellin JH. Review article: small intestinal bacterial overgrowth, bile acid malabsorption and gluten intolerance as possible causes of chronic watery diarrhoea. Aliment Pharmacol Ther 2009; 29: 1069-77.
24. Nelis GF, Vermeeren MA, Jansen W. Role of fructose-sorbitol malabsorp- tion in the irritable bowel syndrome. Gastroenterology 1990; 99: 1016-20.
25. Nucera G, Gabrielli M, Lupascu A, Lauritano EC, Santoliquido A, Cremo- nini F, Cammarota G, Tondi P, Pola P, Gasbarrini G, et al. Abnormal breath tests to lactose, fructose and sorbitol in irritable bowel syndrome may be explained by small intestinal bacterial overgrowth. Aliment Pharmacol Ther 2005; 21: 1391-5.
26. Saltzman JR, Russell RM. Nutritional consequences of intestinal bacterial overgrowth. Compr Ther 1994; 20: 523-30.
27. Conterno L, Fava F, Viola R, Tuohy KM. Obesity and the gut microbiota:
does up-regulating colonic fermentation protect against obesity and met- abolic disease? Genes Nutr 2011; 6: 241-60.
28. Nieuwdorp M, Gilijamse PW, Pai N, Kaplan LM. Role of the microbiome
in energy regulation and metabolism. Gastroenterology 2014; 146: 1525- 33.
29. Shindo K, Machida M, Koide K, Fukumura M, Yamazaki R. Deconjuga- tion ability of bacteria isolated from the jejunal fluid of patients with pro- gressive systemic sclerosis and its gastric pH. Hepatogastroenterology 1998; 45: 1643-50.
30. Wanitschke R, Ammon HV. Effects of dihydroxy bile acids and hydroxy fatty acids on the absorption of oleic acid in the human jejunum. J Clin Invest 1978; 61: 178-86.
31. Dukowicz AC, Lacy BE, Levine GM. Small intestinal bacterial overgrowth:
a comprehensive review. Gastroenterol Hepatol (N Y) 2007; 3: 112-22.
32. Sherman P, Wesley A, Forstner G. Sequential disaccharidase loss in rat in- testinal blind loops: impact of malnutrition. Am J Physiol 1985; 248: G626- 32.
33. Scanu AM, Bull TJ, Cannas S, Sanderson JD, Sechi LA, Dettori G, Zanetti S, Hermon-Taylor J. Mycobacterium avium subspecies paratuberculosis in- fection in cases of irritable bowel syndrome and comparison with Crohn’s disease and Johne’s disease: common neural and immune pathogenici- ties. J Clin Microbiol 2007; 45: 3883-90.
34. Cherbut C, Aubé AC, Blottière HM, Galmiche JP. Effects of short-chain fatty acids on gastrointestinal motility. Scand J Gastroenterol Suppl 1997;
222: 58-61.
35. Ramakrishna BS, Roediger WE. Bacterial short chain fatty acids: their role in gastrointestinal disease. Dig Dis 1990; 8: 337-45.
36. Ghoshal UC, Park H, Gwee KA. Bugs and irritable bowel syndrome: the good, the bad and the ugly. J Gastroenterol Hepatol 2010; 25: 244-51.
37. Simrén M, Stotzer PO. Use and abuse of hydrogen breath tests. Gut 2006;
55: 297-303.
38. Rana SV, Sharma S, Kaur J, Sinha SK, Singh K. Comparison of lactulose and glucose breath test for diagnosis of small intestinal bacterial overgrowth in patients with irritable bowel syndrome. Digestion 2012; 85: 243-7.
39. Walters B, Vanner SJ. Detection of bacterial overgrowth in IBS using the lactulose H2 breath test: comparison with 14C-D-xylose and healthy con- trols. Am J Gastroenterol 2005; 100: 1566-70.