© 2016 The Korean Academy of Medical Sciences.
This is an Open Access article distributed under the terms of the Creative Commons Attribution Non-Commercial License (http://creativecommons.org/licenses/by-nc/4.0) which permits unrestricted non-commercial use, distribution, and reproduction in any medium, provided the original work is properly cited.
pISSN 1011-8934 eISSN 1598-6357
The Non-Communicable Disease Burden in Korea: Findings from the 2012 Korean Burden of Disease Study
In recognition of Korea’s rising burden of non-communicable diseases (NCDs), we investigated the nation’s NCD status and extracted detailed information from the 2012 Korean Burden of Disease study. Consistent with that study, we used disability-adjusted life year (DALY) as a metric. Using national data sources and disability weights specific to the Korean population, we analyzed 116 disaggregated NCDs from the study’s four-level disease and injury hierarchy for both sexes and nine age groups. Per 100,000 population, 21,019 DALYs were lost to 116 NCDs. Of those, 13.97% were due to premature death (death prior to the standard life expectancy for a subject’s age) and 86.03% to non-fatal health outcomes. Based on traditional statistics, the main causes of health loss were mortality of neoplasms; cardiovascular and circulatory diseases; diabetes, urogenital, blood, and endocrine diseases; and chronic respiratory diseases. When combined with analyses of premature death and non-fatal outcomes, however, a substantially different view emerged: the main causes of health loss were diabetes mellitus, low back pain, chronic obstructive pulmonary disease, ischemic heart disease, ischemic stroke, cirrhosis of the liver, osteoarthritis, asthma, gastritis and duodenitis, and periodontal disease (in that order), collectively causing 49.20% of DALYs. Thus, burden of disease data using DALYs rather than traditional statistics brings a new perspective to characterization of the population’s health that provides practical information useful for developing and targeting national NCD control programs to better meet national needs.
Keywords: Disability-Adjusted Life Years; DALY; Burden of Disease; Non-communicable Diseases; Korea
Jihyun Yoon,1 Hyeyoung Seo,1 In-Hwan Oh,2 and Seok-Jun Yoon3
1Department of Public Health, Graduate School, Korea University, Seoul, Korea; 2Department of Preventive Medicine, School of Medicine, Kyung Hee University, Seoul, Korea; 3Department of Preventive Medicine, College of Medicine, Korea University, Seoul, Korea
Received: 4 March 2016 Accepted: 10 July 2016 Address for Correspondence:
Seok-Jun Yoon, MD
Department of Preventive Medicine, College of Medicine, Korea University, 73 Inchon-ro, Seongbuk-gu, Seoul 02841, Korea E-mail: [email protected]
Funding: This study was supported by a grant from the Korean Health Technology R&D Project, Ministry of Health and Welfare, Republic of Korea (Study No. HI13C0729).
https://doi.org/10.3346/jkms.2016.31.S2.S158 • J Korean Med Sci 2016; 31: S158-167
INTRODUCTION
In Korea, effective disease prevention, intervention, and treat- ment and advances in medical technology have dramatically increased the population’s longevity (1). There remains a wide gap, however, between life expectancy per se and healthy, dis- ability-free life expectancy (1-3). As of 2012, the mean life ex- pectancy of the Korean population was 81.4 years while the healthy life expectancy was only 73.0 years (2), suggesting that Koreans experience approximately 8.4 years of disability or dis- ease before their death, corresponding to about 10% of their life (1). The primary cause of these years of sickness is believed to be non-communicable diseases (NCDs). While both the stan- dardized death rate and the avoidable death rate due to NCDs are steadily decreasing, the NCD burden is still high, account- ing for 81% of total deaths and seven of the top 10 causes of death (1). Moreover, the need for effective management of lifestyle- related NCD risk factors is increasing (1). For adult men in Ko- rea, the smoking rate is still over 40% and the high-risk drinking rate is about 12.5% (1). Physical activity is steadily decreasing in both sexes, while the intake of excessive calories and sodium is
increasing (1). The treatment rate is currently only 58.6% for pa- tients with hypertension and 40.6% for those with hypercholes- terolemia, and the control rate is 41.8% for patients with diabet- ic complications such as fundus examination (1). Without sub- stantial and realistic changes in risk factor management in the near future, NCDs will likely take a great toll, in the form of pre- mature deaths and disabilities, and increase Korea’s socioeco- nomic burden. Thus, it is crucial for the government to accu- rately understand the magnitude of current health issues, mon- itor their trends and provide appropriate and timely interven- tions, funds, and educational programs both to help those al- ready suffering from NCDs and to prevent or postpone NCD development in healthy individuals. The indicators used most frequently in health reporting and policy development to iden- tify the most important health problems are the mortality and causes of death statistics. While this approach is straightforward and easy to communicate, it highlights only one facet of popu- lation health, and has progressively become less informative when used exclusively to describe the overall health status of a population (4-6) now that we recognize non-fatal life-time im- pact from NCDs as a major concern. Given the importance of
http://jkms.org S159
https://doi.org/10.3346/jkms.2016.31.S2.S158
determining comprehensive estimates for all of these impacts on population health, the present study details the Korean pop- ulation’s NCD burden using disability-adjusted life years (DALYs), a metric that integrates disease-specific fatal and non-fatal out- comes into a single measure while still allowing the two classes of outcomes to be examined separately as well (7). We have also analyzed 2012 NCD death and incidence data to see how well the DALY metric captures the impact of both premature death and disability (8) and provides a unique and different perspective from traditional statistics. The overall goal of this study was to increase understanding of DALY analysis and help devise effective national NCD control strategies to better meet national health needs.
MATERIALS AND METHODS Overview
We applied the methods of the original Global Burden of Dis- ease (GBD) study (8, 9), with some modifications to tailor the study to the Korean population. A detailed description is pre- sented in (10).
Scope of analysis
The reference year used for this study is 2012, and subjects were divided by sex and into nine age groups (0-9, 10-19, …70-79, 80+). The 2012 Korean Burden of Disease (KBD) study’s disease and injury categories were modified on the basis of the GBD 2010 study to capture the population’s specific health issues while ensuring comparability with other disease burden stud- ies (10). One of the three broad level I categories in this hierar- chy was NCDs, and we included 116 NCDs at the most disag- gregated level. The nine broad level II causes that encompass those 116 NCDs are neoplasms; cardiovascular and circulatory diseases; chronic respiratory diseases; cirrhosis of the liver; di- gestive diseases (except cirrhosis); neurological disorders; mus- culoskeletal disorders; other non-communicable diseases; and diabetes, urogenital, blood, and endocrine diseases. Mental and behavioral disorders have been addressed in a separate study (11) and therefore were excluded from this analysis.
Years of life lost due to premature mortality
Years of life lost (YLLs) were computed for each specific cause by multiplying the number of deaths at each age by the stan- dard remaining life expectancy for that age (12). We used the 2012 edition of the annual life tables produced by Statistics Ko- rea. There, the life expectancy at birth was 77.95 years for male Koreans and 84.64 years for female Koreans (13). Cause-specif- ic mortality was estimated based on the Cause of Death Statis- tics Korea, 2012. When we could not determine cases’ underly- ing causes of death because of the established problem of “gar- bage code” use (8), we adapted the GBD 2010 study’s algorithms
to redistribute those codes to probable causes of death (14). We computed two YLL data sets: one incorporating standard age- weights (C = 0.1658, β = 0.04) and a 3% time discount rate (9), and another with no age-weighting or time discounting.
Years lived with disability
We computed years lived with disability (YLDs) for each cause by multiplying the number of incident cases by the mean dura- tion of each disease and its disability weight (12). As was done for YLLs, we developed two data sets, one incorporating stan- dard age-weights and 3% time discounting and the other with no age-weighting or time discounting. To obtain the epidemio- logic parameters required for YLD computation, we used the National Health Insurance Service (NHIS) claims data. To screen the subjects initially, we extracted the principal diagnosis after a sensitivity analysis with and without the first additional diag- nosis. To determine the prevalence of each specific disease, we developed case definitions by considering the frequency of at- tendance at a healthcare facility and whether in-patient care was received during 2012. We extracted the incidence cases from the prevalence cases, defining incidence cases as those with no prior diagnosis in a time period of 1-5 years (from 2007 to 2011), depending on the disease characteristics. Finally, we calculated the prevalence and incidence for each cause based on the results of our sensitivity analyses, literature reviews, na- tional health statistics reviews including Korea National Health and Nutrition Examination Survey, and professional consulta- tions. For cancers, prevalence and incidence rates were extract- ed from the Korea Central Cancer Registry, according to ICD- 10 codes from KBD 2012 study’s cause categories. We used the DisMod II program (15) to estimate the duration and mean age at onset, then examined the outputs and adjusted the overesti- mated duration values. When the estimated disease duration exceeded the life expectancy at that age, we selected the life ex- pectancy as the disease duration. We used the KBD 2012 esti- mates of the Korean version of disability weights, scaled from 0 (perfect health) to 1 (equivalent to death) (16), for each specific cause. For some NCDs that yielded a relatively high weight when outpatients accounted for > 95% of cases, we estimated disease severity by evaluating outpatient and inpatient cases separately, applying the estimated disability weight to the inpatient cases, and applying the lowest disability weight value from the super- ordinate category to the outpatient cases.
Disability-adjusted life years
For each cause, DALYs were calculated as the sum of the YLLs and YLDs. Because our sensitivity analysis revealed no signifi- cant difference in the results between the data set with standard age-weighting and 3% time discounting and the set without age- weighting and time discounting (10), this report focuses on the set with standard age-weighting and time discounting.
S160 http://jkms.org https://doi.org/10.3346/jkms.2016.31.S2.S158 Ethics statement
The study protocol was approved by Korea University’s institu- tional review board (1040548-KU-IRB-13-164-A-1[E-A-1][E-A- 1]). Informed consent was waived by the board.
RESULTS Deaths in 2012
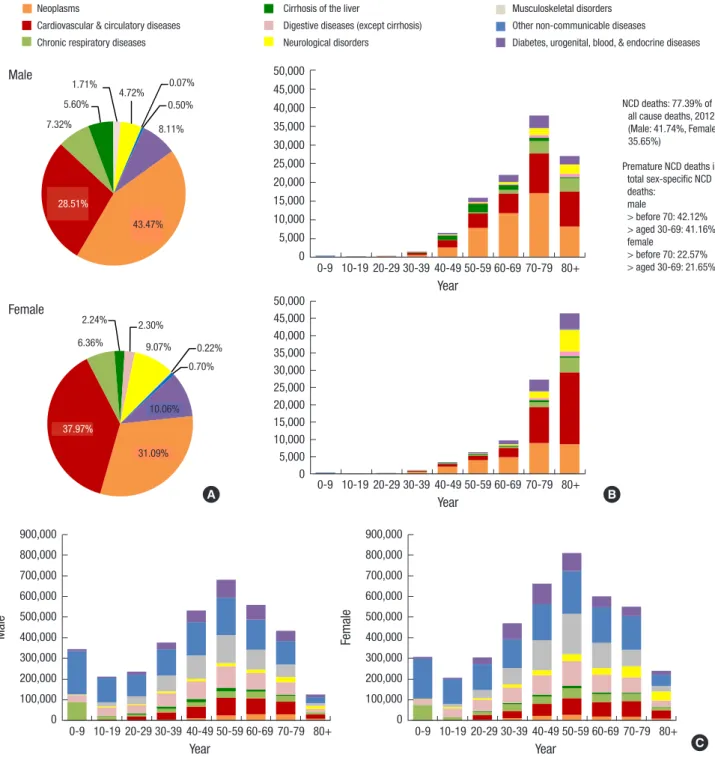
In 2012, the 116 NCDs accounted for 77.39% of all deaths in Ko-
rea. Fig. 1A shows the proportion and number of deaths caused by NCDs in 2012, and the distribution of each in males and in females in all age groups. Neoplasms; cardiovascular and circu- latory diseases; and diabetes, urogenital, blood, and endocrine diseases collectively contributed about 80% of NCD mortality in both sexes (Fig. 1A). Beginning in the 40-49 age group, men showed a higher number of NCD-related deaths than women, and this difference increased steeply in the subsequent decades (Fig. 1B). As is expected due to their higher life expectancy, wom-
Fig. 1. Proportion (A) and number of deaths (B), and number of incidences (C) in non-communicable diseases (NCDs) for 9 broad cause groups by sex and age group, 2012.
Male
21
Neoplasms
Cardiovascular & circulatory diseases Chronic respiratory diseases
Cirrhosis of the liver
Digestive diseases (except cirrhosis) Neurological disorders
Musculoskeletal disorders Other non‐communicable diseases Diabetes, urogenital, blood, &
endocrine diseases A. B.
MALE
NCD deaths:
77.39% of all cause deaths, 2012 (Male:
41.74%, Female:
35.65%) Premature NCD deaths in total sex‐
specific NCD deaths:
male
> before 70:
42.12%
> aged 30‐69:
41.16%
female
> before 70:
22.57%
> aged 30‐69:
21.65%
FEMALE
C.
MALE FEMALE
Fig. 1.
43.47
% 28.51
% 7.32%
5.60%
1.71%
4.72% 0.07%
0.50%
8.11%
0 5000 10000 15000 20000 25000 30000 35000 40000 45000 50000
0‐9 10‐19 20‐29 30‐39 40‐49 50‐59 60‐69 70‐79 80+
years
31.09%
37.97%
6.36%
2.24% 2.30%
9.07% 0.22%
0.70%
10.06%
0 5000 10000 15000 20000 25000 30000 35000 40000 45000 50000
0‐9 10‐19 20‐29 30‐39 40‐49 50‐59 60‐69 70‐79 80+
years
0 100000 200000 300000 400000 500000 600000 700000 800000 900000
0‐9 10‐19 20‐29 30‐39 40‐49 50‐59 60‐69 70‐79 80+
years
0 100000 200000 300000 400000 500000 600000 700000 800000 900000
0‐9 10‐19 20‐29 30‐39 40‐49 50‐59 60‐69 70‐79 80+
years 1.71%
4.72% 0.07%
0.50%
8.11%
5.60%
28.51%
43.47%
7.32%
21
Neoplasms
Cardiovascular & circulatory diseases Chronic respiratory diseases
Cirrhosis of the liver
Digestive diseases (except cirrhosis) Neurological disorders
Musculoskeletal disorders Other non‐communicable diseases Diabetes, urogenital, blood, &
endocrine diseases A. B.
MALE
NCD deaths:
77.39% of all cause deaths, 2012 (Male:
41.74%, Female:
35.65%)
Premature NCD deaths in total sex‐
specific NCD deaths:
male
> before 70:
42.12%
> aged 30‐69:
41.16%
female
> before 70:
22.57%
> aged 30‐69:
21.65%
FEMALE
C.
MALE FEMALE
Fig. 1.
43.47
% 28.51
% 7.32%
5.60%
1.71%
4.72% 0.07%
0.50%
8.11%
0 5000 10000 15000 20000 25000 30000 35000 40000 45000 50000
0‐9 10‐19 20‐29 30‐39 40‐49 50‐59 60‐69 70‐79 80+
years
31.09%
37.97%
6.36%
2.24% 2.30%
9.07% 0.22%
0.70%
10.06%
0 5000 10000 15000 20000 25000 30000 35000 40000 45000 50000
0‐9 10‐19 20‐29 30‐39 40‐49 50‐59 60‐69 70‐79 80+
years
0 100000 200000 300000 400000 500000 600000 700000 800000 900000
0‐9 10‐19 20‐29 30‐39 40‐49 50‐59 60‐69 70‐79 80+
years
0 100000 200000 300000 400000 500000 600000 700000 800000 900000
0‐9 10‐19 20‐29 30‐39 40‐49 50‐59 60‐69 70‐79 80+
years Neoplasms
Cardiovascular & circulatory diseases Chronic respiratory diseases
Cirrhosis of the liver
Digestive diseases (except cirrhosis) Neurological disorders
Musculoskeletal disorders Other non-communicable diseases
Diabetes, urogenital, blood, & endocrine diseases
21
Neoplasms
Cardiovascular & circulatory diseases Chronic respiratory diseases
Cirrhosis of the liver
Digestive diseases (except cirrhosis) Neurological disorders
Musculoskeletal disorders Other non‐communicable diseases Diabetes, urogenital, blood, &
endocrine diseases A. B.
MALE
NCD deaths:
77.39% of all cause deaths, 2012 (Male:
41.74%, Female:
35.65%) Premature NCD deaths in total sex‐
specific NCD deaths:
male
> before 70:
42.12%
> aged 30‐69:
41.16%
female
> before 70:
22.57%
> aged 30‐69:
21.65%
FEMALE
C.
MALE FEMALE
Fig. 1.
43.47
% 28.51
% 7.32%
5.60%
1.71%
4.72% 0.07%
0.50%
8.11%
0 5000 10000 15000 20000 25000 30000 35000 40000 45000 50000
0‐9 10‐19 20‐29 30‐39 40‐49 50‐59 60‐69 70‐79 80+
years
31.09%
37.97%
6.36%
2.24% 2.30%
9.07% 0.22%
0.70%
10.06%
0 5000 10000 15000 20000 25000 30000 35000 40000 45000 50000
0‐9 10‐19 20‐29 30‐39 40‐49 50‐59 60‐69 70‐79 80+
years
0 100000 200000 300000 400000 500000 600000 700000 800000 900000
0‐9 10‐19 20‐29 30‐39 40‐49 50‐59 60‐69 70‐79 80+
years
0 100000 200000 300000 400000 500000 600000 700000 800000 900000
0‐9 10‐19 20‐29 30‐39 40‐49 50‐59 60‐69 70‐79 80+
years Year
0-9 10-19 20-29 30-39 40-49 50-59 60-69 70-79 80+
50,000 45,000 40,000 35,000 30,000 25,000 20,000 15,000 10,000 5,000 0
N CD deaths: 77.39% of all cause deaths, 2012 (Male: 41.74%, Female:
35.65%)
P remature NCD deaths in total sex-specific NCD deaths:
male
> before 70: 42.12%
> aged 30-69: 41.16%
female
> before 70: 22.57%
> aged 30-69: 21.65%
21
Neoplasms
Cardiovascular & circulatory diseases Chronic respiratory diseases
Cirrhosis of the liver
Digestive diseases (except cirrhosis) Neurological disorders
Musculoskeletal disorders Other non‐communicable diseases Diabetes, urogenital, blood, &
endocrine diseases A. B.
MALE
NCD deaths:
77.39% of all cause deaths, 2012 (Male:
41.74%, Female:
35.65%)
Premature NCD deaths in total sex‐
specific NCD deaths:
male
> before 70:
42.12%
> aged 30‐69:
41.16%
female
> before 70:
22.57%
> aged 30‐69:
21.65%
FEMALE
C.
MALE FEMALE
Fig. 1.
43.47
% 28.51
% 7.32%
5.60%
1.71%
4.72% 0.07%
0.50%
8.11%
0 5000 10000 15000 20000 25000 30000 35000 40000 45000 50000
0‐9 10‐19 20‐29 30‐39 40‐49 50‐59 60‐69 70‐79 80+
years
31.09%
37.97%
6.36%
2.24% 2.30%
9.07% 0.22%
0.70%
10.06%
0 5000 10000 15000 20000 25000 30000 35000 40000 45000 50000
0‐9 10‐19 20‐29 30‐39 40‐49 50‐59 60‐69 70‐79 80+
years
0 100000 200000 300000 400000 500000 600000 700000 800000 900000
0‐9 10‐19 20‐29 30‐39 40‐49 50‐59 60‐69 70‐79 80+
years
0 100000 200000 300000 400000 500000 600000 700000 800000 900000
0‐9 10‐19 20‐29 30‐39 40‐49 50‐59 60‐69 70‐79 80+
years Year
0-9 10-19 20-29 30-39 40-49 50-59 60-69 70-79 80+
50,000 45,000 40,000 35,000 30,000 25,000 20,000 15,000 10,000 5,000 0
21
Neoplasms
Cardiovascular & circulatory diseases Chronic respiratory diseases
Cirrhosis of the liver
Digestive diseases (except cirrhosis) Neurological disorders
Musculoskeletal disorders Other non‐communicable diseases Diabetes, urogenital, blood, &
endocrine diseases A. B.
MALE
NCD deaths:
77.39% of all cause deaths, 2012 (Male:
41.74%, Female:
35.65%)
Premature NCD deaths in total sex‐
specific NCD deaths:
male
> before 70:
42.12%
> aged 30‐69:
41.16%
female
> before 70:
22.57%
> aged 30‐69:
21.65%
FEMALE
C.
MALE FEMALE
Fig. 1.
43.47
% 28.51
% 7.32%
5.60%
1.71%
4.72% 0.07%
0.50%
8.11%
0 5000 10000 15000 20000 25000 30000 35000 40000 45000 50000
0‐9 10‐19 20‐29 30‐39 40‐49 50‐59 60‐69 70‐79 80+
years
31.09%
37.97%
6.36%
2.24% 2.30%
9.07% 0.22%
0.70%
10.06%
0 5000 10000 15000 20000 25000 30000 35000 40000 45000 50000
0‐9 10‐19 20‐29 30‐39 40‐49 50‐59 60‐69 70‐79 80+
years
0 100000 200000 300000 400000 500000 600000 700000 800000 900000
0‐9 10‐19 20‐29 30‐39 40‐49 50‐59 60‐69 70‐79 80+
years
0 100000 200000 300000 400000 500000 600000 700000 800000 900000
0‐9 10‐19 20‐29 30‐39 40‐49 50‐59 60‐69 70‐79 80+
years Female
2.24% 2.30%
6.36% 9.07% 0.22%
0.70%
10.06%
31.09%
37.97%
21
Neoplasms
Cardiovascular & circulatory diseases Chronic respiratory diseases
Cirrhosis of the liver
Digestive diseases (except cirrhosis) Neurological disorders
Musculoskeletal disorders Other non‐communicable diseases Diabetes, urogenital, blood, &
endocrine diseases A. B.
MALE
NCD deaths:
77.39% of all cause deaths, 2012 (Male:
41.74%, Female:
35.65%)
Premature NCD deaths in total sex‐
specific NCD deaths:
male
> before 70:
42.12%
> aged 30‐69:
41.16%
female
> before 70:
22.57%
> aged 30‐69:
21.65%
FEMALE
C.
MALE FEMALE
Fig. 1.
43.47
% 28.51
% 7.32%
5.60%
1.71%
4.72% 0.07%
0.50%
8.11%
0 5000 10000 15000 20000 25000 30000 35000 40000 45000 50000
0‐9 10‐19 20‐29 30‐39 40‐49 50‐59 60‐69 70‐79 80+
years
31.09%
37.97%
6.36%
2.24% 2.30%
9.07% 0.22%
0.70%
10.06%
0 5000 10000 15000 20000 25000 30000 35000 40000 45000 50000
0‐9 10‐19 20‐29 30‐39 40‐49 50‐59 60‐69 70‐79 80+
years
0 100000 200000 300000 400000 500000 600000 700000 800000 900000
0‐9 10‐19 20‐29 30‐39 40‐49 50‐59 60‐69 70‐79 80+
years
0 100000 200000 300000 400000 500000 600000 700000 800000 900000
0‐9 10‐19 20‐29 30‐39 40‐49 50‐59 60‐69 70‐79 80+
years Year
0-9 10-19 20-29 30-39 40-49 50-59 60-69 70-79 80+
900,000 800,000 700,000 600,000 500,000 400,000 300,000 200,000 100,000 0
Male
21
Neoplasms
Cardiovascular & circulatory diseases Chronic respiratory diseases
Cirrhosis of the liver
Digestive diseases (except cirrhosis) Neurological disorders
Musculoskeletal disorders Other non‐communicable diseases Diabetes, urogenital, blood, &
endocrine diseases A. B.
MALE
NCD deaths:
77.39% of all cause deaths, 2012 (Male:
41.74%, Female:
35.65%)
Premature NCD deaths in total sex‐
specific NCD deaths:
male
> before 70:
42.12%
> aged 30‐69:
41.16%
female
> before 70:
22.57%
> aged 30‐69:
21.65%
FEMALE
C.
MALE FEMALE
Fig. 1.
43.47
% 28.51
% 7.32%
5.60%
1.71%
4.72% 0.07%
0.50%
8.11%
0 5000 10000 15000 20000 25000 30000 35000 40000 45000 50000
0‐9 10‐19 20‐29 30‐39 40‐49 50‐59 60‐69 70‐79 80+
years
31.09%
37.97%
6.36%
2.24% 2.30%
9.07% 0.22%
0.70%
10.06%
0 5000 10000 15000 20000 25000 30000 35000 40000 45000 50000
0‐9 10‐19 20‐29 30‐39 40‐49 50‐59 60‐69 70‐79 80+
years
0 100000 200000 300000 400000 500000 600000 700000 800000 900000
0‐9 10‐19 20‐29 30‐39 40‐49 50‐59 60‐69 70‐79 80+
years
0 100000 200000 300000 400000 500000 600000 700000 800000 900000
0‐9 10‐19 20‐29 30‐39 40‐49 50‐59 60‐69 70‐79 80+
years Year
0-9 10-19 20-29 30-39 40-49 50-59 60-69 70-79 80+
900,000 800,000 700,000 600,000 500,000 400,000 300,000 200,000 100,000 0
Female
A B
C
http://jkms.org S161
https://doi.org/10.3346/jkms.2016.31.S2.S158
en had a higher number of deaths than men in their 80s. NCDs before 70 years of age accounted for 42.12% of premature deaths in men and 22.57% in women. Between 30-69 years of age, NCDs accounted for 41.16% of deaths in men and 21.65% in women.
Incidence in 2012
Fig. 1C shows the proportion, number, and age of people newly diagnosed with each NCD by sex in 2012. The patterns were similar for both sexes, although starting at 20 years of age, more overall cases occurred among women. Men and women aged 50-59 years showed the highest number of incidence cases.
DALYs in 2012
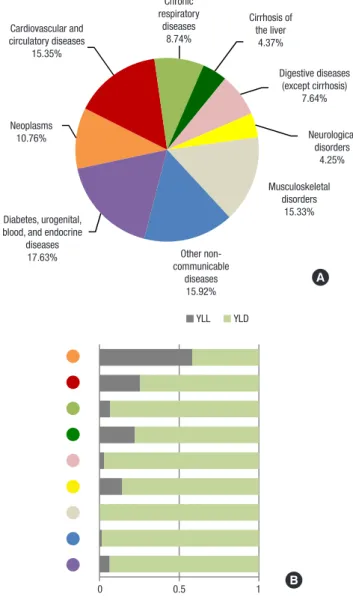
Per 100,000 population, 21,019 DALYs were lost to 116 NCDs in 2012, of which 13.97% were due to premature death and 86.03%
to non-fatal health outcomes. YLDs made a larger contribution
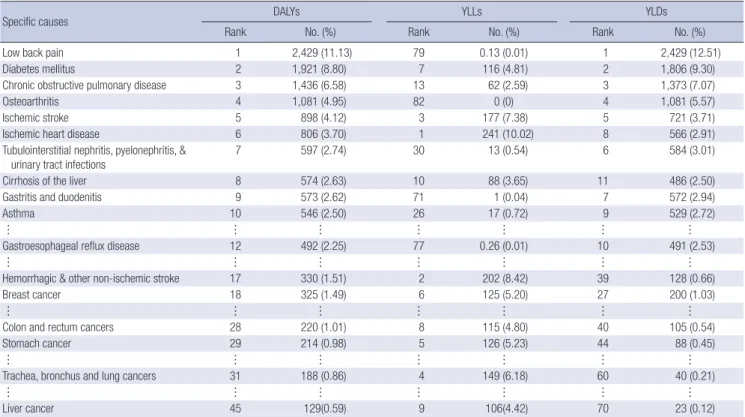
than YLLs to the NCD burden in all broad cause groups except neoplasms (Fig. 2). Fig. 2 shows the percent of DALYs lost to each of the nine broad groups of NCDs, as well as their YLL and YLD components. Table 1 lists the major specific causes account- ing for more than 1% of total NCD DALYs in each of the nine broad categories. Table 2A and 2B present the leading 10 causes of YLLs, YLDs, and DALYs by sex. The leading 10 causes account- ed for about half of the total NCD DALYs - 51.76% in men and 49.77% in women. The life cycle burden caused by each of the 10 sex-specific leading causes of DALYs is shown in Fig. 3 for males and in Fig. 4 for females. Premature death, represented by YLLs, was more frequent in men and was mainly caused by cirrhosis of the liver; ischemic heart disease (IHD); chronic ob- structive pulmonary disease (COPD); ischemic stroke; trachea, bronchus and lung cancers (TBL); and liver cancer. Even males as young as 10-29 years old experienced low back pain and cir-
Fig. 2. Proportions of disability-adjusted life years (DALYs) (A) with the YLL and YLD as a proportion of total DALYs (B) according to broad 9 cause groups in 2012.
YLL, years of life lost due to premature mortality; YLD, years lived with a disability.
22
Fig. 2.
Neoplasms 10.76%
Cardiovascular and circulatory
diseases 15.35%
Chronic respiratory
diseases 8.74%
Cirrhosis of the liver 4.37%
Digestive diseases (except cirrhosis)
7.64%
Neurological disorders
4.25%
Musculoskeletal disorders
15.33%
Other non‐
communicable diseases
15.92%
Diabetes, urogenital, blood,
and endocrine diseases
17.63%
0 0.5 1
YLL YLD
A. Chronic B.
respiratory diseases
8.74%
Cirrhosis of the liver
4.37%
Digestive diseases (except cirrhosis)
7.64%
Neurological disorders
4.25%
Musculoskeletal disorders
15.33%
Other non- communicable
diseases 15.92%
Diabetes, urogenital, blood, and endocrine
diseases 17.63%
Neoplasms 10.76%
Cardiovascular and circulatory diseases
15.35%
A
22
Fig. 2.
Neoplasms 10.76%
Cardiovascular and circulatory
diseases 15.35%
Chronic respiratory
diseases 8.74%
Cirrhosis of the liver 4.37%
Digestive diseases (except cirrhosis)
7.64%
Neurological disorders
4.25%
Musculoskeletal disorders
15.33%
Other non‐
communicable diseases
15.92%
Diabetes, urogenital, blood,
and endocrine diseases
17.63%
0 0.5 1
YLL YLD
A. B.
0 0.5 1
YLL YLD
B
Table 1. Disability-adjusted life years (DALYs) ranked by 9 broad cause groups, 2012
Rank Broad cause group
Specific cause in the group DALYs % of Total NCD DALYs 1 Diabetes, urogenital, blood, & endocrine diseases
Diabetes mellitus
Tubulointerstitial nephritis, pyelonephritis, & urinary tract infections
Benign prostatic hyperplasia
3,706 2,181 402 308
17.63 10.37 1.91 1.47 2 Other non-communicable diseases
Periodontal disease
Refraction & accommodation disorders Vision loss
Glaucoma Eczema Dental caries
Abscess, impetigo, and other bacterial skin diseases Cataracts
Cellulitis
3,346 425 353 290 276 250 242 238 234 216
15.92 2.02 1.68 1.38 1.31 1.19 1.15 1.13 1.11 1.03 3 Cardiovascular & circulatory diseases
Ischemic heart disease Ischemic stroke
Hemorrhagic & other non-ischemic stroke Hypertensive heart disease
3,226 1,011 954 366 361
15.35 4.81 4.54 1.74 1.72 4 Musculoskeletal disorders
Low back pain Osteoarthritis Neck pain
3,223 1,915 701 283
15.33 9.11 3.34 1.34 5 Neoplasms
Trachea, bronchus & lung cancers Stomach cancer
Liver cancer Colon & rectum cancers
2,261 318 306 288 273
10.76 1.51 1.46 1.37 1.30 6 Chronic respiratory diseases
Chronic obstructive pulmonary disease Asthma
1,838 1,305 491
8.74 6.21 2.34 7 Digestive diseases (except cirrhosis)
Gastritis & duodenitis Gastroesophageal reflux disease
1,607 441 413
7.64 2.10 1.96
8 Cirrhosis of the liver 919 4.37
9 Neurological disorders
Alzheimer’s disease & other dementias Epilepsy
894 383 214
4.25 1.82 1.02 DALYs per 100,000 population. Specific causes accounting for more than 1% of total DALYs are included and ranked within each group.
S162 http://jkms.org https://doi.org/10.3346/jkms.2016.31.S2.S158 rhosis of the liver. The overall YLD share was larger in women.
Burden from musculoskeletal conditions (MSK) such as low back pain and osteoarthritis was apparently higher in women.
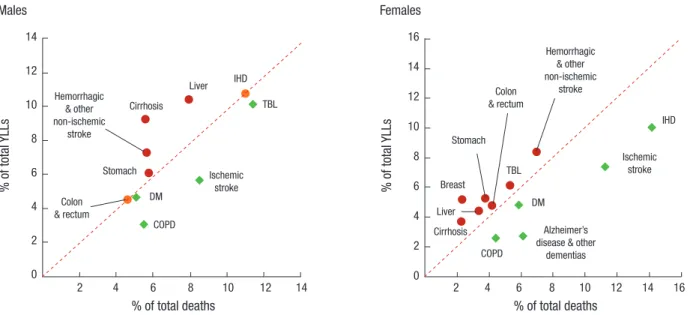
Fig. 5 presents the shifts in relative importance of the top ten causes of YLL or death for each sex that occur upon consider- ing the age at death for each cause. The top three causes with a high frequency of death in men - TBL cancers (11.45% of total
deaths), IHD (11.04%), and ischemic stroke (8.53%) - became less important when the age at death was taken into account, demonstrated by their contribution of 10.13%, 10.78%, and 5.63% of total YLLs, respectively. Four other causes became more important, including, from largest to smallest shift in im- portance, cirrhosis of the liver (5.60% of total deaths), liver can- cer (7.92%), hemorrhagic and other non-ischemic stroke (5.63%), Table 2A. Top 10 specific causes of years of life lost (YLLs) due to premature mortality, years lived with a disability (YLDs), and disability-adjusted life years (DALYs) in 2012 by sex: male cases
Specific causes DALYs YLLs YLDs
Rank No. (%) Rank No. (%) Rank No. (%)
Diabetes mellitus 1 2,439 (12.06) 8 161 (4.65) 1 2,278 (13.60)
Low back pain 2 1,402 (6.93) 80 0.09 (0.003) 2 1,401 (8.37)
Cirrhosis of the liver 3 1,262 (6.24) 4 320 (9.22) 4 942 (5.63)
Ischemic heart disease 4 1,214 (6.01) 1 374 (10.78) 5 841 (5.02)
Chronic obstructive pulmonary disease 5 1,175 (5.81) 10 106 (3.06) 3 1,069 (6.38)
Ischemic stroke 6 1,009 (4.99) 7 195 (5.63) 6 814 (4.86)
Benign prostatic hyperplasia 7 616 (3.05) 81 0 (0) 7 616 (3.68)
Periodontal disease 8 453 (2.24) 81 0 (0) 8 453 (2.70)
Trachea, bronchus and lung cancers 9 447 (2.21) 3 351 (10.13) 39 96 (0.57)
Liver cancer 10 447 (2.21) 2 362 (10.44) 40 85 (0.50)
Asthma 11 436 (2.15) 30 16 (0.45) 9 420 (2.51)
Hemorrhagic & other non-ischemic stroke 12 402 (1.99) 5 253 (7.29) 32 149 (0.89)
Stomach cancer 13 399 (1.97) 6 212 (6.11) 27 187 (1.12)
Gastroesophageal reflux disease 14 334 (1.65) 78 0.25 (0.01) 10 334 (1.99)
Colon and rectum cancers 15 326 (1.61) 9 158 (4.55) 29 168 (1.00)
YLLs, YLDs, DALYs per 100,000 males. Sums may not add up to exact total due to rounding.
Table 2B. Top 10 specific causes of years of life lost (YLLs) due to premature mortality, years lived with a disability (YLDs), and disability-adjusted life years (DALYs) in 2012 by sex: female cases
Specific causes DALYs YLLs YLDs
Rank No. (%) Rank No. (%) Rank No. (%)
Low back pain 1 2,429 (11.13) 79 0.13 (0.01) 1 2,429 (12.51)
Diabetes mellitus 2 1,921 (8.80) 7 116 (4.81) 2 1,806 (9.30)
Chronic obstructive pulmonary disease 3 1,436 (6.58) 13 62 (2.59) 3 1,373 (7.07)
Osteoarthritis 4 1,081 (4.95) 82 0 (0) 4 1,081 (5.57)
Ischemic stroke 5 898 (4.12) 3 177 (7.38) 5 721 (3.71)
Ischemic heart disease 6 806 (3.70) 1 241 (10.02) 8 566 (2.91)
Tubulointerstitial nephritis, pyelonephritis, &
urinary tract infections 7 597 (2.74) 30 13 (0.54) 6 584 (3.01)
Cirrhosis of the liver 8 574 (2.63) 10 88 (3.65) 11 486 (2.50)
Gastritis and duodenitis 9 573 (2.62) 71 1 (0.04) 7 572 (2.94)
Asthma 10 546 (2.50) 26 17 (0.72) 9 529 (2.72)
… … … … … … …
Gastroesophageal reflux disease 12 492 (2.25) 77 0.26 (0.01) 10 491 (2.53)
… … … … … … …
Hemorrhagic & other non-ischemic stroke 17 330 (1.51) 2 202 (8.42) 39 128 (0.66)
Breast cancer 18 325 (1.49) 6 125 (5.20) 27 200 (1.03)
… … … … … … …
Colon and rectum cancers 28 220 (1.01) 8 115 (4.80) 40 105 (0.54)
Stomach cancer 29 214 (0.98) 5 126 (5.23) 44 88 (0.45)
… … … … … … …
Trachea, bronchus and lung cancers 31 188 (0.86) 4 149 (6.18) 60 40 (0.21)
… … … … … … …
Liver cancer 45 129(0.59) 9 106(4.42) 70 23 (0.12)
YLLs, YLDs, DALYs per 100,000 females. Sums may not add up to exact total due to rounding.
http://jkms.org S163
https://doi.org/10.3346/jkms.2016.31.S2.S158
Fig. 3. Top 10 causes of disability-adjusted life years (DALYs) with the YLL and YLD shares in males by age-group. X-axis: age group, Y-axis: DALYs per 100,000 males. The maximum value of the Y-axis was tailored to the distribution.
YLL, years of life lost due to premature mortality; YLD, years lived with a disability.
23
Rank 1. Diabetes mellitus Rank 6. Ischemic stroke YLL YLD
Rank 2. Low back pain Rank 7. Benign prostatic hyperplasia
Rank 3. Cirrhosis of the liver Rank 8. Periodontal disease
Rank 4. Ischemic heart disease Rank 9. Trachea, bronchus and lung cancers
Rank 5. Chronic obstructive pulmonary disease Rank 10. Liver cancer
Fig. 3.
0 200 400 600 800 1000
0‐9 10‐19 20‐29 30‐39 40‐49 50‐59 60‐69 70‐79 80+
0 50 100 150 200 250 300
0‐9 10‐19 20‐29 30‐39 40‐49 50‐59 60‐69 70‐79 80+
0 100 200 300 400
0‐9 10‐19 20‐29 30‐39 40‐49 50‐59 60‐69 70‐79 80+
0 50 100 150 200 250
0‐9 10‐19 20‐29 30‐39 40‐49 50‐59 60‐69 70‐79 80+
0 100 200 300 400 500
0‐9 10‐19 20‐29 30‐39 40‐49 50‐59 60‐69 70‐79 80+ 0 50 100 150 200
0‐9 10‐19 20‐29 30‐39 40‐49 50‐59 60‐69 70‐79 80+
0 100 200 300 400
0‐9 10‐19 20‐29 30‐39 40‐49 50‐59 60‐69 70‐79 80+ 0 50 100 150 200
0‐9 10‐19 20‐29 30‐39 40‐49 50‐59 60‐69 70‐79 80+
0 50 100 150 200 250
0‐9 10‐19 20‐29 30‐39 40‐49 50‐59 60‐69 70‐79 80+
0 50 100 150 200
0‐9 10‐19 20‐29 30‐39 40‐49 50‐59 60‐69 70‐79 80+
Rank 1. Diabetes mellitus
0-9 10-19 20-29 30-39 40-49 50-59 60-69 70-79 80+
1,000 800 600 400 200 0
23
Rank 1. Diabetes mellitus Rank 6. Ischemic stroke YLL YLD
Rank 2. Low back pain Rank 7. Benign prostatic hyperplasia
Rank 3. Cirrhosis of the liver Rank 8. Periodontal disease
Rank 4. Ischemic heart disease Rank 9. Trachea, bronchus and lung cancers
Rank 5. Chronic obstructive pulmonary disease Rank 10. Liver cancer
Fig. 3.
0 200 400 600 800 1000
0‐9 10‐19 20‐29 30‐39 40‐49 50‐59 60‐69 70‐79 80+
0 50 100 150 200 250 300
0‐9 10‐19 20‐29 30‐39 40‐49 50‐59 60‐69 70‐79 80+
0 100 200 300 400
0‐9 10‐19 20‐29 30‐39 40‐49 50‐59 60‐69 70‐79 80+
0 50 100 150 200 250
0‐9 10‐19 20‐29 30‐39 40‐49 50‐59 60‐69 70‐79 80+
0 100 200 300 400 500
0‐9 10‐19 20‐29 30‐39 40‐49 50‐59 60‐69 70‐79 80+
S164 http://jkms.org https://doi.org/10.3346/jkms.2016.31.S2.S158 Fig. 4. Top 10 causes of disability-adjusted life years (DALYs) with the YLL and YLD shares in females by age-group. X-axis: age group, Y-axis: DALYs per 100,000 females. The maximum value of the Y-axis was tailored to the distribution.
YLL, years of life lost due to premature mortality; YLD, years lived with a disability.
24
Rank 2. Diabetes mellitus Rank 7. Tubulointerstitial nephritis, pyelonephritis,
& urinary tract infections
Rank 3. Chronic obstructive pulmonary disease Rank 8. Cirrhosis of the liver
Rank 4. Osteoarthritis Rank 9. Gastritis and duodenitis
Rank 5. Ischemic stroke Rank 10. Asthma
Fig. 4.
0 200 400 600
0‐9 10‐19 20‐29 30‐39 40‐49 50‐59 60‐69 70‐79 80+
0 50 100 150 200
0‐9 10‐19 20‐29 30‐39 40‐49 50‐59 60‐69 70‐79 80+
0 100 200 300 400 500 600 700
0‐9 10‐19 20‐29 30‐39 40‐49 50‐59 60‐69 70‐79 80+
0 50 100 150
0‐9 10‐19 20‐29 30‐39 40‐49 50‐59 60‐69 70‐79 80+
http://jkms.org S165
https://doi.org/10.3346/jkms.2016.31.S2.S158
Fig. 5. Comparison of the proportional distribution of death and years of life lost (YLL) by leading cause of death, 2012.
Cirrhosis, cirrhosis of the liver; liver, liver cancer; IHD, ischemic heart disease; TBL, trachea, bronchus and lung cancers; stomach, stomach cancer; colon & rectum, colon and rectum cancers; DM, diabetes mellitus; COPD, chronic obstructive pulmonary disease; breast, breast cancer.
% of total YLLs
% of total deaths
2 4 6 8 10 12 14
14 12 10 8 6 4 2 0
Hemorrhagic
& other non-ischemic
stroke
Cirrhosis
Liver IHD
TBL
Ischemic stroke
COPD Colon DM
& rectum Stomach
% of total YLLs
% of total deaths
2 4 6 8 10 12 14 16 16
14 12 10 8 6 4 2 0
Hemorrhagic
& other non-ischemic
stroke
Cirrhosis Liver
Breast
IHD
TBL
Ischemic stroke
Alzheimer’s disease & other
dementias COPD
DM Colon
& rectum
Stomach
Males Females
6.18%, and 4.80% of total YLLs, respectively.
DISCUSSION
Disease mortality, incidence, and prevalence data are tradition- al measures of a population’s burden of disease, and premature mortality can be used to assess the impact of NCDs (17). A health problem or disease can have a relatively low incidence but cause serious disability or death, resulting in a high disease burden.
Conversely, some common illnesses may cause a much smaller burden (18). Using DALYs, we were able to assess the impact of both fatal and non-fatal outcomes by considering the age and life expectancy at the time of each cause-specific death as well as the relative severity of various disabilities. Converting those data to years of health loss, we were able to provide a different view compared to a simple rank order of deaths or incidences;
specifically, a view that allows comparisons among the burdens of a broad range of NCDs by sex and by age.
The top 5 broad groups that caused a large number of DALYs were diabetes, urogenital, blood, and endocrine diseases; other non-communicable diseases; cardiovascular and circulatory diseases; MSK; and neoplasms. The top 10 specific causes of DALYs in both sexes included, in order of importance, diabetes mellitus (DM), low back pain, COPD, IHD, ischemic stroke, cir- rhosis of the liver, osteoarthritis, asthma, gastritis and duodeni- tis, and periodontal disease. Our results show that non-fatal outcomes contribute more significantly than premature death to the nation’s disease burden, which is consistent with the state- ment from Murray et al. that “what ails most persons is not nec- essarily what kills them” (19). Some of the top 10 causes of YLLs were also among the top 10 causes of DALYs, including cirrho-
sis of the liver, IHD, COPD, ischemic stroke and two types of cancer (TBL and liver cancers) in men and DM, ischemic stroke, IHD, and cirrhosis of the liver in women. Although these were all main causes of premature death, the fraction of DALYs from YLLs was relatively low for these causes, ranging from 6.02% to 30.8%, except the two cancers in men (78.6% for TBL cancers and 81.1% for liver cancer).
The finding that low back pain was the most frequent cause of outpatient cases and the second greatest burden, with 99.81%
of its DALYs resulting from YLDs in both sexes, is in line with the worldwide trend of high prevalence and high burden of MSK conditions (20-24). Because of their long-term pain and physical disability, MSK conditions are costly for individuals and for society. Even though the burden of these conditions is projected to increase as the population ages and becomes more obese (25), a population-based understanding of the magni- tude of the problem is lacking. Research to assess the most ef- fective and affordable strategies for MSK prevention and man- agement is urgently needed, as is targeted and practical plan- ning to deal with the increased healthcare burden caused by these conditions. Diabetes mellitus has continuously been with- in the top 3 causes of disease burden in both sexes since this population-level study began in 2002 (26, 27), and high-risk populations are increasing; as of 2013, one in four adults had impaired fasting glucose (28). Alarmingly, the number of child- hood and adolescent patients with type 2 diabetes has also been increasing steadily since 2006 (28). If this trend continues, the diabetic population is likely to double by 2050, reaching 6 mil- lion (29).
NCD patients often fail to recognize the progression of their disease and present at hospitals only when their disease has