황금추출물이 인간 유래 자궁경부암세포의 유전자발현에 미치는 영향
동신대학교 한의과대학 한방부인과교실 조현정, 구희준, 조성희, 박경미, 양승정
ABSTRACT
Effects of Scutellariae Radix on Gene Expression of Human Cervical Cancer Cells(SNU-703)
Hyun-Jung Jo, Hee-Jun Gu, Seong-Hee Cho, Kyung-Mi Park, Seung-Jeong Yang
Dept. of Gynecology, College of Oriental Medicine, Dongshin University Purpose: In the theory of traditional medicine, Scutellariae Radix (SR) can clear away heat and remove dampness, purge the sthenic fire and remove toxic materials, cool blood and stop bleeding to prevent miscarriage. Recently, SR is known to have anti-cancer activity. For this reason, the present author designed to investigate the effect of SR on proliferation rates of cervical cancer cell line, then effects on genetic profile by SR.
Methods: The genetic profile for the effect of SR on human derived cervical cancer cell line, SNU-703, was measured using microarray technique, and the functional analysis on these genes was conducted.
Results: Total 519 genes were up-regulated and 606 genes down-regulated in cells treated with SR. Genes induced or suppressed by SR were all mainly concerned with metabolic process, regulation of biological process and protein binding. The network of total protein interactions was measured using cytoscape program, and some key molecules, such as TNFRSF1A, AKT1, MAPK3, and STAT3 that can be used for elucidation of therapeutical mechanism of medicine in future were identified.
Conclusion: These results suggest possibility of SR as anti-cancer drug and also suggest that related mechanisms are involved in TNFRSF1A, AKT1, MAPK3, and STAT3 related signalling pathways.
Key Words: Cervical cancer, Scutellariae Radix, Gene expression, Anticancer drug, Microarray
8)
교신저자
(
조성희) :
광주광역시 남구 월산동377-12
번지 동신대학교광주한방병원 부인과Ⅰ. 서 론
자궁경부암은 여성 생식기에 발생하는 악성 종양 중 가장 흔한 질환으로 최근 자궁 경부 세포진 검사의 일반화로 조기 진단 비율이 높아져 사망률이 감소하고 있으나, 세계적으로는 아직도 높은 사망 률을 보이는 질환이다 1-3) .
자궁경부암은 전암단계인 상피내암의 상 태를 거쳐 침윤성 암으로 진행되며, 조기에 시작된 성교, 배우자의 수, 남성요인, 인유 두종 바이러스 (human papillomavirus, HPV)감염 등의 영향으로 발병하는 것 으로 알려져 있다 2-5) . 가장 흔한 증상으 로는 성교후 질출혈이 있으며, 진행된 환자에서는 악취성 질 분비물, 골반통, 요통, 폐쇄성 요로병변 등이 나타날 수 있다 5,6) .
한의학적으로 자궁경부암은 ‘崩漏’, ‘帶 下’, ‘癥瘕’, ‘血枯’, ‘五色帶下’ 등의 범주 에 속하며 3) , 출혈이나 분비물 등의 동반 증상으로 볼 때 ‘帶下’, ‘五色帶下’와 유 사한 질환으로 볼 수 있다.
현재까지 자궁경부암과 관련된 여러 실험적인 연구가 이루어져 왔는데, 복합 처방으로는 當歸芍藥散 7) , 桂枝茯笭丸 8) , 濟川煎 9) 등이 있고, 단미제로는 生地黃
10) , 半枝蓮 11) , 虎杖根 12) 등이 있다.
황금은 꿀풀과에 속한 다년생본초인 속썩은풀의 뿌리로 淸熱燥濕, 瀉火解毒, 止血安胎 등의 효능이 있어, 濕溫, 暑溫, 胸悶嘔惡, 濕熱痞滿, 瀉痢, 黃疸, 肺熱咳 嗽, 高熱煩渴, 血熱吐衄, 癰腫瘡毒, 胎動 不安 등을 치료하는데 사용되고 있다.
《神農本草經》에 中品으로 처음 기재된 이후 임상에 사용되었는데, 性은 寒하고 味는 苦하며, 肺, 膽, 胃, 大腸에 귀경한
다 13-15) . 최근 황금에 관한 약리학적 연구
로 항종양 16,17) , 항산화 18,19) , 항염증 20) 에 관한 효과 등이 보고되고 있으며 그 외 에 천식 21) , 비만세포억제 22) , 간세포보호
23) 등 여러 분야에서 연구가 활발히 진 행되고 있다.
DNA 칩 기술은 대규모 유전자발현 연구에 유용한 방법으로 유전자 발현을 분석하는 표준화된 분자생물학적 기법으 로 인정받고 있다 24) . 최근 들어 거의 모 든 종류의 종양에 대한 DNA 칩 실험이 실행되는데, 이러한 정보를 통해 진단 마커나 치료에 필요한 타겟 물질이 선정 될 수 있다 25) .
본 연구에서는 황금이 가지는 항암효 과와 그 작용 기전을 살펴보기 위하여 자궁경부암 세포주인 SNU-703에 황금 추출물을 투여하고 세포 독성을 살펴 본 다음, RNA를 추출하여 유전자의 발현 정도를 Microarray기법으로 분석한 결과 유의한 변화가 관찰되었기에 보고하는 바이다.
Ⅱ. 재료 및 방법
1. 재 료 1) 세포주
인간 유래 자궁경부암 세포주인 SNU-703
세포주는 한국 세포주 은행 (서울, 한국)
으로부터 냉동상태로 구입하여 실험에
사용하였다. 분주 받은 세포주는 해동시
켜 배양액 속에 분주된 후, 2주 이상 계
대 배양하여 실험실 환경 및 기타 배양
환경에 충분히 적응시킨 후 증식률
(doubling time)이 구입처에서 제공한
자료와 거의 일치하게 되었을 때, 충분
히 적응하였다고 생각하고 실험에 사용 하였다.
2) 약재의 준비
본 실험에서 황금 (Scutellariae Radix, SR)은 꿀풀과에 속하는 다년생 초본인 황금 (Scutellaria baicalensis Georgi)의 주피를 벗긴 근을 절단, 건조한 것으로 동신대학교 부속한방병원에서 구입하여 사용하였다.
3) 시약 및 기기
Fetal bovine serum (Gibco LOT. NO.
1006842, FBS) 및 mRNA 분리를 위한 trizol reagent (Invitrogen, Cat# 15596-026) 는 진성 SMR (광주, 한국)을 통하여 구 입하였고, RPMI 1640 (Sigma, R4130), penicillin -streptomycin (100 units/㎖, 100 ㎍/㎕), trypsin-EDTA (Sigma) 및 기타 시약은 Sigma (St. Louis, MO, USA)제품을 구입하여 사용하였다. 측정 을 위해 micro-plate reader (Bio-rad, CA) 등이 사용되었다.
2. 방 법
1) 세포주 배양 환경
자궁경부암 세포주인 SNU-703의 생육 배지로는 RPMI 1640 (Sigma, R4130)을 사용하였고, 배지에 10% fetal bovine serum (Gibco LOT. NO. 1006842, FBS) 과 penicillin-streptomycin (100 units/㎖, 100 ㎍/㎕)을 첨가하였다. 세포주의 계 대 배양은 2일 간격으로 시행하였고, 부 착세포의 탈착을 위해서 trypsin -EDTA (Sigma, USA)를 사용하였다. 자궁경부 암 세포주는 5% CO 2 가 공여되는 배양 기 속에서 37℃를 유지하며 배양하였다.
2) 약물의 준비
세척되고 세절된 상태로 구입한 황금
100 g을 증류수 1,500 ㎖와 함께 전기약 탕기 (대웅, 한국)로 100℃에서 2시간 동 안 전탕하여 물 추출을 시행하였다. 전 탕한 추출물을 부직포로 거른 다음 동결 건조기 (삼원, 한국)를 이용하여 동결건 조 분말을 얻었다. 최종적으로 얻어진 건조분말은 11.3 g이었다. 이렇게 하여 얻어진 분말은 실험에 사용하기 위하여 인산 완충액 (phosphate buffered saline, PBS)에 다시 녹인 후, 2,000 rpm에서 15 분간 원심분리하여 찌꺼기를 제거하고, 상층액을 얻었다. 얻어진 상층액은 와트 만 지로 거른 다음 최종적으로 0.22 ㎛ 크기의 필터 (syringe filter, Whatman) 로 걸러 멸균을 대신 하였다. 이렇게 하 여 얻어진 검액은 소량씩 나누어 -20℃
에 보관하였다가 사용 직전 해동하여 사 용하였다.
3) 세포 증식률 측정
세포 증식률은 변형된 3-(4,5-dimethylthiazol
-2yl)-2,5-diphenyl-tetrazolium bromide
(MTT) 방법에 의존하였는데, 모든 과
정은 제조사에서 제공한 가이드라인에
의해 시행되었다 26) . 과정을 간단히 설명
하면 다음과 같다. 먼저 96-well plate
(Nunc, Netherlands)에 측정하고자 하는
대상 세포주를 well당 5 × 10 3 개의 분량
으로 분주하고, 37℃, 5% CO 2 가 공여되
는 환경에서 24시간을 배양하여 부착 및
안정화를 시행하였다. 24시간의 배양이
끝난 후, 상기한 방법으로 제조된 황금
을 농도별로 배양액에 희석하여 부착 및
안정화된 세포주에 공급하고, 24시간 동
안 배양 하였다. 24시간 동안의 배양이
끝난 후, 각 well당 10 ㎕의 cell counting
kit-8 (CCK-8 sol., Dojindo, Japan) 용
액을 첨가하고 37℃, 5% CO 가 공여되
는 환경에서 3시간 동안 방치하였다. 3 시간 후, micro-plate reader (Bio-rad, CA)를 이용하여 450 ㎚파장에서 흡광도 를 측정하였다. 정상 대조군으로는 약물 을 첨가하지 않은 well을 사용하였고, 결 과는 정상 대조군에 대한 백분율로 환산 하여 나타내었다. 또 다른 대조군으로는 임의로 선택한 강황을 사용하였다.
4) RNA 분리를 위한 약물 처리 및 실 험군 분류
1×10 6 개의 자궁경부암 세포를 100 Φ dish (SPL, 한국)에 분주한 후, 37℃, 5% CO 2 가 공여되는 환경에서 24시간을 배양하여 부착 및 안정화를 시행하였다.
24시간의 배양이 끝난 후, 실험군은 황 금을 1.25 ㎎/㎖ 농도로 투여하고 다시 24시간 동안 배양하였다. 정상 대조군으 로는 실험군과 동일한 조건에서 배양한 후, 동일한 용량의 인산 완충액을 투여하 였다.
5) RNA 분리
Microarray 분석을 위한 RNA 분리는 Florell 등 27) 의 방법을 변형하여 시행되 었다. 상기한 방법으로 약물을 투여하고 24시간이 지난 후, 생육 배지를 완전히 제거한 다음, 인산 완충액을 이용하여 3 번 수세 하였다. 수세 과정이 끝난 후, 각각 의 dish에 2㎖의 trizol reagent (Invitrogen, Cat# 15596-026)를 넣고 pipet을 이용하 여 세포를 분리수거 한 다음 바로 동결 시킨 후 액체질소에 보관하였다가 RNA 분리에 사용하였다. 동결세포로부터 total RNA를 분리하였는데, 이것은 Qiagen에 서 제시한 방법에 따라 이루어졌다.
6) RNA 추출 정도 관리
Total RNA를 아가로스겔 상에서 전 기영동한 후 28S/18S RNA의 비율을 측
정하여 정도 관리하여 분석 적합 판정을 확인한 후 실험을 진행하였다. Microarray 실험에 있어서 결과에 영향을 주는 여러 가지 factor들 중 가장 중요한 것이 RNA 이며 28) , 이 RNA 상태를 확인하기 위해 Agilent사의 bioanalyzer 2100을 사용하여 rRNA ratio (28S/18S ribosomal RNA)를 확인함으로써 판정하였다.
7) DNA 칩을 이용한 실험
45K oligo-chip 29) 을 이용하여 실험을 수행하였다. 탐침 준비와 혼성화 반응은 3DNA array detection system을 이용하 여 수행하였다 (Genisphere, PA). 형광 표지된 cDNA 제작시 20 ㎍ total RNA를 사용하였다. 어레이를 씻어낸 후 scanarray scanner (Perkin-Elmer, Boston, MA)로 스캔하였다. 정상 RNA를 레퍼런스로 사 용하여 DNA 칩상의 대다수 cDNA spots (85% 이상)이 검출됨을 확인하였다.
8) 데이터분석
이미지파일에서 imagene 4.0 (Bio-discovery, Marina del Rey, CA)을 사용하여 1차 데 이터를 얻은 후 locally weighted scatterplot smoothing method (lowess method) 30) 를 사용하여 표준화하였다. 모든 칩상의 spot 에서, 각 채널의 형광 강도가 배경의 형 광 강도보다 1.5배 더 큰 경우에 한해 제 대로 측정된 것으로 판단하여 선별하였 고, 시료에서 제대로 측정되지 않은 것은 제외시켰다. 발현 비율은 cluster를 이용 하여 순차적 클러스터링한 후 treeview 31) 를 이용하여 시각화하였다.
유전자 기능분석은 fatigo algorithms
(Http://babelomics.bioinfo.cipf.es)를 이
용하여 수행하였다. 클래스간 비교분석을 통
해 얻어진 결과는 false discovery rate (FDR)
값이 0.05 이하일 때 의미있는 것으로 판
단하였다. 단백질 결합은 BOND 데이터베 이스 (http://bond.unleashedinformatics.com) 에서 얻어진 흰쥐 단백질 데이터베이스 로 cytoscape program (ver. 2.4)을 이용 하여 분석하였다.
3. 통계 처리
세포 증식률 실험 결과에 대한 통계적 분석은 통계 패키지인 Sigma plot (Sigma plot for Windows, ver. 9.0, U.S.A.)을 이 용하여 Student's t-test를 시행하였으며 실험 성적은 평균±표준편차(mean±SD) 로 나타내었다. 발현 증가 및 감소된 유 전자 간의 유의성 검증에는 Chi-square test를 사용하여 p value 값이 0.05 미만 일 때 유의한 차이가 있는 것으로 판정 하였다.
Ⅲ. 성 적
1. 자궁경부암 세포의 증식률에 미치는 영향
실험 결과 황금은 1.25 ㎎/㎖ 이상 농 도에서 자궁경부암 세포의 증식률을 유 의하게(p<0.05, p<0.001) 감소시켰다. 또 다른 대조군으로 사용한 강황 (CLR)의 경우, 10 ㎎/㎖에서도 유의한 증식률의 감소가 나타나지 않았다. 대조군의 증식 률을 100%로 하였을 때, 1.25, 2.5, 5.0, 10 ㎎ /㎖ 투여에 의한 증식률은 각각 96.5±1.6%, 90.8±1.8%, 86.4±4.1%, 71.8±3.4%였다(Fig. 1).
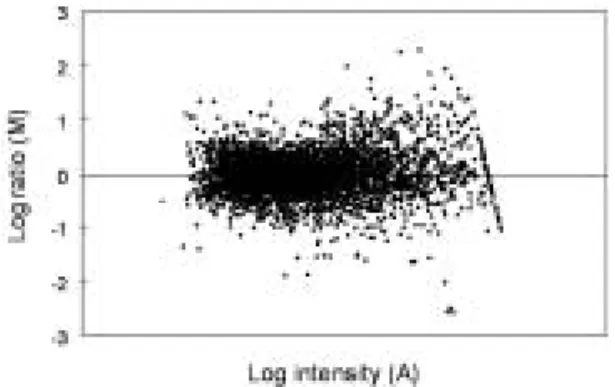
2. DNA 칩에서의 신호강도 (signal intensity) 분포의 표준화
통계학적으로 정규분포를 이루도록 표 준화 과정을 거친 후에 분석하고자 하여
원천 이미지에서 얻어진 1차 데이터를 lowess 기법을 사용하여 표준화하였다.
표준화 한 후 유전자의 분포를 발현 비 율 (log ratio)과 강도 (log intensity)간 의 관계로 나타낸 결과 유전자의 발현 비율이 0을 기점으로 하는 일직선 형태 로 변화되었다(Fig. 2).
Fig. 1. Effects of SR on proliferation of tumor cells in vitro.
SNU-703 cells were attached 96-well plate, and added SR as indicated concentrations respectively. After 24 hours incubation, proliferation rates were measured using altered MTT methods.
CLR used as control. SR : Scutellariae Radix treated group, CLR : Curcumae Longae Rhizoma treated group. Values are expressed as percentage of control. Results are presented as mean±SD.
*P < 0.05, and ***P < 0.001 vs non-treated control (n=6).
Fig. 2. Normalization of microarray (MA plot).
Primary data from raw image were normalized using lowess method. Vertical axis represents log ratio and horizontal axis represents log intensity of all spots after normalization.
3. 발현이 증가된 유전자들에 대한 기능 분석
황금 추출물의 처리에 의해 발현이 증 가된 유전자의 개수는 총 519개였다. 이 유전자들의 분석 결과 생물학적 과정 항 목에서는 biopolymer metabolic process, regulation of cellular process 등과 관련 된 유전자가 많았고, 분자기능항목별 분 석에서는 metal ion binding, cation binding, DNA binding에 관여하는 유전자가 많은 것으로 나타났다. 세포 구성요소 관련 분석에서는 intracellular에 존재하는 물 질 관련한 유전자가 가장 많았고, 그 다 음이 membrane 구성 물질 관련 유전자 였다.
4. 발현이 감소된 유전자들에 대한 기 능 분석
황금 추출물의 처리에 의해 발현이 감 소된 유전자의 개수는 총 606개였다. 이 유 전자들의 분석 결과 생물학적 과정 항목에 서는 cellular metabolic process, primary metabolic process 등과 관련된 유전자가
많았고, 분자기능항목별 분석에서는 metal ion binding, cation binding, DNA binding 에 관여하는 유전자가 많은 것으로 나타 났다. 세포 구성요소 관련 분석에서는 intracellular에 존재하는 물질 관련한 유 전자가 가장 많았고, 그 다음이 membrane 구성 물질 관련 유전자였다.
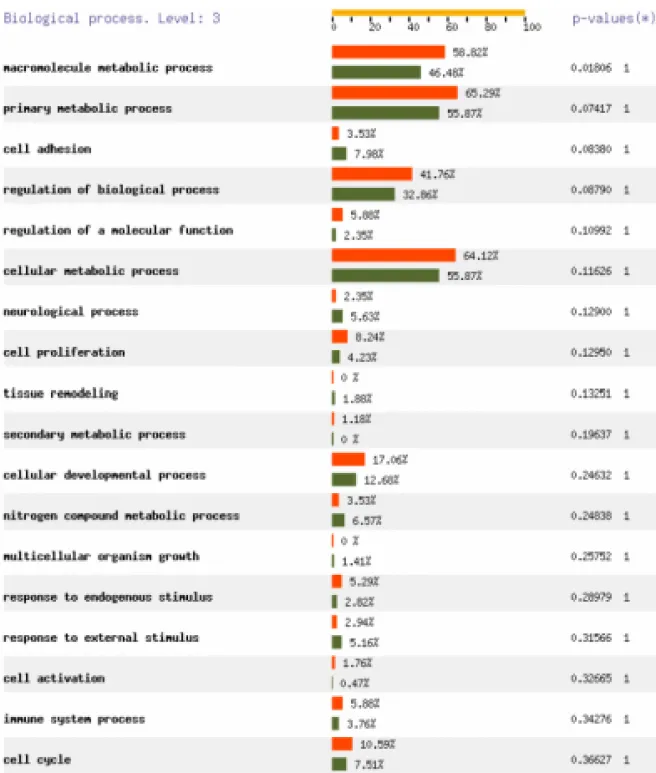
5. 생물학적 과정, 분자기능 및 세포 구성요소 항목에서의 기능 분포 비교
생물학적 과정의 경우 macromolecule
metabolic process에 관련된 유전자가 유
의한(p<0.05) 수준으로 발현 증가했음을
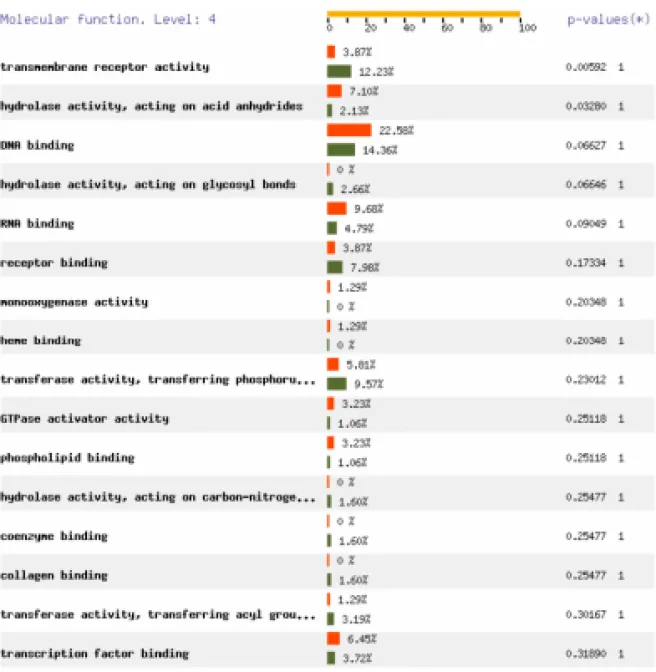
알 수 있었다 (Fig. 3A). 분자기능 분포에
대한 유전자를 상호 비교 분석한 결과
transmembrane receptor activity, hydrolase
activity acting on acid anhydrides와 관
련된 유전자들의 발현이 유의한(p<0.05)
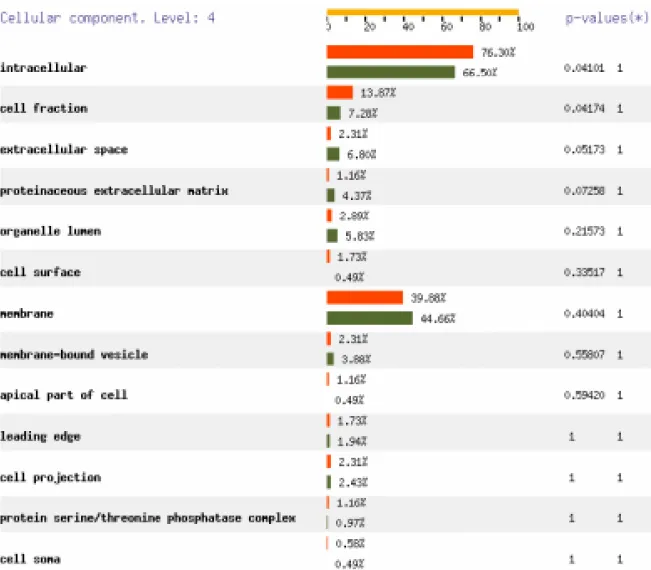
차이를 보였다 (Fig. 3B). 세포성분에서
의 분포도를 살펴보면 intracellular와
cell fraction에 관련된 유전자들의 발현
정도가 유의한(p<0.05) 차이를 보였다
(Fig. 3C).
Fig. 3A. Comparison of functional distribution in Biological Process.
Both up-regulated and down-regulated genes were analyzed in Biological Process category in ontology. The horizontal bar represents the percentage of specific functional category in Biological Process. The list was arrayed in decreasing percentage of functional category. Red and Green color represent percentage of up-regulated and down-regulated genes, respectively, in each functional category. P<0.05 was considered significant.
Fig. 3B. Comparison of functional distribution in Molecular function.
Both up-regulated and down-regulated genes were analyzed in Molecular Function category in ontology. The horizontal bar represents the percentage of specific functional category in Molecular Function. The list was arrayed in decreasing percentage of functional category. Red and Green color represent percentage of up-regulated and down-regulated genes, respectively, in each functional category. P<0.05 was considered significant.
Fig. 3C. Comparison of functional distribution in Cellular component.
Both up-regulated and down-regulated genes were analyzed in Cellular component category in ontology. The horizontal bar represents the percentage of specific functional category in Cellular component. The list was arrayed in decreasing percentage of functional category. Red and Green color represent percentage of up-regulated and down-regulated genes, respectively, in each functional category. P<0.05 was considered significant.
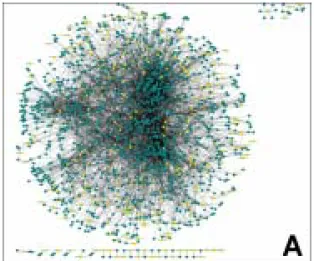
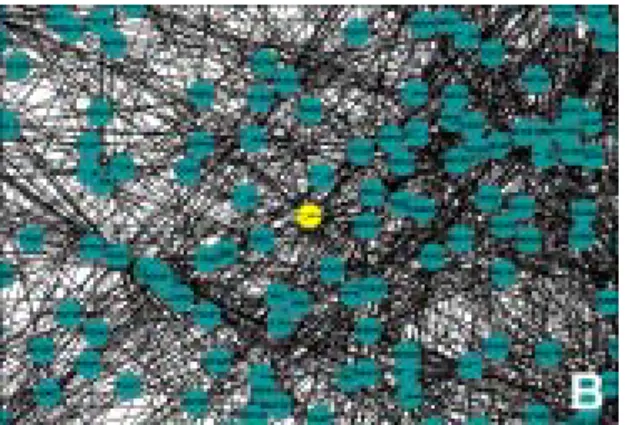
6. 발현이 증가된 유전자들에 의하여 발 현되는 단백질 상호작용 네트워크 분석
황금 추출물 처리에 의해 발현이 증가 된 유전자들에 의하여 발현되는 단백질 들을 인체 시스템 내에 존재하는 단백질 네트워크를 이용하여 분석한 결과 RHOA, RAC1, CTNNB1, CDC42 그리고 TNFRSF1A 등의 단백질이 단백질 상호작용 네트워 크의 중심에 위치함을 알 수 있었다 (Fig. 4).
7. 발현이 감소된 유전자들에 의하여 발현되는 단백질 상호작용 네트워크 분석
황금 추출물 처리에 의해 발현이 감소
된 유전자들에 의하여 발현되는 단백질
들을 인체 시스템 내에 존재하는 단백질
네트워크를 이용하여 분석한 결과 AKT1,
MAPK3, MDFI, ABL1, 그리고 STAT3
등의 단백질이 단백질 상호작용 네트워크
의 중심에 위치함을 알 수 있었다(Fig. 5).
Fig. 4A. Protein interactions between up -regulated genes.
The network of total protein interactions was measured using cytoscape program. The database was obtained in BOND database (http://bond. unleashedinformatics.com). Circles represent proteins that involved in interactions with other proteins. Yellow circles represent the proteins identified in this experiment to be up-regulated by treatment with SR. Lines mean the protein-protein interactions.
Fig. 4B. Protein interactions between up -regulated genes.
The network of total protein interactions was measured using cytoscape program. The database was obtained in BOND database (http://
bond. unleashedinformatics.com). Circles represent proteins that involved in interactions with other proteins. Yellow circles represent the proteins identified in this experiment to be up-regulated by treatment with SR. Lines mean the protein-protein interactions.
Fig. 4C. Protein interactions between up -regulated genes.
The network of total protein interactions was measured using cytoscape program. The database was obtained in BOND database (http://
bond. unleashedinformatics.com). Circles represent proteins that involved in interactions with other proteins. Yellow circles represent the proteins identified in this experiment to be up-regulated by treatment with SR. Lines mean the protein-protein interactions.
Fig. 5A. Protein interactions between down -regulated genes.
The network of total protein interactions was measured using cytoscape program. The database was obtained in BOND database (http://
bond. unleashedinformatics.com). Circles represent proteins that involved in interactions with other proteins. Yellow circles represent the proteins identified in this experiment to be down-regulated by treatment with SR. Lines mean the protein -protein interactions.
Fig. 5B. Protein interactions between down -regulated genes.
The network of total protein interactions was measured using cytoscape program. The database was obtained in BOND database (http://bond.
unleashedinformatics.com). Circles represent proteins that involved in interactions with other proteins.
Yellow circles represent the proteins identified in this experiment to be down-regulated by treatment with SR. Lines mean the protein -protein interactions.
Fig. 5C. Protein interactions between down -regulated genes.
The network of total protein interactions was measured using cytoscape program. The database was obtained in BOND database (http://bond.
unleashedinformatics.com). Circles represent proteins that involved in interactions with other proteins.
Yellow circles represent the proteins identified in this experiment to be down-regulated by treatment with SR. Lines mean the protein -protein interactions.