원예과학기술지 18(1):39-50. 2000
Unique Feature of Horticulture in Asia and Its Global Impact
Jung-Myung Lee
Department of Horticulture, Kyung Hee University, Suwon 449-701, Republic of Korea
ABSTRACT Asia has 60% of the world population and only about 34.5% of the world arable land. However,
Asians traditionally consume very large amount of horticultural produce and depend heavily on vegetables for the sources of horticultural food crop. The vegetable production in Asia is highly intensive and multiple and successive cropping are routinely practiced. Concomitant with the rapid economic growth in many east Asian countries, the demands for high-quality horticultural crop have been drastically increased among many Asians and their interest in high-quality products, outstanding cultivars, machinery and equipment, production technology has been sharply increased in recent years. It is therefore believed that establishing and maintaining closer and regular relations among scientists and societies could provide an excellent momentum for promotion of horticulture on a global basis and both the ISHS and the ASHS could play decisive roles for this kind of promotion.
Additional key words: international association, international trade, Korean horticulture, production and consumption,
seeds and germplasm, society members
※ 이 논문은 국제원예학회 Acta Horticulturae(495:123~141)에 게재된 것을 전제한 것입니다.
1. Introduction
It is rather difficult and often impossible to precisely describe the status of horticulture in Asia, especially under the circum- stance of undergoing such rapid and abrupt changes in economical and political status during status the last decades.
The significance of agriculture has always been emphasized with respect to food crops and this trend is especially serious in many developing countries with high population and very limited and poor arable land. Even though horticultural crops can also be regarded as food crops in many countries and circumstances, horticulture also provides different, interesting, and refreshing aspects in human life and environment. Growing horticultural crops should be distinguished from securing the food crops because many horticultural crops are being evaluated in terms of their quality rather than the quantity as in many major field crops. Janick (1994) describes, “Horticulture can be defined as the branch of agriculture concerned with intensively cultivated plants directly used by people for food, for medicinal purposes, or for esthetic gratification”. It should be pointed out that the term 'horticulture' is being called as 'Gardening Art' (rather than cultivation of garden in Greek) here in the Orient or in East Asia from ancient times.
The major objectives of this paper are
1) to describe present status and characteristics of horticulture in Asia in production and internaional trade,
2) to compare the present status of horticulture of the world in relation to other crops,
3) to find out and analyze problems associated with production and utilization of horticultural crops in Asia,
4) to search for ways to strengthen horticultural activity in Asia in terms of research and international affairs on global basis, and
5) to provide future directions for horticultural industry as well as research for the 21st century.
2. Population in Asia and the world
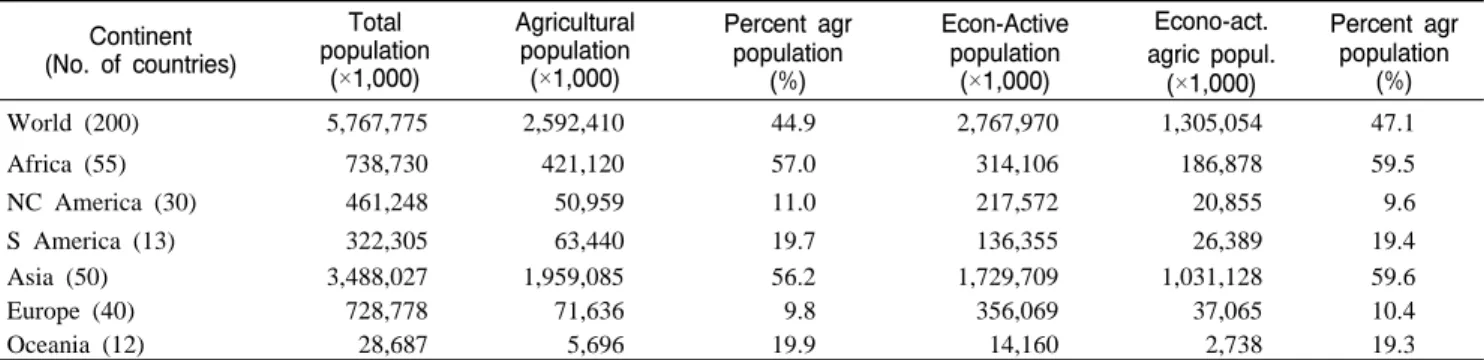
According to FAO statistics (FAO, 1995 and 1996), there are 50 countries in Asia among the 200 countries in the word (Table 1). Total population in Asia in 3.5 billion, which is more than 60% of the total world population of 5.76 billion. Among the population in Asia, 60% of the people are engaged in agriculture so that agriculture is far and away the primary industry in Asia as well as in the whole world.
Table 2 shows detailed data on some Asian countries with large population. In China, 71.1% of the total population of 1.23 billion (21.4% of the world total) is engaged in agriculture. The
Continent (No. of countries)
Total population
(×1,000)
Agricultural population
(×1,000)
Percent agr population
(%)
Econ-Active population
(×1,000)
Econo-act.
agric popul.
(×1,000)
Percent agr population
(%)
World (200) 5,767,775 2,592,410 44.9 2,767,970 1,305,054 47.1
Africa (55) 738,730 421,120 57.0 314,106 186,878 59.5
NC America (30) 461,248 50,959 11.0 217,572 20,855 9.6
S America (13) 322,305 63,440 19.7 136,355 26,389 19.4
Asia (50) 3,488,027 1,959,085 56.2 1,729,709 1,031,128 59.6
Europe (40) 728,778 71,636 9.8 356,069 37,065 10.4
Oceania (12) 28,687 5,696 19.9 14,160 2,738 19.3
Table 1. Population of the world and the percentage of agricultural population.
Country* Total pop. Agric. Pop. Percentage Active Pop. Act. Ag. Po Percent Ag P
China 1,232,083 876,475 71.7% 731,538 520,355 71.1%
India 944,580 540,845 57.3% 409,545 250,556 61.2%
Indonesia 200,453 97,719 48.7% 93,101 49,169 52.8%
Pakistan 139,973 70,484 50.4% 50,176 23,637 47.1%
Japan 125,351 6,270 5.0% 66,443 3,490 5.3%
Bangladesh 120,073 73,095 60.9% 60,522 36,804 60.8%
Vietnam 75,181 51,782 68.9% 37,945 26,136 68.9%
Iran 69,975 24,482 35.0% 21,327 7,665 35.9%
Philippines 69,282 28,570 41.2% 28,763 11,931 41.5%
Turkey 61,797 28,542 46.2% 28,274 14,271 50.5%
Thailand 58,703 32,117 54.7% 34,333 20,154 58.7%
Myanmar 45,922 33,003 71.9% 23,409 16,824 71.9%
Korea, ROK 45,314 5,195 11.5% 22,008 2,823 12.8%
Korea, DP 22,466 7,504 33.4% 11,275 3,762 33.4%
Uzbekistan 23,209 7,706 33.2% 9,526 3,163 33.2%
Iraq 20,607 2,209 10.7% 5,455 586 10.7%
Malaysia 20,581 4,272 20.8% 8,321 1,844 22.2%
*17 countries of population higher than 20 million.
Table 2. Total and agricultural population in Asia (population unit:1,000).
Total area Land Arable Permanent Non-arable %arable land
World 13,383,471 13,048,404 1,361,711 114,667 11,571,926 10.4
Agrica 3,031,169 2,963,568 173,408 19,448 2,070,612 5.9
NC America 2,239,057 2,137,042 269,821 7,432 1,859,789 12.6
S America 1,783,189 1,752,925 99,087 21,426 1,632,412 5.7
Asia 3,174,845 3,085,414 470,062 42,369 2,568,983 15.2
Europe 2,298,773 2,260,320 299,159 17,302 1,943,859 13.2
Oceania 856,438 849,135 50,174 2,690 796,271 5.9
Table 3. Land area distribution in the world (unit: 1,000 ha).
percentages of agricultural population in Bangladesh and Vietnam are over 60% and Thailand, India, and Pakistan have agricultural population of 50% or higher. More than 40% of the entire population is engaged in agriculture in Indonesia, Turkey, and Philippines. In contrast, only a few countries have low agricultural population rate; 5.3% in Japan, 10.7% in Iraq, and 12.8% in Korea (S), thus showing extreme variations in agricultural population in Asia.
3. Total and arable land in Asia and the world
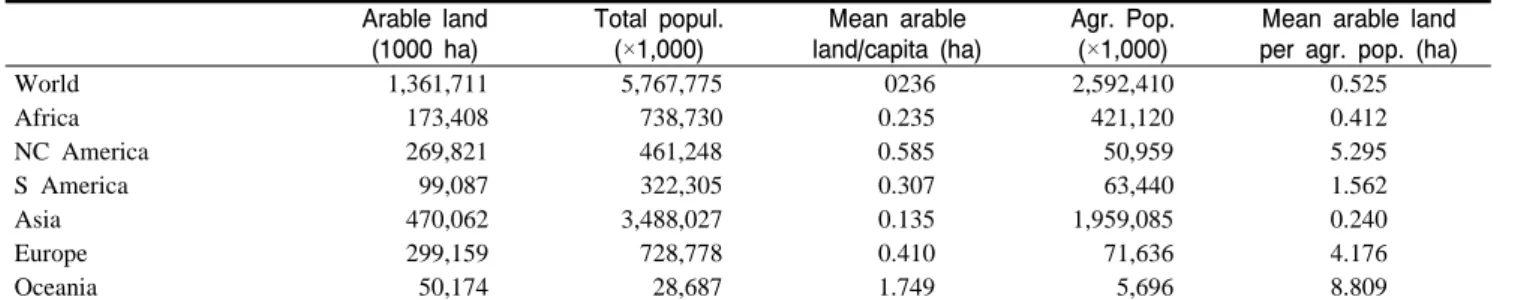
Tables 3 and 4 show the total and arable land areas of the world. Asia has 3.14 billion ha of total land area, which is 23.7% of the world total of 13.38 billion ha. Asia also has 0.47 billion ha of arable land which is 34.5% of the world arable land of 1.36 billion ha. Per capita arable land is Asia is far below the world average of 0.236 ha. North-Central (NC) America and Europe have 0.585 and 0.470 ha, respectively. Arable land area per capita engaged in agriculture is 0.240 ha in Asia which is
Arable land (1000 ha)
Total popul.
(×1,000)
Mean arable land/capita (ha)
Agr. Pop.
(×1,000)
Mean arable land per agr. pop. (ha)
World 1,361,711 5,767,775 0236 2,592,410 0.525
Africa 173,408 738,730 0.235 421,120 0.412
NC America 269,821 461,248 0.585 50,959 5.295
S America 99,087 322,305 0.307 63,440 1.562
Asia 470,062 3,488,027 0.135 1,959,085 0.240
Europe 299,159 728,778 0.410 71,636 4.176
Oceania 50,174 28,687 1.749 5,696 8.809
Table 4. Per capita land area in Asia and in the world.
Crop World Africa NC Amer S. Amer Asia %Asia Europe Oceania
Cereals 710,457 97,774 99,990 36,830 328,232 46.2 131,057 16,574
Wheat 231,056 11,309 39,104 9,571 101,304 43.8 57,904 11,053
Rice 150,758 7,260 1,695 1,133 135,124 89.6 651 147
Coarse grain 329,543 79,205 59,281 21,377 91,804 27.9 72,502 5,374
Barley 66,551 6,389 7,951 764 15,770 23.7 32.340 3,336
Maize 140,106 25,751 40,614 18,714 41,841 29.9 13.105 81
Rye 17,262 895 2,826 493 1,047 6.1 11.083 918
Oats 11,280 61 315 58 767 6.8 10.046 33
Millets 36,529 19,067 120 43 16,414 44.9 842 44
Sorghum 47,155 24,212 6,808 1,160 14,141 30.0 182 653
Subtotal 1,740,697 271,923 258,704 90,143 746,444 42.9 329,712 38,213
Roots & tubers 49,032 16,864 1,301 3,705 17,227 35.1 9,661 274
Potatoes 18,353 688 796 819 6,183 33.7 9,655 49
Sweet potato 9,156 1,532 171 109 7,226 78.9 5 113
Cassava 16,322 10,078 201 2,481 3,544 21.7 17
Yams 3,173 3,033 61 44 17 0.5 18
Pulses 71,034 14,200 5,021 6,085 38,454 54.1 5,267 2,006
Dry beans 27,470 3,147 3,620 5,688 14,281 52.0 685 49
Dry Br. beans 2,355 669 80 177 1,152 48.9 182 90
Dry peas 6,515 506 715 116 1,575 24.2 3,279 324
Soybeans 62,588 949 26,690 18,100 15,774 25.2 1.042 32
Sub-total 265,998 51,666 38,656 37,324 105,433 39.6 29,776 2,972
Vegetables 565,523 35,478 45,646 16,623 376,119 66.5 88,727 2.930
Fruits 413,932 54,394 53,844 66,728 161,182 38.9 72,818 4,966
Nuts 4,996 446 890 797 2,333 46.7 1,022 36
Table 5. Crop production area in the world in 1996 (unit: ha).
far below the world average of 0.525 ha, 5.29 ha in NC America, and 4.176 ha in Europe. These data provide the evidence that struggles and perhaps wars for securing food sourecs would be inevitable for the very existence and maintenance of human life in many parts of Asia. It should also be pointed out that there are great variations in the standards of living depending upon the countries in Asia and the same is true for the rest of the world. There has been a fantastic economic growth in some Asian countries for the last several decades.
However, the unbalanced economic towers in some of those countries have been thoroughly shaken up recently and they had to shed all the showy leaves and flowers. Whether they are ready or not, they should now undergo a long, cold winter with naked branches waiting for the spring. However, it is generally
accepted that the financial ruin or collapse in some East Asian countries also influences the economy of developed countries such as Japan, Singapore, Taiwan, and perhaps China, and may eventually influence the world economy stablilty too.
4. Cultivation area of agricultural crops
Cultivation area of agricultural crops is shown in Table 5.
Asian people grow and consume rise for the major food crop and thus about 90% of the world rice is produced in Asia.
Percent cultivation area of rye and oats is much lower than the world average (6.1 and 6.8% of the world total). Sweet potato is also important crop in Asia. Among the horticultural crops, it is worthwhile to note that vegetables are quite popular among
Country
Per capita production (kg/year/person)
Ratio of vegetables/
fruits Vegetable Fruit Total
China 102.6 19.9 122.5 5.16
Japan 121.1 42.6 163.7 2.85
Korea (N) 201.1 60.0 261.1 3.35
Korea (S) 236.4 43.9 280.3 5.38
Taiwan 162.3 84.3 246.6 1.93
USSR 107.8 50.4 158.2 2.14
USA 128 98 226.0 1.31
Malaysia 17.6 60.5 78.1 0.29
Philippines 66.5 107.1 173.6 0.62
Thailand 44.6 101.8 146.4 0.44
Table 6. Per capita production* of horticultural crops (Lee et al., 1994)
Asian people. The percent share of Asia in world vegetable cultivation area is 66.5%, which may be regarded as extremely high as compared to the world average or to those of other continents. The cultivation area of vegetables in Asia is 2.33 times larger than that of fruits. However, in most other countries, the cultivartion area of fruits are considerably larger than vegetables (Lee et al., 1994). This indicates that vegetables are the major and most important horticultural crops in Asia not only in cultivation areas but also in other aspects such as life style, environment, economy, industry, research and education as described later in detail.
Table 6 shows that per capita production (or consumption) of horticultural crops in some Northeast Asian countries (Lee et al., 1994). It can be easily seen that vegetables are the major horticultural crops in Northeast Asian countries especially in China, Japan, Korea (North), Korea (South), and Taiwan. The ratios of vegetables to fruits are very high in these countries from 1.93 in Taiwan to 5.38 in Korea (S). This preference of vegetables among the Asian people has resulted in similar consequences in general horticultural areas; a large number of industries involved with vegetable seeds and seedlings produc- tion, fertilizer and agrochemical production and distribution companies, storage and processing industries, and others. In addition, it is quite natural to find a lager number of research scientists working on vegetables in universities and colleges, governmental and private research institutes, and consequently a large number of research papers being presented at annual meetings of horticultural society and other related academic societies in many Asian countries. Research fund and budget also show similar trends, in general.
Fermented and partially preserved vegetables are quite popular in Northeast Asian countries such as Japan, China, and Korea.
For an example, the history of pickles in Japan is dated back to the pre-historic times, approximately 4,500 years ago. Many vegetables such as radish, Chinese cabbage, cucumber, and
eggplant are pickled in many homes in Japan and other countries, but fairly a large amount of pickled vegetables are being traded between China, Thailand, Taiwan, and other nearby Asian countries (Inden et al., 1997).
Kimchi is a traditional fermented vegetable mix originated in Korea but now is being traded all over the world. Kimchi has its unique palatability giving sour, sweet, and carbonated taste.
Approximately 300,000 ton of commercial kimchi products was produced by 337 processing factories in Korea in 1996 (Park, 1997) and export of kimchi has been increased drastically since last year. Hot pepper and garlic are vital ingredients for many kinds of kimchi. There are at least 187 different types of kimchi with distinctive recipes (Koo et al., 1991). These unique types of processed vegetables can now be found at any parts of the world from Australia to Canada (Nguyan et al., 1997, W ang, 1997) manufactured in commercial scale.
5. Production of individual horticultural crops
Data on individual horticultural crop is shown in Table 7.
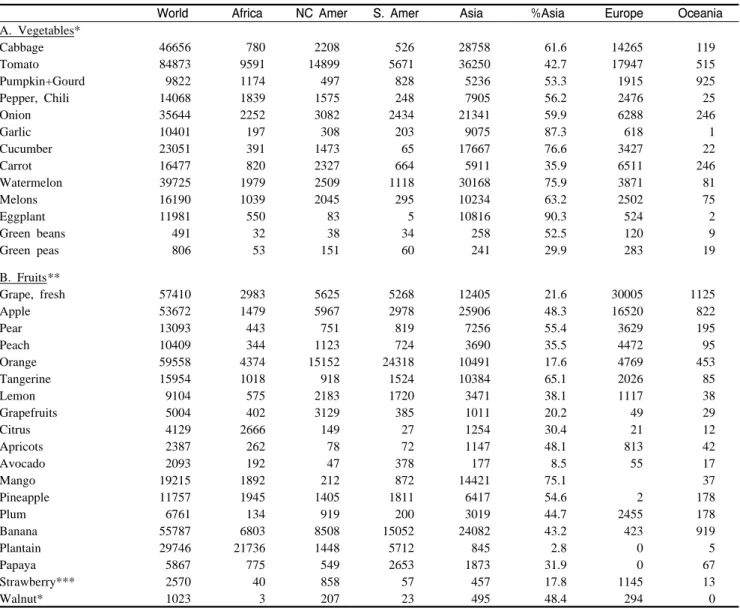
Tomato, watermelon, cabbages, onion, and cucumber are 5 major vegetables in Asia and this conincides with the order in world total. Among the vegetables, garlic and eggplants are cultured mainly in Asia (87. 3% and 90.3%), but carrot and green pea are not receiving much attention in Asia, as compared to other continents. Fruit data is expressed in prduction (1,000 ton) rather than cultivation area. Banana, including plantain, is by far the most abundant fruit in the world followed by oranges, grape, and apple. However, in Asia, apple is the first one followed by banana, mango, grape, and orange. There has been a tremendous increase in apple planted acreage in China and this will undoubtedly influence the apple industry in the East Asia and in the world in the near future. (FAO, 1997, Internet Search, fao.org/detault.htm). Except for mango, the percentage is rather low in many fruits. The vegetable cultivation in Asia is indeed very advanced and characterized by the followings.
1) Various different cultivation types and techniques including numerous cultivars for each type.
2) Highly intensive cropping and frequent successive cropping in the suburban areas.
3) W ell-advanced seedling growing techniques including graft- ing different types of herbaceous materials on commercial scale.
4) Considerable portions of the produces are being processed or preserved in various types.
Vegetable and fruit production acreage in some Asian
World Africa NC Amer S. Amer Asia %Asia Europe Oceania A. Vegetables*
Cabbage 46656 780 2208 526 28758 61.6 14265 119
Tomato 84873 9591 14899 5671 36250 42.7 17947 515
Pumpkin+Gourd 9822 1174 497 828 5236 53.3 1915 925
Pepper, Chili 14068 1839 1575 248 7905 56.2 2476 25
Onion 35644 2252 3082 2434 21341 59.9 6288 246
Garlic 10401 197 308 203 9075 87.3 618 1
Cucumber 23051 391 1473 65 17667 76.6 3427 22
Carrot 16477 820 2327 664 5911 35.9 6511 246
Watermelon 39725 1979 2509 1118 30168 75.9 3871 81
Melons 16190 1039 2045 295 10234 63.2 2502 75
Eggplant 11981 550 83 5 10816 90.3 524 2
Green beans 491 32 38 34 258 52.5 120 9
Green peas 806 53 151 60 241 29.9 283 19
B. Fruits**
Grape, fresh 57410 2983 5625 5268 12405 21.6 30005 1125
Apple 53672 1479 5967 2978 25906 48.3 16520 822
Pear 13093 443 751 819 7256 55.4 3629 195
Peach 10409 344 1123 724 3690 35.5 4472 95
Orange 59558 4374 15152 24318 10491 17.6 4769 453
Tangerine 15954 1018 918 1524 10384 65.1 2026 85
Lemon 9104 575 2183 1720 3471 38.1 1117 38
Grapefruits 5004 402 3129 385 1011 20.2 49 29
Citrus 4129 2666 149 27 1254 30.4 21 12
Apricots 2387 262 78 72 1147 48.1 813 42
Avocado 2093 192 47 378 177 8.5 55 17
Mango 19215 1892 212 872 14421 75.1 37
Pineapple 11757 1945 1405 1811 6417 54.6 2 178
Plum 6761 134 919 200 3019 44.7 2455 178
Banana 55787 6803 8508 15052 24082 43.2 423 919
Plantain 29746 21736 1448 5712 845 2.8 0 5
Papaya 5867 775 549 2653 1873 31.9 0 67
Strawberry*** 2570 40 858 57 457 17.8 1145 13
Walnut* 1023 3 207 23 495 48.4 294 0
*Vegetable harvest area (1,000 ha) and fruit (production, 1,000 ton), respectively.
***Other berries and nuts include raspberry (743), current (687), pistachio (610), hazelnut (590), cashew nut (721), chestnut (505), and others
Table 7. Horticultural crop production in the world in 1996.
countries are further shown in Tables 8 and 9. China and India are the leading countries for vegetable production acreage followed by Turkey and Indonesia. However, fruit production acreage is highest in China followed by Turkey, Iran, and Indonesia. As far as production acreage is concerned, Asia has 66% of the world total vegetable production acreage as compared to only 44% of the world fruits production acreage.
China has about 50% of the total Asian vegetable production acreage and 43.9% of the total Asian fruit production acreage, thus indicating that the Asian trade of horticultural products can be significantly influenced by only a few countries in Asia or by China alone! During the last 10 years, the protected cultivation areage is China has been increased 17 times and the per capita consumption of vegetables also was almost doubled from 119.8
kg/year/person to 217.2kg/year/person (Zhang 1997). Average yield of vegetables per unit area was also more than doubled during the last 10 years. Introduction of promising, new hybrid cultivars may be reponsible for this remarkable increases in yield per unit area. On the contrary, however, the use of hybrid seeds for vegetable production is extremely low in India (Table 10), thus needing urgent attention and introduction of good hybrid cultivars (Agrawal, 1997).
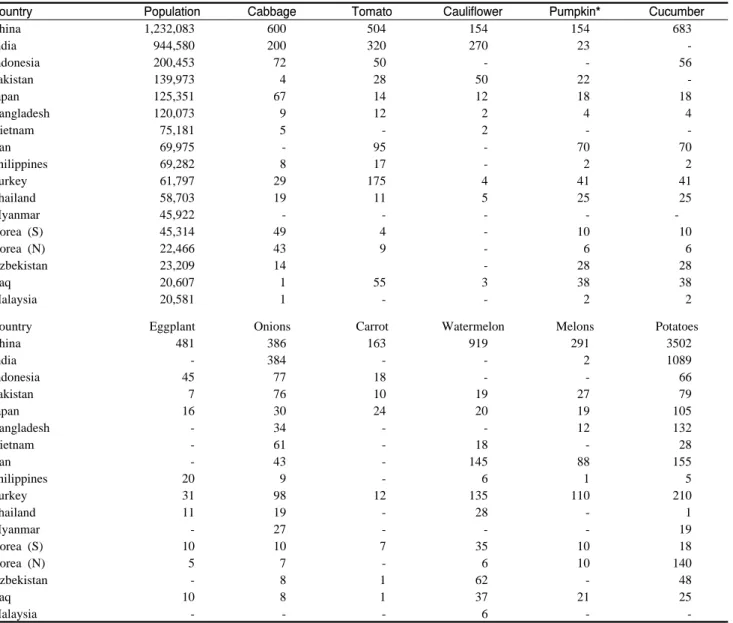
Individual vegetable production statistics are further shown in Table 9. Potatoes are the major vegetable crop in many Asian countries, not as vegetables in many circumstances but as an important food crop. Cauliflower, carrot, and eggplant are being cultivated only in some countries whereas cabbage, tomato, pumpkin, cucumber, onion and watermelon are being cultivated
Country Vegetables and Melons Fruits
1996 1997 Mean 1996 1997 Mean
China 11,799,460 12,109,460 11,954,460 8,859,933 9,413,353 9,136,643
India 4,880,400 4,880,400 4,880,400 3,267,075 3,267,075 3,267,075
Turkey 878,903 878,903 878,903 1,025,285 1,025,158 1,025,221
Indonesia 843,521 843,521 843,521 940,000 940,000 940,000
Philippines 595,070 595,076 595,073 864,395 859,895 862,145
Iran 535,000 535,000 535,000 1,010,445 1,010,445 1,010,445
Japan 500,600 500,600 500,600 273,710 273,710 273,710
Korea (S) 447,757 452,657 450,207 171,440 171,440 171,440
Vietnam 376,400 376,400 376,400 331,237 331,237 331,237
Thailand 325,758 325,758 325,758 632,889 632,889 632,889
Pakistan 320,671 323,600 322,065 583,494 582,070 582,782
Korea (N) 307,400 307,400 307,400 158,600 158,600 158,600
Sub-total 21,810,940 22,128,635 21,969,788 18,118,503 18,665,872 18,392,188
Asia total 24,063,100 24,392,070 24,227,585 20,518,880 21,112,900 20,815,890
World total 36,438,660 36,757,520 36,598,090 46,556,560 47,157,550 46,857,055
Table 8. Horticultural crop production in Asian countries.
Country Population Cabbage Tomato Cauliflower Pumpkin* Cucumber
China 1,232,083 600 504 154 154 683
India 944,580 200 320 270 23 -
Indonesia 200,453 72 50 - - 56
Pakistan 139,973 4 28 50 22 -
Japan 125,351 67 14 12 18 18
Bangladesh 120,073 9 12 2 4 4
Vietnam 75,181 5 - 2 - -
Iran 69,975 - 95 - 70 70
Philippines 69,282 8 17 - 2 2
Turkey 61,797 29 175 4 41 41
Thailand 58,703 19 11 5 25 25
Myanmar 45,922 - - - - -
Korea (S) 45,314 49 4 - 10 10
Korea (N) 22,466 43 9 - 6 6
Uzbekistan 23,209 14 - 28 28
Iraq 20,607 1 55 3 38 38
Malaysia 20,581 1 - - 2 2
Country Eggplant Onions Carrot Watermelon Melons Potatoes
China 481 386 163 919 291 3502
India - 384 - - 2 1089
Indonesia 45 77 18 - - 66
Pakistan 7 76 10 19 27 79
Japan 16 30 24 20 19 105
Bangladesh - 34 - - 12 132
Vietnam - 61 - 18 - 28
Iran - 43 - 145 88 155
Philippines 20 9 - 6 1 5
Turkey 31 98 12 135 110 210
Thailand 11 19 - 28 - 1
Myanmar - 27 - - - 19
Korea (S) 10 10 7 35 10 18
Korea (N) 5 7 - 6 10 140
Uzbekistan - 8 1 62 - 48
Iraq 10 8 1 37 21 25
Malaysia - - - 6 - -
*Pumpkins also include squashes and edible gourds.
Table 9. Vegetable cultivation area in 1996 (unit: 1,000 ha).
Crop Total area (Ha) % area under hybrid prod.
FAO TVIS
Brinjal NL 474,352 13.9
Cabbage 299,000 239,743 22.9
Cauliflower 270,000 446,644 1.7
Chillies+Peppers (green) 5,000 567,851 0.9
Cucumber NL 250,000 3
Gourds 315,000 405,218 2
Melons 2,000 166,030 2.6
Okra NL 367,986 5.2
Tomato 320,000 480,713 28.3
Onion 384,000 NL -
Garlic 86,000 NL -
Pimento (all spice) 1,000,000 NL - Pepper
(White/Long/Black) 200,000 NL -
Source: Revised from Seed Association of India.
*Include bottle gourd, ridge gourd, bitter gourd, and sponge gourd (FAO includes pumpkin and squash).
**Includes watermelon and muskmelon.
NL: Not listed.
Table 10. Vegetable cultivation area and percentage of area under hybrid seed production in India (data: 1997 Chronica Horticulture).
Country Chillies* Paprika** Pepper*** Pepper total
China 352,430 30,000 11,000 393,430
India 5,000 1,000,000 200,000 1,205,000
Indonesia 200,000 420 72,600 273,020
Pakistain - 95,000 - 95,000
Japan 4,800 - - 4,800
Bangladesh - 66,000 - 66,000
Vietnam - - 7,400 7,400
Iran - 1,450 - 1,450
Philippines 1,000 - - 1,000
Turkey 58,000 6,500 - 64.500
Thailand 950 18,000 3,500 22,450
Myanmar - 74,000 - 75,000
Korea (S) 105,000 - - 105,000
Korea (N) 2,000 - - 2,000
Uzbekistan - - - -
Iraq 3 - - 3
Bhutan 2,500 1,600 - 4,100
Cambodia - 9,500 - 9,500
Israel 1,900 100 - 2,200
Laos - 2,200 - 2,200
Syria 2,900 - - 2,900
Nepal - 15,500 - 15,500
Sri Lanka 2,900 - 2,900
Malaysia 10 10
*Chillies also include green peppers.
**Data obtained by direct internet search (not in FAO Year- book). Pimento all belonging to spices.
***Peppers of white, long, and black. Other pepper producing countries are Ghana (5,200), Nigeria (95,000), Mexico (90,000), and USA (20,000 ha), respectively.
Table 11. Major pepper producing acreage in the world in 1997 (Data: FAO Internet search, fao.org/default.htm)
in most Asian countries. Data base used in this report was mostly obtained from FAO Yearbook or internet FAO (fao.org/
default.htm). However, even these data were not quite accurate and sometimes classified in different ways so that ture data could not be easily accessible. Table 11 gives the production statistics on peppers. Dried hot peppers are one of the important vegetable crops (or spice) and frequent international trades have been taken during the last 10 year. The data shows that the pepper producing area in India is more than 1.2 million ha.
However, the FAO classification is very confusing and expres- sed inproperly so that more reliable as well as more accurate data should be compiled and available for precise evaluation and comparison of production statistics on a global basis. The data shown in Tables 10 and 11 indicate again that more precise data is needed for possible accurate analysis of present production status and to set up goals for future guide for production and internaitonal trade.
6. Public or internainal organization
The significance and preferences of vegetables among Asian people can be easily proven by the earlier establishment and maintenance of the Asian Vegetable Research and Development Center (AVRDC), an internaional reaearch center financed by USA, ADB, Taiwan, and other Asian countries. AVRDC is the international research and training organization established in 1970, responsible for improving production and quality of selected vegetables and legume crops in the hot, humid low and tropics. AVRDC had the following initial objectives (Malowe, 1989) and the activities are considered to be very fruitful, especially in southeast Asian countries.
1) Conduct research on production and marketing programs to assist participating countries in developing their own adaptive research programs.
2) Carry out training in production and marketing programs and to assist participating countries in developing more efficient training and marketing programs.
3) Develop and privide basic information on improved produc- tion and marketing for use in extension services in partici- pating countries.
7. International trade of horticultural products
World trade of some major crops in shown in Tables 12 and 13. Due to the high population and limited arable land area, many Asians are experiencing food scarce and thus depend highly on imported foods from other continents or countries. As
Crop Import Percentage Export Percentage Imp/Exp ratio
Cereals 4,690,910 50.6% 41,941,600 50.7% 1.12
Wheat & Flour 21,860,520 23.6% 19,360,330 23.4% 1.13
Maize 12,467,940 13.4% 10,872,520 13.1% 1.15
Rice 7,600,646 8.2% 7,191,984 8.7% 1.06
Barley 3,163,255 3.4% 2,724,033 3.3% 1.16
Rye 385,074 0.4% 331,079 0.4% 1.16
Oats 321,686 0.3% 301,784 0.4% 1.07
Sub-total 92,708,281 82,723,330
Table 12. World trade of food crops in 1995 (unit: 1,000 US $).
World Africa NC. America S. America Asia Europe Oceania
EXPORT
Potatoes 2,309,881 157,753 194,943 83,172 202,253 1,707,715 13,409
Tomato 2,296,865 75,664 727,313 123,196 157,947 1,820,839 7,047
Onions 1,205,930 28,200 288,677 88,692 270,487 444,468 85,406
Banana 4,595,696 468,288 4,675,778 1,228,810 298,954 1,223,236 1,384
Grape 1,928,043 111,918 409,682 366,561 126,923 888,411 24,548
Grape (raisin) 752,212 6,261 59,706 28,111 133,507 506,315 18,313
Apple 3,008,217 109,737 454,639 341,481 200,195 1,575,052 327,113
Ora+Tanger. 3,686,334 407,056 379,818 128,530 380,487 2,320,896 69,547
Lemon 740,311 18,326 174,114 130,603 88,482 376,707 4,152
Peach 893,701 8,471 69,575 64,063 8,732 739,256 3,604
Pineapple 300,205 55,336 85,674 6,120 31,260 120,628 187
Pineap. (can) 562,986 79,649 8,865 781 416,336 53,823 3,532
IMPORT
Potatoes 2,584,211 192,638 179,967 42,394 231,247 1,929,846 8,119
Tomato 2,709,768 5,112 628.282 501,868 149,292 1,914,390 7,047
Onions 1,303,294 24,802 207,909 72,809 405,067 584,860 7,847
Banana 6,951,210 51,329 158,566 114,245 817,773 4,353,545 27,603
Grape 2,252,059 9,975 625,576 51,498 288,381 1,260,773 15,856
Grape (raisin) 742,214 6,261 59,706 28,111 133,507 506,315 18,313
Apple 3,255,616 55,281 282,811 223,874 593,228 2,093,844 6,578
Ora+Tanger. 3,967,420 9,259 215,289 11,037 766,839 2,944,719 20,277
Lemon 841,649 916 64,013 40,656 199,483 574,555 2,271
Peach 920,436 1,521 106,137 25,250 26,375 759,763 1,390
Pineapple 445,716 1,102 59,702 4,900 70,044 307,350 2,618
Pineap. (can) 647,566 1,835 208,045 19,690 129,044 276,413 12,539
RATIO OF EXPORT/IMPORT
Potatoes 0.89 0.82 1.08 1.96 0.87 0.88 1.65
Tomato 0.85 14.80 1.16 0.25 1.06 0.95 1.00
Onions 0.93 1.14 1.39 1.22 0.67 0.76 10.88
Banana 0.66 9.12 29.49 10.76 0.37 0.28 0.05
Grape 0.86 11.22 0.65 7.12 0.44 0.70 1.55
Grape (raisin) 1.01 1.00 1.00 1.00 1.00 1.00 1.00
Apple 0.92 1.99 1.61 1.53 0.34 0.75 49.73
Ora+Tanger. 0.93 43.96 1.76 11.65 0.50 0.79 3.43
Lemon 0.88 20.01 2.72 3.21 0.44 0.66 1.83
Peach 0.97 5.57 0.66 2.54 0.33 0.97 2.59
Pineapple 0.67 50.21 1.44 1.25 0.45 0.39 0.07
Pineap. (can) 0.87 43.41 0.04 0.04 3.23 0.19 0.28
Table 13. World trade of field & horticultural crops in 1995 (unit: 1,000 US $).
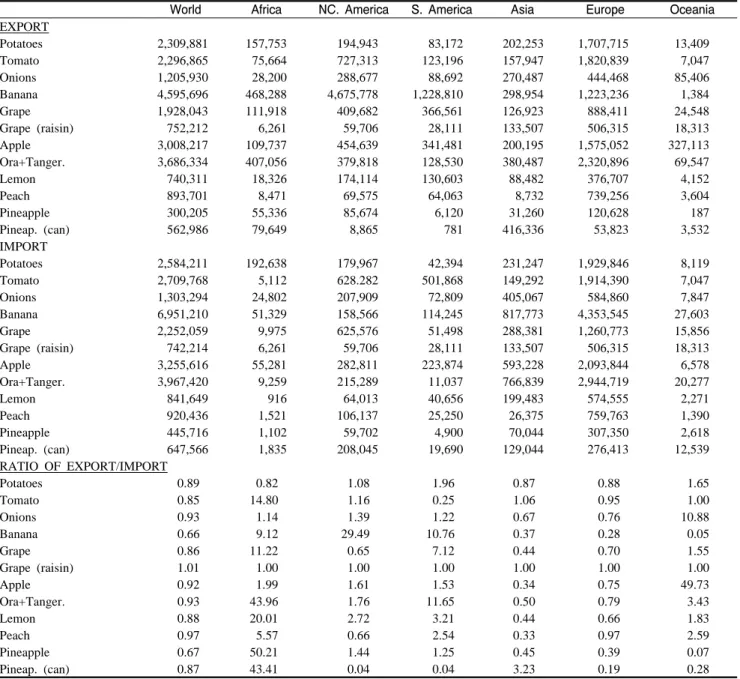
shown in Table 12, grains account for more than 50% of the world trade followed by wheat and flour (23%), maize (8-9%), and rice (3%). Among the horticultural crops (Table 13), banana, sometimes including plantains, is ranking number one in total
amount of international export followed by oranges (including tangerines and mandarins), apple potatoes and tomato. Pineapple (canned) is the only item which is mainly exported from Asia and most other horticultural crops are mostly exported from
Country IMPORT EXPORT Differences (Exp-Imp)
1993 1994 1995 Total 1993 1994 1995 Total
Bahrain 70313 70380 69693 210386 322 322 352 996 -209,390
Bangladesh 48482 49005 37439 134926 2842 2842 2842 8526 -126,400
China 4825 5608 6581 17014 26351 33209 37273 96833 79,819
Cypnis 17406 25420 30300 73126 98866 111688 170862 381416 308,290
Hong Kong 141141 152262 161387 454790 56161 58942 61545 176648 -278,142
India 41567 52268 29893 123728 54766 65212 62534 182512 58,784
Indonesia 13193 19771 24021 56985 29633 30386 29953 89972 32,987
Israel 148476 175222 180171 503869 525009 532266 586725 1644000 1,140,131
Japan 48671 57828 62943 169442 1110 1152 1132 3394 -166,048
Jordan 63206 61069 78957 203232 101095 96202 99847 297144 93,912
Korea (South) 34548 43708 46363 124619 22231 27884 33359 83474 -41,145
Kuwait 22150 24297 25642 72089 532 625 732 1889 -70,200
Macao 24804 25946 25199 75949 2388 2695 2086 7169 -68,780
Malaysia 33185 37444 45110 115739 20869 19734 19129 59732 -56,007
Myanmar 0 0 10 10 123566 128130 222230 473926 473,916
Oman 126309 118310 102418 347037 14953 15433 15605 45991 -301,046
Pakistan 122247 94390 136121 352758 59617 59364 57306 176287 -176,471
Philippines 73779 117150 121849 312778 600302 571624 581213 1753139 1,440,361
Qatar 62119 61515 69614 193248 719 322 256 1297 -191,951
Saudi Arabia 5611 5458 5606 16675 892 686 650 2228 -14,447
Singapore 79819 81379 87172 248370 28981 36773 39962 105716 -142,654
Syria 31604 21063 103434 156101 292986 338295 315164 946445 790,344
Thailand 13910 17811 19408 51129 160866 149157 149175 459198 408,069
Turkey 10107 4771 8750 23628 166963 200332 217919 585214 561,586
UAE 41714 61110 60618 163442 13032 14747 13313 41092 -122,350
Vietnam 5135 8050 11500 24685 59456 73871 73186 206513 181,828
USA 65469 69944 75484 210897 63743 71043 75017 209803 -1,094
Mexico 41100 46147 32501 119748 184961 205723 263888 654572 534,824
Canada 267324 259517 216198 743039 68444 82765 103736 254945 -488,094
Costa Rica 14996 30529 37412 82937 509675 754128 899726 2163529 2,080,592
Columbia 73926 129878 171949 375753 481786 543348 497010 1522144 1,146,391
Ecuador 9436 19074 28737 57247 588224 734514 804980 2127718 2,070,471
Chile 56375 59433 78441 194249 104213 117070 137483 3587672 3,393,423
4 7 1
France 49130 54786 63073 166989 29332 31797 36191 97320 -69,669
Italy 20596 24431 25964 70991 37484 42223 44741 124448 53,457
Russia 98706 205512 176671 480889 4587 4465 6245 15297 -465,592
New Zealand 144824 159877 181289 485990 591806 653913 825785 2071504 1,585,514
Table 14. International trade of fruits and vegetables in Asian countries and some other countries in the world in 1993-1995 (unit:
1,000 US $).
other continents. Asia does not import a large amount of horticultural crops, either. Major importer of horticultural crops is Europe, accounting for 50-80% of the total import for most horticultural crops. Potatoes and tomatoes are the major vegeta- bles being traded worldwide.
Total amounts of export and import in Asian countries and some other countries are shown in Table 14. International trade of fruits and vegetables in Asian countries and some other countries of the world can be obtained from FAO Homepage (fao.org/default.htm). Based on the total amount of export excess value, major exporting countries in Asia are Philippines, Israel, Syria, Turkey, and M yanmer, in that order. On the world-wide
basis, however, Chile upsurged recently as the largest exporting country followed by Costa Rica, Ecuador and New Zealand, in that order. The largest importing countries in the world are Canada and Russia, which are located in cold northern hemi- sphere. The largest importing countries in Asia are Israel, Hong Kong (now in China), Pakistan, Oman, and Philippines, in that order. However, the trade difference (export-import) is largest in Oman, followed by Hong Kong, Bahrain, Qator, and Pakistan.
It is interesting to note that many of these importing countries are developing countries rather than developed ones, thus indicating that accumulation of high production technology rather than man-power is vital for producing and exporting high
quality horticultural products.
Some Asian countries with large population, for example China, India, Indonesia, and Japan (71.7% of total Asian popula- tion in these 4 countries) do export and import horticultural products. However, the total amount and the differences between export import are surprisingly low, thus meaning that production system for self-supply is well stabilized in these countries. Even though vegetables are very much favored by many Asian people, most of these horticultural products are being traded mostly among nearby countries with the exception of some fruits and ornamental plants. For example, Korea (S) imported a large amount of fresh and processed vegetables from China (Lee, 1994) and the amounts have been increasing steadily (FAO, 1996, 1998: Lee et al., 1994). On the countray, Korea (S) exports considerable amount of fresh and processed vegetables such as pine mushroom, kimchi, dried mushroom, onion, and cucumber exclusively to Japan (FAO, 1998 Internet). Kimchi, which symbolizes the Korean traditional eating preferences because of its unique delicate flavor and taste, is exported to all over the world, somtimes even under wrong name of “kimuchi” and now officially regarded as the well-known delicacies of the world and in every Olympic Games! In spite of the large amount of horticultural products, the amount of international trade has never been impressive until recently. The bulk of horticultural crops compared to cereals or grains may be partially responsible for this. The maintenance of freshness in fresh vegetables and fruits would be possible only for short-distance transport. The dissimilarity in crops is another reason for this trend of interna- tional trade.
Furthermore, following regions or so called free trade agree- ments (or areas) all over the world tended to aggravate the local tradee tendency in some way or another.
These are ASEAN (Association of South East Asian Nations, 9 countries), NAFTA (North American Free Trade Agreement, 3 countries), CERTA (Close Economic Relation Tread Agree- ment, 2 countries), EU(European Union, 15 countries), LAIA (Latin American Integration Association, 9 countries), and many more agreements or areas such as Asian Pacific Region (APEC), East African Community, etc. The role and significance of ASEAN and AFTA (ASEAN Free Trade Area) have been drastically increasing until recently. However, financial crisis or ruin in some Asian countries such as Indonesia, Thailand, and Korea will greatly in fluence the ASEAN activities at least for 5-10 years. The role of OECD and APEC will be emphasized with relation to economies in Asian countries especially with the launching of W TO (World Trade Organization).
8. Professional workers engaged in Horticul- tural research and their activity
Horticultural activities such as research, education, production and industries are depending critically upon the number of horticulturists and specialists. In a given country, the number of registered members in any internaional horticultural society could be a good indication for the measure of golbal horticul- tural activities. M ore detailed information on paid-up member- ship can be obtained from both ISHS and ASHS. A more detailed study on researchers active in the field of horticultur will be available from ISHS within the coming years, under the new publication HRI (Horticulturla Research Internaional) direc- tory.
9. Expanding horticultural research and indus- try in Korea (case study)
The Republic of Korea is probably one of the very few countries in the world with huge annual increases in govern- mental as well as Research foundation fund for horticultural research. The importance of horticultural products has been recognized in various different ways. For example, the percent share of the total amount of horticultural produce in all agri- cultural produces (including livestock and forest products) in 1995 was increased up to 24.4% for vegetables and 11.3% for fruit. These values clearly indicate the importance of horticulture and horticultural industry. Similar trends have been maintained for last 5 years. The activity of the Korean Society for Horti- cultural Science (KSHS) members can be clearly confirmed by the number of registered KSHS members (+1,500), number of registered ASHS members and ISHS members, number of papers presented at the annual meeting of the KSHS (Table 15 and 16), and the occupation of authors delivering the papers at the meeting (Table 17). At the spring and fall meetins, several well-known scientists or horticulturists have been officially invited from other countries for special lectures. The KSHS also held several ISHS international symposia for the last few years and plans to host several more symposia in the next few years;
on pepper, postharvest, and use of bioregulators in fruits, etc. At the last ISHS international symposium on vegetable quality which was held in Seoul, Korea from October 27 to 30, 1997, we had 120 participants from 23 countries. Acta containing about 55 papers will be published in July this year (befor the 1998 IHC in Belgium). The KSHS plans to celebrate its centern- nial anniversary of the official launching of modern horticultural research in Korea. The Agricultural Demonstration Station was
Subject area 1997 1990
V F O Total V F O Total
Plant improvement
Genetic-Gene Bank 12 11 6 29 2 1 0 3
Breeding 21 7 11 39 6 1 0 7
Biotechnology 25 3 21 49 2 0 6 8
Propagation-Nursery 28 5 37 70 4 3 5 12
Pest-disease and Disorders 17 14 18 49 6 14 5 25
Integrated Crop Production systems
Cultural Techniques 70 31 44 145 11 4 5 20
Environment Implications 8 5 10 23 3 0 0 3
Quality implications 19 10 20 49 4 2 1 7
Post-harvest 17 32 21 70 1 3 2 6
(Storage, Packing, and Processing) Economics, Management
and Marketing - - - - - - - -
TOTAL 217 118 188 523 39 28 24 91
V: Vegetables, F: Fruits, and O: Ornamentals, respectively.
Table 15. Number of research papers presented at the annual meeting of the Korean Society for Horticultural Science.
Crops 1995 1996 1997
Spring Fall Total Spring Fall Total Spring Fall Total
Vegetables 90 109 199 64 143 207 145 117 262
Fruits 35 33 68 50 43 93 59 45 104
Ornamentals 69 65 134 88 102 190 127 94 221
Table 16. Number of papers presented at the annual meeting of the Korean Society for Horticultural Science.
Profession 1986 1996 Total
University
Professors 50 160 210
Graduate Students 18 154 172
Research Institutions (RI)
National Horticultural RI 17 85 105
Provincial and Other RIs 0 41 42
RDA and Other RIs 2 64 66
Seed company & Others 4 18 22
Total 91 523 614
Table 17. Professional status of senior author of each presenta- tion at the annual meeting of the Korean Society for Horti- cultural Science.
established in 1906 in Suwon and, after several changes of its official name, has now become the Rural Development Admini- stration (RDA) of the Korean Government, the center for agri- cultural researchs in Korea.
The RDA now has National Horticultrual Research Institute, Horticultrual Sections in 3 Agricultral Experiment Station, 9 Provincial RDAs, and 23 Commodity Experiment Stations mandated with horticultural crop. In addition to about 40 univer- sities and colleges which have the department of horticulture, there are many private research institutes including 42 seed companies. Considering the total population of 45 million and only about 10% agricultural population (as of Dec 1997), the
figures are rather too high as compared to most other developed countries. The export of horticultural produce is not impressive either except for some crops. For example, more than 70% of the grafted cacti being auctioned at Netherlands flower markets are exported from Korea. Korea also exports lilies and roses to Japan. Detailed data will be presented at the conference.
Unfortunately, import has always well exceeded export as far as floricultural crops are concerned. With the booming of horticul- ture in Korea, the KSHS is very anxious to have the chance to become the host country for the 2006 IHC here in Korea rather than continual every other host in European countries.
10. Role of seed companies and handling of germ plasm
Since vegetables are the major horticultural crops in Asia, considerable efforts have been focused on vegetable breeding and a large amount of vegetable seeds are being exported to Western countries. Brassica crops (cabbage, Chinese cabbage, broccoli and cauliflower) and radishes are some of the vege- tables for export from Asia. Some seed companies in Japan, Korea (S), and perhaps Taiwan have been operating overseas companies or branch stations in other countries including the USA and also exporting considerable amount of seeds. However,
we expect some significant changes in seed industry because multinational seed companies such as Novatis and others began to operate official business in some Asian countries with their good seeds, advanced seed processing and cultivar identification technology in addition to the modern purity test methods.
11. Conclusions
W ith the rapid expansion of globalization under the influence of WTO, the world market for agricultural and horticultural produces has been increasing very rapidly and this, along with the introduction of noble cultivars with accurate identity so that the breeding efforts can be protected by the UPOV. However, such a rapid change does not likely take place due possibly to the very conservative attitude of Asian people, especially in their diet habit. In addition to good seeds of excellent traits, gradual and persuasive approaches are thought to be vital for the successful operation and maintenance of branch companies and persistent sales and distribution of seeds and other propagation materials. In spite of the sudden recent break on economic growth in some Asian countries, the role and significance of Asian horticulture will be persistently increased in the future, particularly in breeding, production, and utilization of horticul- tural products, especially of the vegetables. Horticulture in Asia will be continuing its steady progress and exert significant role in world horticulture based on the following fact.
1) Asia has endless list of excellent germ plasm for various horticultural crops especially for cruciferous crops including Brassicas, legumes, and native herb (Zhu et al., 1997).
2) The number of Asians living in other continents of the world has been increasing drastically in recent years and it is more lkikely that they will certainly maintain their conservative palate (Kim et al., 1997;Sakiyama, 1997).
3) There are good markets developed, especially for proccssed horticultural products because of the recent economic growth in some Asian countries.
4) The preferences for vegetables and very intensive and labor- dependent culture will be maintained in most Asian countries.
References
Agrawal, P. K. 1996. The Indian Seed Industry. TVIS Newsletter 1(2): 4-5. AVRDC. Tainan, Taiwan.
FAO. 1995. 1996. Yearbooks on Trade and Production.
FAO. 1998. Internet Homepage. FAO. ≪http:www.fao.org/default.
htm≫
Inden, H., Y. Kawano, Y. Kodama, and K. M. Nakamura. 1997.
Present status of vegetable pickling in Japan. Proc. 7th Intern.
Symp. Veg. Quality, ISHS (Seoul, Korea) Acta Hort. 48, p.
421-428.
ISHS, 1986. Horticultural Reserch International. Published by International Society for Horticultural Science, ISBN 90 6605 3321.
Janick, J. 1994. Horticultural Science. W. H. Freehan Co.
Kim, M. L., H. S. Choi, and M. S. Chung. 1997. Flavor patterns of fresh vegetables and some aspects for improved diet. 7th Intern. Symp. Veg. Quality, ISHS (Seoul, Korea).
Acta Hort. 483 P. 69-82.
Koo, Y. J. and S. Y. Choi. 1991. Scientific Technology of Kimchi (2nd ed.). Kor. Food Res. Institute.
Lee, J. M., J. H. Jung, K. W. Park, and I. O. Yu. 1994. Outline of vegetable growing and research in the Republic of Korea.
Lee, J. M. 1988. Research and development of vegetables in the Republic of Korea Vegetable Research in Southeast Asia.
AVRDC Publication No. 88-303, ISBN: 92-9058-034-8.
Lee, S. K. and J. Y. Yoon (eds). 1994. Horticulture in Northeast Asia: Past, Present and Future.
Marlowe, G. A. 1988. Vegetable research at AVRDC: Achieve- ments and future thrusts.
Vegetable Research in Southeast Asia, AVRDC Publication No.
88-303, ISBN: 92-9058-034-8.
McLean. B. T. (editor) 1988. Vegetable Research in Southeast Asia.
AVRDC Publication No. 99-303, ISBN: 92-9058-034-8.
Nguyen, V. Q., R. C. Coogan, and R. B. H. Wills. 1997. Effect of planting time on the growth and quality of Japanese white radish (Daikon, Raphanus sativus L) grown on the Central Coast of New South Wales, Australia. Rroc. 7th Intern. Symp.
Veg. Quality, ISHS (Seoul, Korea). Acta Hort. 483 p. 83-94.
Park, W. S, 1997. Present status of kimchi industry and its prospect.
Proc. 7th Intern. Symp. Veg. Quality, ISHS (Seoul, Korea).
Acta Hort. 483 p. 397-404.
Sakiyama, R. 1997. Needs for research on vegetable quality in Asian countries. Proc. 7th Intern. Symp. Veg. Quality, ISHS (Seoul, Korea). Acta Hort. 483 p. 25-32.
Wang, S. L. 1997. Recent development of oriental vegetable production and processing in Canada. Proc. 7th Intern. Symp.
Veg. Quality, ISHS (Seoul, Korea). Acta Hort. 483 p429-436.
Zhang, S. 1997. Vegetable production and its future development in China. Chr. Horti. 37(4): 16-17.
Zhu, Y., X. Wu, Q. Yuan, S. Song, and Z. Wu. 1997. Analysis abd evaluation of nutrient components in Chinese traditional and wild vegetables. 7th Intern. Symp. Veg. Quality, ISHS (Seoul, Korea). Acta Hort. 483 p. 111-116.