538
Association of a Corrected QT Interval
with the Carotid Intima-Media Thickness and the Severity
of Coronary Artery Disease in Patients with Coronary Artery Disease
Dae-Woo Hyun, MD, Taek-Geun Kwon, MD, Ki-Young Kim, MD and Jang-Ho Bae, MD Division of Cardiology, Heart Center, Konyang University Hospital, Daejeon, Korea
ABSTRACT
Background and Objectives: A prolonged heart rate-corrected QT interval (QTc) is known to be related to an increased risk of coronary artery disease (CAD) and sudden cardiac death, while the carotid intima-media thick- ness (IMT) is related to CAD. We sought to evaluate the relationship among the QTc, the carotid IMT and the severity of CAD. Subjects and Methods: The QTc and the carotid IMT were measured in 165 consecutive patients who underwent coronary angiography. The measurement of the QTc was done automatically by a digital QT GuardTM system (GE Marquette Medical System, Milwaukee, USA) and the carotid IMT was measured by M’ATH software (METRIS Co., Argenteuil, France). The severity of CAD was divided into minimal disease (90, 54.5%), one-vessel disease (32, 19.4%), and multi-vessel disease (43, 26.1%), according to the number of vessels that were narrowed by more than 50%. Results: The mean values of the QTc were 415.1±20.5 msec in the minimal disease group, 411.7±17.0 msec in the one-vessel disease group and 434.2±46.1 msec in the multi-vessel disease group. The QTc was correlated with age (r=0.236, p=0.002), HDL cholesterol (r=-0.160, p=.043), the right carotid IMT (r=0.17, p=0.026), the left carotid IMT (r=0.178, p=0.022) and the severity of CAD (r=0.243, p=0.002). On the multiple linear regression analysis after adjustment for age and HDL cholesterol, the QTc was an independent factor for the severity of CAD. Conclusion: These results suggest that repolarization abnormalities are associated with the severity of CAD and they may reflect the severity of the morphologic atherosclerotic surrogates. (Korean Circ J 2007;37:538-542)
KEY WORDS: Carotid arteries;Coronary disease.
Introduction
A prolonged QT interval is known to be related with an increased risk of ventricular arrhythmias, coronary artery disease (CAD) and sudden cardiac death.1-9) Thus, the QT interval may help to stratify the cardiovascular risk in the general population, yet the etiology of a pro- longed QT interval is still poorly defined. Myocardial atherosclerotic disease may be another potential etiologic factor that contributes to QT interval prolongation.10)11)
Carotid intima-media thickness (IMT) is a noninvasive surrogate of atherosclerosis and this is increased in those
patients who are at risk for cardiovascular disease and also in those patients with atherosclerotic disease such as CAD.12-14)
We performed this study to evaluate the association of the QT interval with the severity of atherosclerosis, which was determined by performing carotid ultrasonography and coronary angiography in CAD patients.
Subjects and Methods
Patients
The study patients consisted of 165 consecutive pa- tients who had at least 30% luminal stenosis, according to the coronary angiography, and it was not related with the electrocardiogram that did or did not show bundle branch block. The baseline demographic, clinical and angiographic characteristics were examined for all the patients enrolled in a registry.
Hypertension was defined as a blood pressure ≥140/
90 mmHg or the use of antihypertensive medications.
Received: May 3, 2007
Revision Received: June 11, 2007 Accepted: June 12, 2007
Correspondence: Jang-Ho Bae, MD,Division of Cardiology, Heart Center, Konyang University Hospital, 685 Gasuwon-dong, Seo-gu, Daejeon 302-718, Korea
Tel: 82-42-600-9400, Fax: 82-42-600-9420 E-mail: [email protected]
Diabetes was defined as a fasting glucose level of ≥126 mg/dL, a non-fasting glucose level of ≥200 mg/dL, a reported history of diabetes or the current use of diabetes medication. Dyslipidemia was defined as a total choles- terol level ≥200 mg/dL or the use of medication for dyslipidemia.
Electrocardiography
All the standard 12-lead electrocardiograms (MAC 5000, Hewlett Packard Company, Andover, MA, USA) were recorded at a speed of 25 mm/sec and a calibration of 1 mV/mm during waking hours one to two days be- fore catheterization. The measurement of the QT interval and the corrected QT (QTc) interval was done automa- tically by a digital QT GuardTM system (GE, Marquette Medical Systems, Milwaukee, USA). The QTc interval was calculated automatically by using the Bazzet formula.
The QTc interval was divided into four groups. The lowest quartile was the QTc interval ≤404 ms (n=41, 24.8%, mean value: 396.7±6.6 ms), the second quartile was 404 ms <QTc interval ≤412 ms (n=41, 24.8%, mean value: 408.3±2.2 ms), the third quartile was 412 ms
<QTc interval ≤425 ms (n=39, 23.6%, mean value:
418.2±4.0 ms), and the highest quartile was the QTc interval >425 ms (n=44, 26.6%, mean value: 452.1±
41.2 ms).
Carotid artery scanning for measuring the carotid intima-media thickness
Carotid artery scanning was performed 1 day before or on the day of the coronary angiography. A sonogra- pher who was unaware to the clinical information of the study subjects measured the mean carotid IMT using high-resolution ultrasonography (Hewlett-Packard Sonos 5500) with a 7.5-MHz probe and M’ATH software (version 2.01, METRIS Co., Argenteuil, France). This M’ATH software measures semiautomatically the caro- tid IMT. The computerized detection technique is 4 times more precise than ordinary calliper measurements for determining the carotid IMT.
Briefly, the method for the measurement of the caro- tid IMT is as follows. The study subject was requested to lie supine, with head extended, in a dark air-conditioned room. First, the left common carotid artery was scanned longitudinally, and then the image was controlled by adequate gain control and depth control. The depth con- trol was fixed during the whole analysis to set the cali- bration. The gain control was adjusted according to the carotid artery image in order to obtain clear delineation of the intima, media, and adventitia layers of the carotid artery far wall. The image was captured digitally after a clear image of the carotid artery was obtained; the mean IMT value was then calculated using M’ATH software.
If the quality index (the ratio of the detected pixels to the total pixels in a given length) was 0.60 or more, then
the IMT was measured over at least a 1 cm length of the common carotid artery and at a point 1 cm proximal to the carotid bulb.
Coronary angiography
Coronary angiography was performed according to the standard technique, with a Judkins catheter placed through the femoral artery. No complications developed during the procedure in any of the subjects. We defined CAD as the presence of at least 1 major epicardial coro- nary artery with more than 30% stenosis of its diameter.
Coronary angiograms were analyzed visually in at least 2 views. Angiographic grading was performed by a car- diologist and an experienced radiologist, and both of whom were “blinded” to the carotid artery IMT results.
The number of stenosed artery was the number of the epicardial arteries with luminal stenosis more than 50%.
The severity of CAD was assessed according to the fol- lowing criteria; minimal (minimal disease), one-vessel dis- ease (1VD) and multi-vessel disease (MVD).
Statistical analysis
All the analyses were performed with SPSS (version 12.0; SPSS Inc., Chicago, Illinois). The values are expres- sed as means±SD. Discrete variables are presented as group percentages. We used χ2 tests, independent t-tests and ANOVA testing to compare the groups according to the variables. Pearson bivariate correlation analysis and stepwise multiple regression analysis with a backward elimination procedure were performed to discriminate the variables that were related to the QTc interval. The variables correlated with the QTc interval with a p≤
0.05 were entered into multiple regression analysis. Sta- tistical significance was inferred at a p of ≤0.05.
Results
Patient characteristics(Table 1, 2)
The study population consisted of 165 consecutive patients (88 men and 77 women, mean age: 59.8) with angiographically proven CAD.
Correlation between the QTc interval and the carotid intima-media thickness
The QTc interval had significant positive correlation with the right (r=0.174, p=0.026) and left carotid IMT (r=0.178, p=0.022) (Table 3). Yet on multiple linear re- gression analysis after adjusting for age, high density lipoprotein (HDL) cholesterol and the left ventricular (LV) ejection fraction, there was no positive association bet- ween the QTc interval and the right and left carotid IMT (p=0.116, p=0.175, respectively) (Table 4).
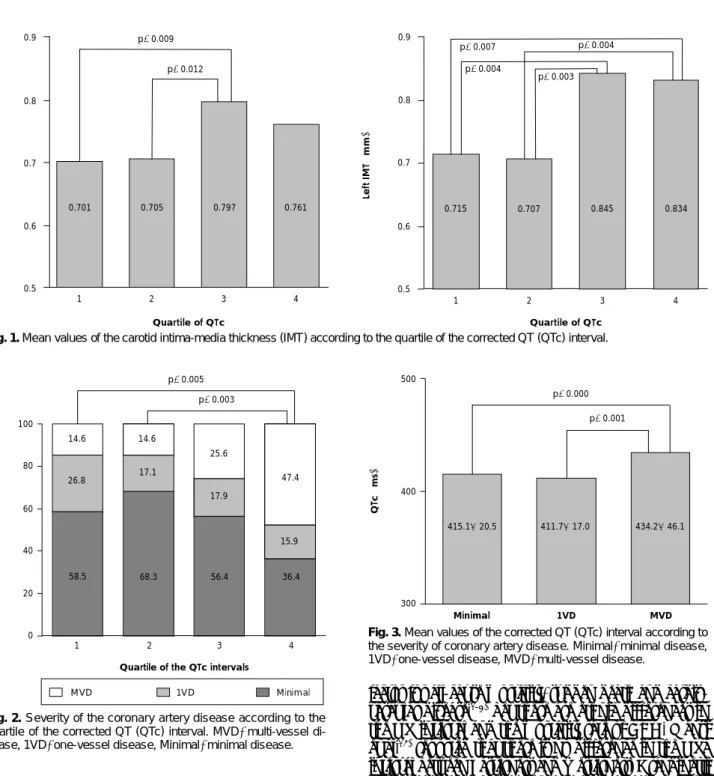
For the right carotid IMT, the IMT of the third quar- tile of the QTc interval was thicker than those of the first and second quartiles (p=0.009, p=0.012, respecti-
vely). For the left carotid IMT, the IMT of the third quartile of the QTc interval was also thicker than those of the first and second quartiles (p=0.004, p=0.003, res- pectively). The carotid IMT of the forth quartile of the
QTc interval was thicker than those of the first and se- cond quartiles (p=0.007, p=0.004, respectively) (Fig. 1).
Correlation between the QTc interval and the severity of the coronary artery disease
The QTc interval was significantly positively correla- ted with the severity of the CAD (r=0.243, p=0.002) (Table 3). Multiple linear regression analysis, after adjus- ting for age, the HDL cholesterol level and the LV ejec- tion fraction, revealed a positive association between the QTc interval and the severity of the CAD in an inde- pendent fashion (p=0.040) (Table 4).
According to the quartile of the QTc interval, the se- verity of CAD was higher in the fourth quartile than that in the first and second quartiles (p=0.005, p=0.003, respectively) (Fig. 2).
The mean value of the QTc interval was longer in the
Table 1.Baseline characteristics of the patients
Men:Women, n (%) 88 (53.3):77 (46.7)
Age (year) 059.8±10.7
Systolic BP (mmHg) 121.5±12.2
Diastolic BP (mmHg) 076.2±9.00 Diagnosis, n (%)
Stable angina 135 (81.8)
Unstable angina 024 (14.5)
Myocardial infarction 006 (03.6) Risk factor, n (%)
Diabetes 037 (22.4)
Hypertension 069 (41.8)
Smoking 045 (27.3)
Dyslipidemia 059 (35.8)
Laboratory test (mg/dL)
Fasting glucose 114.8±36.20
Total cholesterol 180.2±41.60 Triglyceride 179.1±110.9
HDL cholesterol 0042.5±11.100
LDL cholesterol 106.6±30.90
BP: blood pressure, H(L)DL: high(low) density lipoprotein Table 2.ECG, ultrasonographic and angiographic findings of the patients
Carotid IMT (mm)
Right 0.741±0.164 Left 0.776±0.209 ECG data
Heart rate (bpm) 70.3±13.2
QT interval (ms) 391.7±34.70
QTc interval (ms) 419.4±30.10
Echocardiographic datas
LA dimension (cm) 3.8±0.6
LV dimension, systolic (cm) 3.1±0.7 LV dimension, diastolic (cm) 4.9±0.6
LV mass (gram) 191.0±64.20
LV ejection fraction (%) 66.0±9.70 No of stenosed artery, n (%)
Minimal 90 (54.5)
1 vessel 32 (19.4)
2 vessel 17 (10.3)
3 vessel 26 (15.8)
Site of lesion, n (%)
LAD 60 (36.4)
LCx 41 (24.8)
RCA 42 (25.5)
IMT: intima-media thickness, ECG: electrocardiography, bpm: beat per minute, LA: left atrium, LV: left ventricle, No: number, LAD: left anterior descending artery, LCx: left circumflex artery, RCA: right coronary artery, QTc: corrected QT
Table 3.Relationship between corrected QT interval and various factors
Variables r p
Age -0.236 0.002
Systolic BP -0.150 0.068
Diastolic BP -0.156 0.057
Fasting glucose -0.133 0.094
Total cholesterol -0.040 0.612
Triglyceride -0.058 0.463
HDL cholesterol -0.160 0.043
LDL cholesterol -0.026 0.748
LV mass -0.134 0.093
LV ejection fraction -0.182 0.020
IMT (right) -0.174 0.026
IMT (left) -0.178 0.022
Severity of CAD -0.243 0.002
r: Pearson’s correlation coefficient, BP: blood pressure, H(L)DL: high (low) density lipoprotein, LV: left ventricle, IMT: intima-media thick- ness, CAD: coronary artery disease
Table 4.Multiple regression analysis with corrected QT interval as the independent variables
Independent variable β SEM p
Age 0-0.602 00.222 0.007
HDL cholesterol 0-0.375 00.202 0.064 LV ejection fraction 0-0.378 00.238 0.115 Carotid IMT (right) -22.398 14.182 0.116
Age 0-0.612 00.224 0.007
HDL cholesterol 0-0.374 00.202 0.066 LV ejection fraction 0-0.365 00.239 0.128 Carotid IMT (left) -15.421 11.307 0.175
Age 0-0.627 00.213 0.004
HDL cholesterol 0-0.353 00.201 0.080 LV ejection fraction 0-0.320 00.238 0.181 Severity of CAD 0-5.536 02.676 0.040 β: standard regression coefficient, SEM: standard error of the mean, HDL: high density lipoprotein, LV: left ventricle, IMT: intima-media thickness, CAD: coronary artery disease
MVD than the minimal disease group and the 1 VD group (p=0.000, p=0.001, respectively) (Fig. 3).
Discussion
The main findings of this study are: 1) The QTc interval was positively correlated to the carotid IMT in a non-independent fashion. 2) The QTc interval was significantly associated with the severity of the CAD.
Previous studies have found that the QTc interval has prognostic value that is independent of other cardiovas- cular risk indicators such as cigarette smoking, hyperten- sion, the lipid profile, the body mass index and diabetes in the elderly,4) and a prolonged QTc interval is a risk
factor for all-cause mortality, sudden death and cardio- vascular disease.1-3) Yet there are ethnic differences in the QT interval and the mortality rate of CAD. Mansi et al.15) reported that there is no difference in the QTc interval between Easterners and Westerners. Grandinetti et al.3) reported that prevalence of a prolonged QTc and the mean QTc interval were significantly higher among Asians and Hawaiians when compared to Caucasians.
Easterners have a lower mortality rate from CAD than do Westerners.16) In a Japanese population study, Nakanishi et al.17) reported that a prolonged QTc was a marker for high risk for all-cause mortality and mortality from heart disease or from CAD after adjusting for other CAD risk factors. A prolonged QT interval is currently known to be related with the risk factors for cardiovascular disease and cardiovascular mortality.
With regards to carotid IMT, an increased carotid IMT is regarded as an early sign of atherosclerosis. The IMT increases if the vascular walls are exposed to cardiovas-
Fig. 3.Mean values of the corrected QT (QTc) interval according to the severity of coronary artery disease. Minimal: minimal disease, 1VD: one-vessel disease, MVD: multi-vessel disease.
QTc (ms)
500
p=0.000
p=0.001
400
300
Minimal 1VD MVD
415.1±20.5 411.7±17.0 434.2±46.1 Fig. 1.Mean values of the carotid intima-media thickness (IMT) according to the quartile of the corrected QT (QTc) interval.
Right IMT (mm)
0.9
Quartile of QTc
0.761 0.8
0.7
0.6
0.5 1 2 3 4
Left IMT (mm)
Quartile of QTc
1 2 3 4
0.9
0.8
0.7
0.6
0.5 p=0.012
p=0.009
p=0.007
0.707 0.845
0.715 0.834
p=0.004 p=0.004
p=0.003
0.797 0.705
0.701
Fig. 2.Severity of the coronary artery disease according to the quartile of the corrected QT (QTc) interval. MVD: multi-vessel di- sease, 1VD: one-vessel disease, Minimal: minimal disease.
Quartile of the QTc intervals
% of number
p=0.005 p=0.003
14.6
25.6
58.5 68.3 56.4 36.4
26.8 17.1
17.9
15.9
1 2 3 4 100
080
060
040
020
000
MVD 1VD Minimal 14.6
47.4
cular risk factors such as age, dyslipidemia, hypertension and smoking.12) The reduction of the cardiovascular risk factors inhibits the progression of increases in the IMT.
Determining the carotid IMT is a useful screening test for predicting significant CAD and for differentiating the high risk patients,13) and an increased carotid IMT is cor- related with the severity of CAD.18)19) Many other studies have suggested that the QT interval and the carotid IMT are related with the risk factors for CAD. So, we sought to determine the relationship between the QT interval and the carotid IMT. There have been several reports about those associations. Festa et al.20) reported that there is a significant relation of the QTc interval to carotid atherosclerosis in non-diabetic subjects, so the QT inter- val may serve as a marker for subclinical atherosclerotic disease. Takebayashi et al.11) reported that the QTc inter- val is significantly correlated with the carotid IMT in patients with type 2 diabetes (r=0.7206, p<0.0001). In our study, the QTc and the quartile of the QTc was re- lated with the carotid IMT in a non-independent fashion.
The QT interval is related with the carotid IMT and this might be primarily caused by coronary atheroscle- rosis.11) The carotid IMT is correlated with the severity of CAD.18)19) So, we formed a hypothesis that the QT interval will be related with the severity of CAD. The result was that the QTc interval was correlated with the severity of CAD and the severity of the CAD was higher in the fourth quartile of the QTc interval than that in the first and second quartiles.
Our result showed that the QTc interval was related with the carotid IMT and the severity of CAD. We suggest that prolongation of the QTc interval, thickening of the carotid IMT and the severity of CAD may be the result of a common etiology, for example, atherosclerosis. The QTc interval may therefore serve as a marker for the se- verity of atherosclerosis. There is currently no report about the direct mechanism that allows coronary athero- sclerosis to prolong the QTc interval. However, there are some suggestions that a common gene might exist that modifies both the atherosclerotic process and the repo- larization abnormalities and so results in a prolonged QT interval.10) Further studies are needed to evaluate whe- ther subjects with a prolonged QTc represent the high- risk patients and if they need to be tested to evaluate the severity of their atherosclerosis. The limitation of this study is the relative small size of the study population.
In summary, the QTc interval is positively correlated to the carotid IMT in a non-independent fashion and it is significantly associated with the severity of CAD.
This result suggests that repolarization abnormalities may reflect the severity of the morphologic atherosclerotic surrogates.
REFERENCES
1) Schouten EG, Dekker JM, Meppelink P, Kok FJ, Vandenbroucke
JP, Pool J. QT-interval prolongation predicts cardiovascular mor- tality in an apparently healthy population. Circulation 1991;84:
1516-23.
2) Fauchier L, Maison-Blanche P, Forhan A, et al. Association bet- ween heart rate-corrected QT interval and coronary risk factors in 2,894 healthy subjects (The DESIR study). Am J Cardiol 2000;86:557-9.
3) Grandinetti A, Seifriend S, Mor J, Chang HK, Theriault AG.
Prevalence and risk factors for prolonged QTc in a multiethnic cohort in rural Hawaii. Clin Biochem 2005;38:116-22.
4) de Bruyne MC, Hoes AW, Kors JA, Hofman A, van Bemmel JH, Grobbee DE. Prolonged QT interval predicts cardiac and all- cause mortality in the elderly. Eur Heart J 1999;20:278-84.
5) Wong KY, MacWalter RS, Douglas D, Fraser HW, Ogston SA, Struthers AD. Long QTc predicts future cardiovascular death in stroke survivors. Heart 2003;89:377-81.
6) Robbins J, Nelson JC, Rautaharju PM, Gottdiener JS. The asso- ciation between the length of the QT interval and mortality in the cardiovascular health study. Am J Med 2003;115:689-94.
7) Davey P. QT interval and mortality from coronary artery disease.
Prog Cardiovasc Dis 2000;42:359-84.
8) Dekker JM, Crow RS, Hannan PJ, Schouten EG, Folsom AR.
Heart rate-corrected QT interval prolongation predicts risk of coronary heart disease in black and white middle-aged men and women. J Am Coll Cardiol 2004;43:565-71.
9) Peng S, Yu Y, Hao K, et al. Heart rate-corrected interval duration is significantly associated with blood pressure in Chinese hyper- tensives. J Electrocardiol 2006;39:206-10.
10) Festa A, D’Agostino R, Rautahrju P, et al. Is QT interval a marker of subclinical atherosclerosis in nondiabetics? Stroke 1999;30:
1566-71.
11) Takebayashi K, Aso Y, Matsutomo R, Wakabayashi S, Inukai T.
Association between the corrected QT intervals and combined intimal-medial thickness of the carotid artery in patients with type 2 diabetes. Metabolism 2004;53:1152-7.
12) Bae JH, Seung KB, Jung HO, et al. Analysis of Korean carotid intima-media thickness in Korean healthy subjects and patients with risk factors. Korean Circ J 2005;35:513-24.
13) Jeong IB, Bae JH, Kim KY, et al. The carotid imtima-media thick- ness as a screening test for coronary artery disease. Korean Circ J 2005;35:460-6.
14) Yoon SH, Bae JH, Kim KY, Hyun DW, Kim WH, Koo HS. No- ninvasive surrogates in assessing the severity of coronary athero- sclerosis. Korean J Med 2005;69:493-502.
15) Mansi IA, Nash IS. Ethnic differences in electrocardiographic intervals and axes. J Electrocardiol 2001;34:303-7.
16) Verschuren WM, Jacobs DR, Bloemberg BP, et al. Serum total cholesterol and long-term coronary heart disease mortality in different cultures. JAMA 1995;274:131-6.
17) Nakanishi S, Yamada M, Hattori N, Suzuki G. Relation betweein QT duration and mortality in an elderly Japanese population. Am J Cardiol 2004;93:1182-5.
18) Hyun DW, Kim KS, Hur SH. Correlation between the carotid intima-media thickness and the plaque burden of the left main coronary artery using ultrasonography. Korean Circ J 2005;35:
795-800.
19) Park KR, Kim KY, Yoon SM, Bae JH, Seong IW. Correlation between intima-media thickness in carotid artery and the extent of coronary atherosclerosis. Korean Circ J 2003;33:401-8.
20) Festa A, D’Agostino R, Rautahrju P, Mykkanen L, Haffner SM.
Relation of systemic blood pressure, left ventricular mass, insulin sensitivity, and coronary artery disease to QT interval duration in nondiabetic and type 2 diabetic subjects. Am J Cardiol 2000;
86:1117-22.