Introduction
Carotid artery ultrasound (US) is a noninvasive and effective tool for screening extracranial carotid atherosclerosis, and it en- ables evaluation of several features of the carotid artery such as the intima-media thickness (IMT), degree of stenosis, and plaque morphology. While each modality assesses “atherosclero- sis”, the particular morphological entities captured may reflect different aspects of atherogenesis with different biological deter- minants. Among carotid US determinations, carotid IMT ac- quired using B-mode ultrasonography is widely considered to be an early index of atherosclerosis and has been related to car- diovascular risk factors and incidence of vascular diseases such as myocardial infarction and stroke.1-3) Recently, certain modali-
ties, such as US assessment of carotid plaque area or volume, are reported to be more sensitive than IMT for detecting temporal changes in atherosclerosis.4)5) For assessment of carotid plaque area, total plaque area (TPA) can be measured by summating the cross-sectional areas of all carotid plaques visualized in a specified region in 2-dimensions (2D).4-10) Even more recently, because carotid plaque progression is not limited to changes in 1 or 2 directions, attempts have been made to quantify carotid plaque volume with 3-dimensional (3D) US.11-15) In this ap- proach, a reader manually traces plaque borders within cross- sectional planes at specified intervals. Computer software recon- stitutes a 3D plaque image using spatial coordinates, and volumes are summed and reported as total carotid plaque vol- ORIGINAL ARTICLE J Cardiovasc Ultrasound 2013;21(2):72-80
Association of Carotid Artery Parameters of Atherosclerosis in Coronary Artery Disease
Hyun Soo Kim, MD and Kyoung Im Cho, MD
Division of Cardiology, Department of Internal Medicine, Kosin University School of Medicine, Busan, Korea
Background: Although carotid intima-media thickness (IMT) is the most commonly used ultrasonic measurement of atherosclerosis, plaque burden can be also assessed by ultrasound (US). We investigated the relationship between IMT, total plaque area (TPA) and total plaque volume (TPV) in patients with coronary artery disease (CAD).
Methods: One hundred and seven patients with suspected CAD and carotid plaques identified by duplex ultrasound underwent 3-dimensional US and coronary angiography. The mean IMT, TPA, and TPV were analyzed for patients with CAD according to the severity of CAD.
Results: In the 107 participants, IMT, TPA and TPV averaged 0.90 ± 0.26 mm, 0.42 ± 0.39 cm2 and 237.0 ± 301.2 mm3, respectively. We found significant correlations for mean IMT : TPA, mean IMT : TPV and TPA : TPV of 0.448, 0.587 and 0.873, respectively (all p < 0.005). Although there was no significant association of IMT and the severity of CAD, TPA and TPV showed significant positive correlation with CAD severity (r = 0.340, p = 0.0003 for TPA and r = 0.465, p < 0.0001 for TPV).
Multivariate linear regression analysis showed age was the only significant attributor to IMT, TPA, and TPV. Mean IMT was significantly associated only with hypertension. TPA was significantly associated with male sex, hypertension, and low density lipoprotein-cholesterol (LDL-C). TPV was significantly associated with male sex, C-reactive protein, and LDL-C.
Conclusion: Although there were significant correlations among the various US measures of carotid artery morphology, there seemed to be different biological determinants of IMT, TPA, and TPV. We might need to be selective about the particular measurements for specific applications.
KEY WORDS: Atherosclerosis · Carotid arteries · Imaging · Plaque · Ultrasonography.
• Received: February 18, 2013 • Revised: May 30, 2013 • Accepted: June 7, 2013
• Address for Correspondence: Kyoung Im Cho, Division of Cardiology, Department of Internal Medicine, Kosin University School of Medicine, 262 Gamcheon-ro, Seo-gu, Busan 602-702, Korea Tel: +82-51-990-6105, Fax: +82-51-990-3005, E-mail: [email protected]
• This is an Open Access article distributed under the terms of the Creative Commons Attribution Non-Commercial License (http://creativecommons.org/licenses/by-nc/3.0) which permits unrestricted non-commercial use, distribution, and reproduction in any medium, provided the original work is properly cited.
ume (TPV).11-16) Although IMT, TPA, and TPV each represent a morphological or anatomical attribute of the carotid arterial wall, each might actually measure a different aspect of the dis- ease process. For instance, IMT may reflect wall hyperplasia or hypertrophy related to hypertension, whereas the assessments of plaque size, either TPA or TPV, necessarily reflect a more ad- vanced stage of atherosclerosis, which may be related to foam cell formation or thrombosis. In order to elucidate the relation- ship between IMT, TPA, and TPV, we simultaneously mea- sured these parameters in the same individuals with suspected coronary artery disease. We evaluated their correlations with each other and their association with traditional cardiovascular risk factors. Moreover, we hypothesized that 2D US measure- ment of plaque volume by the area-width method may have a role in the assessment of plaque burden, and investigated the as- sociation between plaque volume by 2D US and plaque volume by 3D US.
Methods
Study population
We examined 107 consecutive patients admitted with sus- pected coronary artery disease (CAD) who underwent coronary angiography from December 2011 to November 2012. US quantification of carotid artery IMT was obtained for all pa- tients. Cardiovascular risk assessment included the presence or absence of medically diagnosed hypertension, diabetes mellitus (DM), dyslipidemia, and current cigarette smoking status. Blood pressure (BP) was measured with a standard mercury manome- ter and participants were considered to have hypertension if their BP was ≥ 140/≥ 90 mmHg as recommended by the Joint National Committee VII, or if they were currently receiving treatment for hypertension. The American Diabetes Association criteria were used to define DM and we considered a participant to have DM if fasting plasma glucose levels were ≥ 126 mg/dL in 2 consecutive assessments, or if they were currently receiving treatment for DM. The presence of dyslipidemia was assumed if participants were taking lipid-lowering drugs, or had a high cholesterol level. Smoking was categorized into the 3 following categories: never smoked, up to 20 pack-years smoking history, and greater than 20 pack-years smoking history. Acute coronary syndrome (ACS) was assumed if participants were diagnosed with myocardial infarction or unstable angina. Patients with secondary hypertension, chronic congestive heart failure, estab- lished cerebrovascular disease, infections, immunological disor- ders, chronic renal insufficiency, or peripheral arterial disease were excluded. This study was approved by the Institutional Review Board of Kosin University School of Medicine, and all patients gave written informed consent before participation.
Laboratory measurement
Venous blood was drawn in the morning after an overnight fast. Complete blood cell counts, serum electrolytes, and thy-
roid function tests for all patients were found to be within the normal range of standardized values. The following parameters were obtained with standard techniques on the day of examina- tion: total cholesterol, low density lipoprotein-cholesterol (LDL- C), high density lipoprotein-cholesterol (HDL-C), triglycerides, high sensitivity C-reactive protein (hs-CRP), and fibrinogen.
Height and weight were measured, and body mass index (kg/
m2) was calculated. Participants rested for at least 10 minutes in supine position prior to carotid US examination and normal sinus rhythm with a rate of 60-100 beats/min was required on resting electrocardiogram prior to examination.
Carotid ultrasound
In all participants, the extracranial carotid artery US with IMT measurements and an analysis for the presence of plaques were performed by the two expert examiners who were blind- ed to the patients’ medical histories. The US scan utilized a Viv- id 7 (GE Medical System, Milwaukee, WI, USA) equipped with a 7 to 12-Mhz linear-array scanner and a LOGIQ E9 (GE Medical System, Milwaukee, WI, USA) equipped with a 6 to 18-Mhz multi frequency real time 4-dimensional linear trans- ducer. All participants were examined in a supine position, with their necks extended and their chins facing the contralat- eral side. Carotid arteries were examined bilaterally in the lon- gitudinal and transversal planes.
Carotid IMT measurement
A single observer, blinded to the participants’ demographic data and cardiovascular risk, measured the combined thickness of the intima and media of both common carotid arteries (CCA).
After placing a region of interest in the far wall of the CCA, the mean IMT was estimated in a region free of atherosclerotic plaques with the use of an automatic tracking system.17) Mean IMT was computed from 80 to 120 measurements over a 10 mm span ending 5 mm proximal to the transition between the CCA and bulb regions. Intra- and inter-operator coefficients of variation were 2.9% and 3.0%, respectively, and intra- and inter- operator intra-class correlations were both 0.96.
TPA measurement
An increased IMT was defined as ≥ 1.0 mm in either or both carotid arteries, and the presence of an atherosclerotic plaque was defined as a focal structure that encroaches into the arterial lumen of at least 0.5 mm or 50% of the surrounding IMT value or demonstrates a thickness of > 1.5 mm as mea- sured from the media-adventitial interface to the intima-lu- men interface.18) The measurement plane was determined by scanning to find the largest plaque extension in longitudinal views of each plaque in the common, internal and external ca- rotid arteries bilaterally.4-10) The image was then frozen, mag- nified, and the plaque was measured by tracing around the pe- rimeter with a cursor on the screen. Fig. 1 shows the process of area determination by manual planimetry. Measurement of
plaque area was acquired from tracing the plaque border by defining plaque as previously mentioned.4)7) The process was repeated until all plaques on both sides were measured. TPA was the sum of the areas of all plaques between the clavicle and angle of the jaw. Intra- and inter-observer intra-class cor- relations were 0.95 and 0.87, respectively.
Plaque volume measurement
We measured plaque burden by 2D plaque area and 3D plaque volume (PV) simultaneously in selected cases, to evalu- ate the correlation between area and volume. Two observers were trained to identify and measure plaque volume with the 3D US images. Utilizing data from the 2D plaque area stud- ies to localize plaques, 3D US images of plaque volumes were measured by manual planimetry utilizing the longitudinal scans of the CCA, bulb and internal carotid artery (ICA) (Fig.
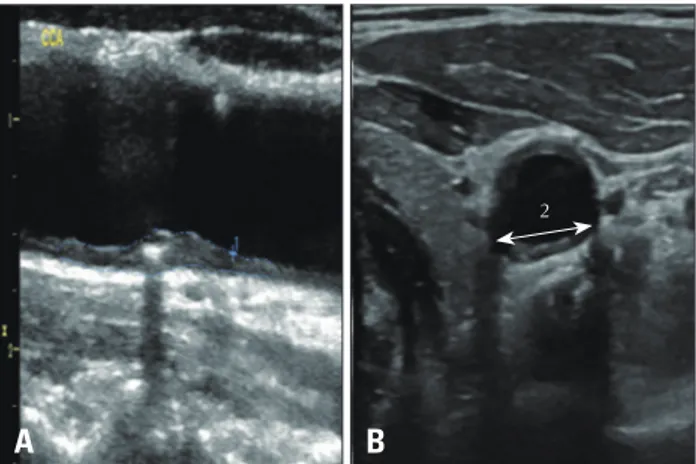
2). Plaque volume calculations were carried out from the trans- verse plane starting at the edge of the plaque and moving along the longitudinal axis toward the opposite edge of the plaque. Plaque boundaries were traced using a mouse driven cross-haired cursor. Cross-sectional area of the plaque was de- lineated from 8-12 transverse sections of the image between the edges of the plaque, and the mean plaque volume value of 3 measurements of each plaque was used for analysis. This methodology for PV measurement and its validation has been described previously.19)20) Also, we calculated a modified plaque volume as the 2D US plaque area in the longitudinal plane multiplied by plaque width measured in the cross sectional plane. Fig. 3 shows the process of plaque determination by
Fig. 1. The process of measurement of total plaque area (TPA) by manual planimetry. This patient showed diffuse plaques in near (A) and far (B) wall of the common carotid artery and carotid bulb (C). Measurement of plaque area was acquired from tracing the each plaque border, and TPA was the sum of the areas of all plaques (A + B + C).
Fig. 2. The process of measurement of total plaque volume (TPV) by manual planimetry. Three-dimensional ultrasound images of plaque volumes were acquired from the longitudinal and cross sectional carotid scans. Plaque boundaries were traced using a mouse driven cross-haired cursor and cross-sectional area of the plaque was delineated from 8-12 transverse sections of the image between the edges of the plaque, and the mean plaque volume value of 3 measurements of each plaque was used for analysis. In this patient, plaques were visualized in left internal carotid artery (A) and right bulb (B), and TPV was the sum of the areas of all plaques (A + B).
Fig. 3. Calculation of a modified plaque volume as the 2 dimensional ultrasound plaque area in the longitudinal plane (A) multiplied by plaque width (B) measured in the cross sectional plane (1 × 2).
A
A
A
B
B
B C
2
manual planimetry. Results of PV are presented as TPV from the 3D method and 2D PV from the 2D method. Intra- and in- ter-observer reliabilities were 0.93 and 0.94, respectively.
Coronary angiogram
An INTEGRIS BV 5000 (Philips Medical System, Best, Netherlands) was utilized to visualize the coronary artery ste- nosis. Quantitative measurements were analyzed by a work- station with dedicated software (WIN 32 version 3.3). Pa- tients with at least one lesion > 50% within the main branches of the coronary arteries were considered to have significant CAD. Patients with minimal atherosclerotic lesions (≤ 50%) in the coronary arteries were not included. The association of mean IMT, TPA, and IMT with CAD severity was analyzed for patients with angiographically normal coronary arteries, one vessel CAD, two vessel CAD, and three vessel CAD.
Statistical analysis
Statistical analysis was performed with SPSS for Windows ver- sion 12.0 (SPSS Inc., Chicago, IL, USA). Results are presented as the mean ± standard deviation (SD) or percentage. For pairwise
correlations between variables, we used data from all partici- pants. Bland-Altman analysis was uses in comparison of data be- tween 2D area-width volume and each matched 3D volume.
Correlations between variables were made using Pearson correla- tion tests, and because of the large range of TPA and TPV re- sults, analysis results using a logarithmic scale are reported in analysis of coronary angiography groups. Multivariate linear re- gression was used to determine sources of variation for trans- formed carotid US measurements, using selected continuous and discrete risk factor traits as covariates. Statistical significance was set at 0.05.
Results
Participants’ clinical characteristics at baseline
The mean age of the 107 study participants was 67.4 ± 9.8 years, and 60% (64/107) were male. In the entire sample, IMT, TPA, and TPV were 0.90 ± 0.26 mm, 0.42 ± 0.39 cm2, and 237.0 ± 301.2 mm3, respectively. Clinical characteristics and carotid artery parameters were analyzed according to the pres-
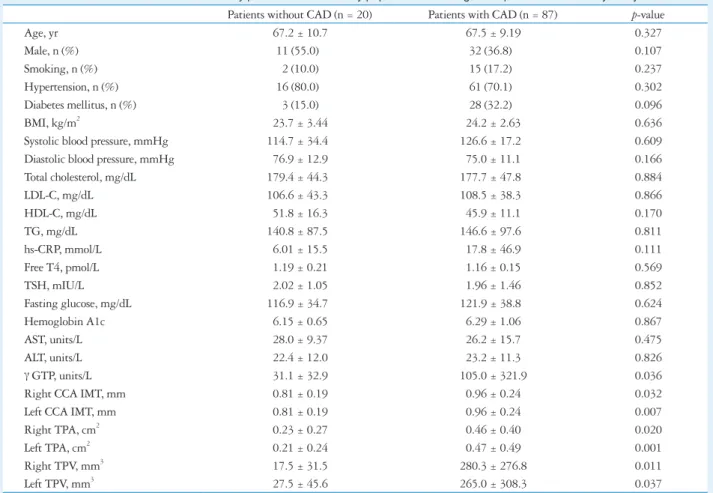
Table 1. Clinical characteristics and carotid artery parameters in the study population according to the presence of coronary artery disease Patients without CAD (n = 20) Patients with CAD (n = 87) p-value
Age, yr 67.2 ± 10.7 67.5 ± 9.19 0.327
Male, n (%) 11 (55.0) 32 (36.8) 0.107
Smoking, n (%) 2 (10.0) 15 (17.2) 0.237
Hypertension, n (%) 16 (80.0) 61 (70.1) 0.302
Diabetes mellitus, n (%) 3 (15.0) 28 (32.2) 0.096
BMI, kg/m2 23.7 ± 3.44 24.2 ± 2.63 0.636
Systolic blood pressure, mmHg 114.7 ± 34.4 126.6 ± 17.2 0.609
Diastolic blood pressure, mmHg 76.9 ± 12.9 75.0 ± 11.1 0.166
Total cholesterol, mg/dL 179.4 ± 44.3 177.7 ± 47.8 0.884
LDL-C, mg/dL 106.6 ± 43.3 108.5 ± 38.3 0.866
HDL-C, mg/dL 51.8 ± 16.3 45.9 ± 11.1 0.170
TG, mg/dL 140.8 ± 87.5 146.6 ± 97.6 0.811
hs-CRP, mmol/L 6.01 ± 15.5 17.8 ± 46.9 0.111
Free T4, pmol/L 1.19 ± 0.21 1.16 ± 0.15 0.569
TSH, mIU/L 2.02 ± 1.05 1.96 ± 1.46 0.852
Fasting glucose, mg/dL 116.9 ± 34.7 121.9 ± 38.8 0.624
Hemoglobin A1c 6.15 ± 0.65 6.29 ± 1.06 0.867
AST, units/L 28.0 ± 9.37 26.2 ± 15.7 0.475
ALT, units/L 22.4 ± 12.0 23.2 ± 11.3 0.826
γ GTP, units/L 31.1 ± 32.9 105.0 ± 321.9 0.036
Right CCA IMT, mm 0.81 ± 0.19 0.96 ± 0.24 0.032
Left CCA IMT, mm 0.81 ± 0.19 0.96 ± 0.24 0.007
Right TPA, cm2 0.23 ± 0.27 0.46 ± 0.40 0.020
Left TPA, cm2 0.21 ± 0.24 0.47 ± 0.49 0.001
Right TPV, mm3 17.5 ± 31.5 280.3 ± 276.8 0.011
Left TPV, mm3 27.5 ± 45.6 265.0 ± 308.3 0.037
All values are presented as the mean ± standard deviation (continuous variables) and number (categorical variables). CAD: coronary artery disease, BMI: body mass index, LDL-C: low density lipoprotein-cholesterol, HDL-C: high density lipoprotein-cholesterol, TG: triglycerides, hs-CRP: high sensitivity C-reactive protein, TSH: thyroid stimulating hormone, AST: aspartate aminotransferase, ALT: alanine aminotransferase, GTP: glutamyl transferase, CCA: common carotid artery, IMT: intima media thickness, TPA: total plaque area, TPV: total plaque volume
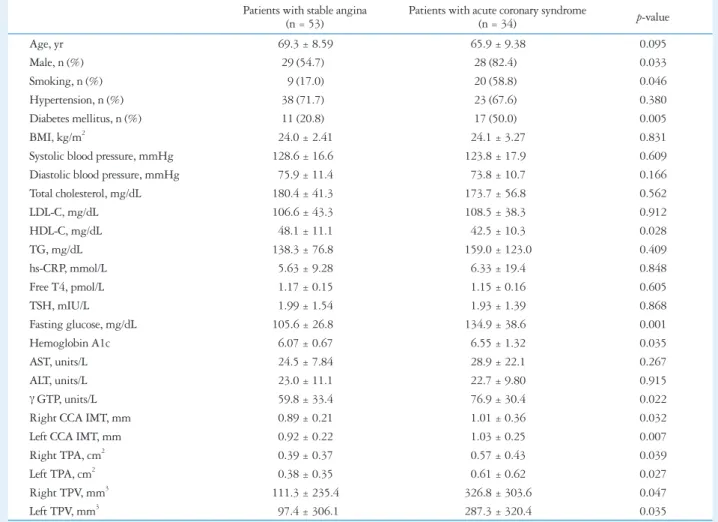
ence or absence of CAD, and are shown in Table 1. As expected, patients with CAD (n = 87) showed significantly increased IMT, TPA, and TPV bilaterally (all p < 0.05) (Table 1). When we dichotomized patients with CAD into stable angina or ACS, patients with ACS were more often male or smokers, with a higher prevalence of DM, lower HDL-C, and increased IMT, TPA, and TPV bilaterally (all p < 0.05) (Table 2).
Correlations among IMT, TPA, and TPV
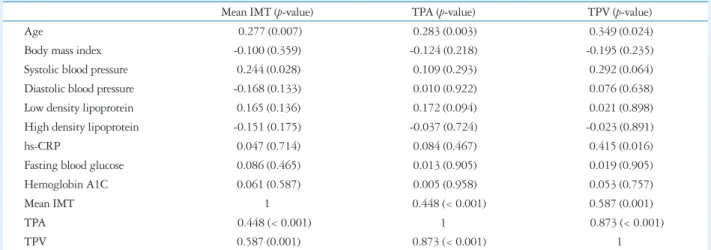
We found significant correlations for mean IMT : TPA, mean IMT : TPV and mean TPA : TPV of 0.448, 0.587, and 0.873, respectively (all p < 0.005) (Table 3). For the IMT : TPA pairs, r was 0.521 and 0.472 in right and left pairs re- spectively (all p < 0.001). For the IMT : TPV pair, r was 0.560 (p = 0.002) and 0.536 (p = 0.003) in right and left pairs re- spectively. For the TPA : TPV pair, r was 0.841 and 0.905 in right and left pairs respectively (all p < 0.001). Thus, the vari- ables were significantly correlated, but the correlation coeffi- cients were somewhat smaller for the comparisons of IMT and
either TPA or TPV than the correlation coefficient for the TPA and TPV comparisons. Although there was no significant asso- ciation of IMT and the severity of CAD (group 0 having normal coronary arteries, group 1 with one vessel CAD, group 2 with two vessel CAD, and group 3 with three vessel CAD), loga- rithmic transformation of TPA (Log TPA) and TPV (Log TPV) showed significant positive correlation with CAD sever- ity (r = 0.436, p < 0.0003 for Log TPA and r = 0.593, p <
0.0001 for Log TPV) (Fig. 4).
Multivariate linear regression analysis
Multivariate linear regression was performed to examine the independent factors affecting the various parameters of carotid atherosclerosis (Table 4). Traditional cardiovascular risk factor such as age, sex, hypertension history, current smoking status, diabetes history, lipid profile and hs-CRP were examined as independent variables. Age was the only significant contribu- tor to all three variables. However, there were differences in the associations of these measures with the remaining cardio-
Table 2. Clinical characteristics and carotid artery parameters of the 87 patients with coronary artery disease according to the presence of acute coronary syndrome
Patients with stable angina
(n = 53) Patients with acute coronary syndrome
(n = 34) p-value
Age, yr 69.3 ± 8.59 65.9 ± 9.38 0.095
Male, n (%) 29 (54.7) 28 (82.4) 0.033
Smoking, n (%) 9 (17.0) 20 (58.8) 0.046
Hypertension, n (%) 38 (71.7) 23 (67.6) 0.380
Diabetes mellitus, n (%) 11 (20.8) 17 (50.0) 0.005
BMI, kg/m2 24.0 ± 2.41 24.1 ± 3.27 0.831
Systolic blood pressure, mmHg 128.6 ± 16.6 123.8 ± 17.9 0.609
Diastolic blood pressure, mmHg 75.9 ± 11.4 73.8 ± 10.7 0.166
Total cholesterol, mg/dL 180.4 ± 41.3 173.7 ± 56.8 0.562
LDL-C, mg/dL 106.6 ± 43.3 108.5 ± 38.3 0.912
HDL-C, mg/dL 48.1 ± 11.1 42.5 ± 10.3 0.028
TG, mg/dL 138.3 ± 76.8 159.0 ± 123.0 0.409
hs-CRP, mmol/L 5.63 ± 9.28 6.33 ± 19.4 0.848
Free T4, pmol/L 1.17 ± 0.15 1.15 ± 0.16 0.605
TSH, mIU/L 1.99 ± 1.54 1.93 ± 1.39 0.868
Fasting glucose, mg/dL 105.6 ± 26.8 134.9 ± 38.6 0.001
Hemoglobin A1c 6.07 ± 0.67 6.55 ± 1.32 0.035
AST, units/L 24.5 ± 7.84 28.9 ± 22.1 0.267
ALT, units/L 23.0 ± 11.1 22.7 ± 9.80 0.915
γ GTP, units/L 59.8 ± 33.4 76.9 ± 30.4 0.022
Right CCA IMT, mm 0.89 ± 0.21 1.01 ± 0.36 0.032
Left CCA IMT, mm 0.92 ± 0.22 1.03 ± 0.25 0.007
Right TPA, cm2 0.39 ± 0.37 0.57 ± 0.43 0.039
Left TPA, cm2 0.38 ± 0.35 0.61 ± 0.62 0.027
Right TPV, mm3 111.3 ± 235.4 326.8 ± 303.6 0.047
Left TPV, mm3 97.4 ± 306.1 287.3 ± 320.4 0.035
All values are presented as the mean ± standard deviation. BMI: body mass index, LDL-C: low density lipoprotein-cholesterol, HDL-C: high density lipoprotein- cholesterol, TG: triglycerides, hs-CRP: high sensitivity C-reactive protein, TSH: thyroid stimulating hormone, AST: aspartate aminotransferase, ALT: alanine aminotransferase, GTP: glutamyl transferase, CCA: common carotid artery, IMT: intima media thickness, TPA: total plaque area, TPV: total plaque volume
vascular risk factors. Mean IMT was significantly associated only with hypertension, and not with current smoking status, DM, hs-CRP, or cholesterol in the study participants. In con- trast, TPA was significantly associated with male sex, hyper- tension and LDL, and not with current smoking status, DM or hs-CRP in this sample. Finally, TPV was significantly asso- ciated with male sex, hs-CRP, and LDL-C, and not with hy- pertension, current smoking status, DM, hypertension or HDL-C in these patients.
Association between plaque volume by 2D and 3D US
The 2D area-width volume were acquired from 100 plaques in 42 study patients with CCA plaques due to technical limi- tation in assessment of plaques in the carotid bulb or ICA in the remaining 65 patients. When we compare 2D area-width volume (110.2 ± 111.3 mm3) with each matched 3D volume (130.2 ± 101.4 mm3) by Bland-Altman analysis, the differ- ences were within mean ± 1.96 SD, and the two methods
may be used interchangeably (Fig. 5).
Discussion
In this study of atherosclerosis in patients with CAD, we si- multaneously measured IMT, TPA, and TPV by US. We found that patients with ACS were more likely male or smok- ers, with a higher prevalence of DM, lower HDL-C, increased IMT, TPA, and TPV bilaterally. Secondly, although there were significant correlations among these parameters, the as- sociation between IMT with either TPA or TPV was less cor- related than TPA and TPV. Finally, associations with tradi- tional cardiovascular risk factors differed substantially between IMT, TPA, and TPV. While each was significantly associated with age, IMT was only significantly associated with hyper- tension, while TPA was associated with male sex, hyperten- sion, and LDL-C, and TPV was associated with male sex, hs- CRP, and LDL-C. These findings were similar to the results of Spence and Hegele,21) who suggest that the three different US-derived measurements of carotid artery morphology, while
Table 3. Correlation coefficients between carotid artery parameters and clinical parameters of study patients (n = 107)
Mean IMT (p-value) TPA (p-value) TPV (p-value)
Age 0.277 (0.007) 0.283 (0.003) 0.349 (0.024)
Body mass index -0.100 (0.359) -0.124 (0.218) -0.195 (0.235)
Systolic blood pressure 0.244 (0.028) 0.109 (0.293) 0.292 (0.064)
Diastolic blood pressure -0.168 (0.133) 0.010 (0.922) 0.076 (0.638)
Low density lipoprotein 0.165 (0.136) 0.172 (0.094) 0.021 (0.898)
High density lipoprotein -0.151 (0.175) -0.037 (0.724) -0.023 (0.891)
hs-CRP 0.047 (0.714) 0.084 (0.467) 0.415 (0.016)
Fasting blood glucose 0.086 (0.465) 0.013 (0.905) 0.019 (0.905)
Hemoglobin A1C 0.061 (0.587) 0.005 (0.958) 0.053 (0.757)
Mean IMT 1 0.448 (< 0.001) 0.587 (0.001)
TPA 0.448 (< 0.001) 1 0.873 (< 0.001)
TPV 0.587 (0.001) 0.873 (< 0.001) 1
hs-CRP: high sensitivity C-reactive protein, IMT: intima media thickness, TPA: total plaque area, TPV: total plaque volume
0.4 0.6 0.8 1.0 1.2 1.4 1.6 1.8 2.0
CAG group
0 1 2 3
Mean IMT (mm)
A
0 1 2 3 4 5 6
CAG group
0 1 2 3
Log TPA (mm2)
B
2.0 2.5 3.5 3.0 4.0 4.5 5.5 5.0 6.0 6.5 7.0
CAG group
0 1 2 3
Log TPV (mm3 )
C
Fig. 4. Linear regression analysis among the mean carotid intima-media thickness (IMT) (A), total plaque area (TPA) (B), total plaque volume (TPV) (C), and the severity of the coronary artery disease (CAD). Although there was no significant association of IMT and the severity of CAD (group 0 having normal coronary arteries, group 1 with one vessel CAD, group 2 with two vessel CAD, and group 3 with three vessel CAD), TPA and TPV showed significant positive correlation with CAD severity (r = 0.340, p = 0.0003 for TPA and r = 0.465, p < 0.0001 for TPV). CAG: coronary angiography.
r = 0.593, p < 0.0001 r = 0.436, p < 0.0001
r = 0.186, p = 0.067
somewhat correlated, might represent distinct intermediate traits with unique determinants and risk factor associations.
The measurement of IMT as a surrogate marker for atheroscle- rosis is common in clinical practice. However, its accuracy has been questioned by the fact that the main predictors of medial hypertrophy or CCA intimal thickening are age and hyper- tension, which do not necessarily reflect the atherosclerotic process.22) In contrast, carotid plaque has been shown to be more closely related to CAD and to predict coronary events better than IMT.7)23) This is likely the result of carotid plaques predominantly occurring at sites of nonlaminar turbulent flow such as in the carotid bulb and the proximal ICA, but rarely in the CCA except in advanced atherosclerotic disease.24) As a measurement, IMT has the benefit of standardized acquisi- tion, but the rigorous standards for the appropriate anatomical site interrogated to derive this measurement may also exclude some important information about the atherosclerotic burden in the remainder of the carotid arterial bed. Thus, a thorough scan of all carotid arteries, including plaque assessment, may increase sensitivity for identifying subclinical vascular disease.
Table 4. Multivariate linear regression analysis of factors affecting carotid atherosclerotic burden in all participants
Univariate analysis Multivariate analysis
B (95% CI) R2 p-value B (95% CI) p-value
Age 0.007 (0.003 to 0.012) 0.074 0.003 0.007 (0.002 to 0.013) 0.043
Male sex 0.054 (-0.039 to 0.146) 0.012 0.254 0.112 (-0.027 to 0.251) 0.112
Current smoking 0.038 (-0.040 to 0.116) 0.011 0.332 0.013 (-0.048 to 0.074) 0.762
Diabetes mellitus 0.026 (-0.075 to 0.126) 0.016 0.616 0.015 (-0.107 to 0.137) 0.808
Hypertension 0.132 (0.071 to 0.193) 0.033 0.031 0.116 (0.045 to 0.187) 0.048
hs-CRP 0.000 (-0.002 to 0.001) 0.004 0.564 0.000 (-0.001 to 0.001) 0.576
Low density lipoprotein -0.001 (-0.002 to -0.000) 0.032 0.079 -0.008 (-0.010 to -0.006) 0.244 High density lipoprotein -0.003 (-0.007 to 0.001) 0.021 0.158 0.016 (0.002 to 0.030) 0.828 Mean Intima media thickness (R2 = 0.230, adjusted R2 = 0.121 in multivariate analysis)
Age 0.013 (0.006 to 0.020) 0.116 0.001 0.010 (0.001 to 0.020) 0.029
Male sex 0.152 (0.010 to 0.294) 0.041 0.036 0.011 (0.000 to 0.022) 0.050
Current smoking 0.040 (-0.064 to 0.144) 0.008 0.450 0.030 (-0.077 to 0.138) 0.740
Diabetes mellitus 0.092 (-0.065 to 0.249) 0.013 0.246 0.063 (-0.131 to 0.257) 0.522
Hypertension 0.189 (0.032 to 0.346) 0.052 0.019 0.197 (0.004 to 0.390) 0.046
hs-CRP 0.001 (-0.003 to 0.005) 0.003 0.616 -0.001 (-0.003 to 0.001) 0.330
Low density lipoprotein 0.003 (0.001 to 0.005) 0.029 0.021 0.002 (0.001 to 0.003) 0.042 High density lipoprotein -0.001 (-0.007 to 0.005) 0.001 0.724 -0.001 (-0.009 to 0.006) 0.386 Total plaque area (R2 = 0.308, adjusted R2 = 0.197 in multivariate analysis)
Age 0.007 (0.001 to 0.014) 0.122 0.024 0.008 (0.001 to 0.015) 0.028
Male sex 0.152 (0.010 to 0.294) 0.041 0.036 0.181 (0.014 to 0.348) 0.035
Current smoking 0.103 (0.000 to 0.205) 0.085 0.064 0.083 (0.000 to 0.166) 0.077
Diabetes mellitus 0.170 (0.024 to 0.315) 0.122 0.023 0.063 (-0.081 to 0.207) 0.380
Hypertension 0.060 (-0.091 to 0.212) 0.016 0.427 0.113 (-0.044 to 0.468) 0.154
hs-CRP 0.026 (0.005 to 0.047) 0.172 0.016 0.035 (0.009 to 0.060) 0.010
Low density lipoprotein 0.003 (0.000 to 0.006) 0.011 0.058 0.002 (0.000 to 0.004) 0.050 High density lipoprotein 0.000 (-0.006 to 0.007) 0.001 0.891 -0.002 (-0.010 to 0.006) 0.587 Total plaque volume (R2 = 0.593, adjusted R2 = 0.446 in multivariate analysis)
hs-CRP: high sensitivity C-reactive protein, CI: confidential interval
Fig. 5. Bland-Altman’s plot of the difference between plaque volume (PV) measured by 3-dimensional (3D) and 2-dimensional (2D) method. A solid horizontal line gives the mean difference of 4.8 mm3 and the dotted horizontal lines give the 95% limit of agreement from -171.8 to 181.5 mm3. The difference is calculated by subtracting 2D PV from the 3D PV. The 95% limit of agreement is drawn at mean difference plus and minus 1.96 times the standard deviation (SD) of the differences.
-400 -300 -200 -100 0 100 200 300 400
Average of 3D PV and 2D PV
0 100 200 300 400 500 600
3D PV-2D PV
+1.96 SD
-1.96 SD Mean 181.5
-171.8 4.8
According to our results, IMT was only significantly associ- ated with age and hypertension, confirming that IMT mainly represents hypertensive medial hypertrophy, or thickening of smooth muscles in the media.7) In contrast, TPA was signifi- cantly associated with age, male sex, hypertension, and LDL-C, and TPV was significantly associated with age, male sex, hs- CRP and LDL-C. This is likely due to carotid plaques repre- senting a later stage of atherogenesis related to inflammation, endothelial dysfunction, oxidative stress, and smooth muscle cell proliferation.21) Since age-related thickening of intimal and medial layers of CCA also occurs in the absence of overt athero- sclerosis, IMT is not really atherosclerosis, but instead represents an indicator for cardiovascular risk. In contrast, carotid plaques are a distinctive phenotype of atherosclerosis, not a simple con- tinuum of IMT progression, and they predict cardiovascular disease better than IMT.25) A recent meta-analysis provides further evidence that carotid plaque measurements are more strongly predictive of cardiovascular events than measurement of IMT.5)
However, the quantitative measurement of plaques is not standard practice for most Korean cardiologists, and the typical plaque description includes the number of individual plaques, the plaque thickness, and characterization of surrounding tissue, such as calcifications or various patterns of echogenicity. Accord- ingly, we tried to measure plaque burden as TPA and TPV ac- cording to the validated method in patients with well-estab- lished cardiovascular risk factors. While the simple correlations between IMT and plaque measurements were highly and statis- tically significant, the r-values between 0.4 and 0.6 indicated correlations that were only moderate. Conversely, there was a strong correlation between plaque measurement and both TPA and TPV, as large plaque measurements contribute to a large TPA and TPV, which is not always associated with in- creased IMT. Similarly, if there was only a long, slender plaque overlying the region used for IMT determination, the absence of other plaques contributed to low TPA and TPV for this in- dividual. Thus, IMT does not always reflect total carotid dis- ease burden. Additionally, we empirically measured plaque volume by the area-width method and compared these pa- rameters with plaque volume by 3D US, which were shown to have significant positive correlations. However, there seems to be large discrepancies in the values over 200 mm3 in Bland- Altman plot analysis, we think there would be some potential role for this calculation in the assessment of plaque volume in limited cases with CCA plaques.
Of course, we recognize that our study is somewhat limited by several factors, including a small sample size and a unique study sample from which the findings may not be generaliz- able. As this was the first attempt to measure plaque area or vol- ume in Korea, there would understandably be some technical limitations to plaque measurement. In our study, the golden standard of TPV was 3D US measurement and from our expe- rience, 3D assessment of PV in ICA plaque was more difficult
than CCA plaque because of angle, however, it was possible and feasibility of 3D PV is about 70-80%. However, for the assessment of 2D area-width PV, because we cannot achieve short axis view of ICA and bulb, ICA/bulb plaque could not be measured by this method, and feasibility of 2D PV is about 40-50%. So, it may have resulted in another level of impreci- sion. Moreover, it was difficult to define plaque border in cases with diffuse plaques connected by increased IMT. In these cas- es, we tried to measure the plaque border by defining plaque as suggested by Spence et al.4)7) Finally, we did not check TPV by another validated modality such as carotid CT angiography or magnetic resonance imaging. Despite this, we are confident that measurement of TPV by US would be more precise than the standard technique for measuring plaque thickness.
In conclusion, our results indicate that although there were significant correlations among the various ultrasound mea- sures of carotid artery morphology, there seemed to be differ- ent biological determinants on IMT, TPA, and TPV. This has implications for studies of determinants of atherosclerosis that utilize indirect surrogate markers determined noninvasively.
We might need to be selective about the particular measure- ments for specific applications.
• Acknowledgements
This study was supported by a grant from the Korean Society of Echocardio- graphy (Industrial-educational cooperation 2012).
References
1. O’Leary DH, Polak JF, Kronmal RA, Manolio TA, Burke GL, Wolfson SK Jr. Carotid-artery intima and media thickness as a risk fac- tor for myocardial infarction and stroke in older adults. Cardiovascular Health Study Collaborative Research Group. N Engl J Med 1999;340:
14-22.
2. Chambless LE, Heiss G, Folsom AR, Rosamond W, Szklo M, Shar- rett AR, Clegg LX. Association of coronary heart disease incidence with carotid arterial wall thickness and major risk factors: the Atherosclerosis Risk in Communities (ARIC) Study, 1987-1993. Am J Epidemiol 1997;
146:483-94.
3. Yoon HJ, Jeong MH, Kim KH, Ahn Y, Cho JG, Park JC, Kang JC, Bae JH. Carotid intima-media thickness, not carotid plaque, is associ- ated with large territory cerebral infarction in patients with ischemic stroke.
Korean Circ J 2010;40:272-6.
4. Spence JD, Eliasziw M, DiCicco M, Hackam DG, Galil R, Lohm- ann T. Carotid plaque area: a tool for targeting and evaluating vascular preventive therapy. Stroke 2002;33:2916-22.
5. Inaba Y, Chen JA, Bergmann SR. Carotid plaque, compared with carot- id intima-media thickness, more accurately predicts coronary artery disease events: a meta-analysis. Atherosclerosis 2012;220:128-33.
6. Wendelhag I, Wiklund O, Wikstrand J. On quantifying plaque size and intima-media thickness in carotid and femoral arteries. Comments on results from a prospective ultrasound study in patients with familial hyper- cholesterolemia. Arterioscler Thromb Vasc Biol 1996;16:843-50.
7. Spence JD. Technology Insight: ultrasound measurement of carotid plaque- -patient management, genetic research, and therapy evaluation. Nat Clin Pract Neurol 2006;2:611-9.
8. Spence JD, Malinow MR, Barnett PA, Marian AJ, Freeman D, Hegele RA. Plasma homocyst(e)ine concentration, but not MTHFR geno-
type, is associated with variation in carotid plaque area. Stroke 1999;30:
969-73.
9. Hegele RA, Ban MR, Anderson CM, Spence JD. Infection-susceptibil- ity alleles of mannose-binding lectin are associated with increased carotid plaque area. J Investig Med 2000;48:198-202.
10. Spence JD, Ban MR, Hegele RA. Lipoprotein lipase (LPL) gene varia- tion and progression of carotid artery plaque. Stroke 2003;34:1176-80.
11. Steinke W, Hennerici M. Three-dimensional ultrasound imaging of ca- rotid artery plaques. J Cardiovasc Technol 1989;8:15-22.
12. Delcker A, Diener HC. Quantification of atherosclerotic plaques in carot- id arteries by three-dimensional ultrasound. Br J Radiol 1994;67:672-8.
13. Palombo C, Kozakova M, Morizzo C, Andreuccetti F, Tondini A, Palchetti P, Mirra G, Parenti G, Pandian NG. Ultrafast three-dimen- sional ultrasound: application to carotid artery imaging. Stroke 1998;29:
1631-7.
14. Schminke U, Hilker L, Motsch L, Griewing B, Kessler C. Volumetric assessment of plaque progression with 3-dimensional ultrasonography under statin therapy. J Neuroimaging 2002;12:245-51.
15. Landry A, Fenster A. Theoretical and experimental quantification of ca- rotid plaque volume measurements made by three-dimensional ultrasound using test phantoms. Med Phys 2002;29:2319-27.
16. Landry A, Spence JD, Fenster A. Measurement of carotid plaque volume by 3-dimensional ultrasound. Stroke 2004;35:864-9.
17. Vermeersch SJ, Rietzschel ER, De Buyzere ML, Van Bortel LM, D’Asseler Y, Gillebert TC, Verdonck PR, Segers P. Validation of a new automated IMT measurement algorithm. J Hum Hypertens 2007;21:
976-8.
18. Touboul PJ, Hennerici MG, Meairs S, Adams H, Amarenco P, Bornstein N, Csiba L, Desvarieux M, Ebrahim S, Hernandez Her-
nandez R, Jaff M, Kownator S, Naqvi T, Prati P, Rundek T, Sitzer M, Schminke U, Tardif JC, Taylor A, Vicaut E, Woo KS. Mannheim carotid intima-media thickness and plaque consensus (2004-2006-2011).
An update on behalf of the advisory board of the 3rd, 4th and 5th watching the risk symposia, at the 13th, 15th and 20th European Stroke Conferences, Mannheim, Germany, 2004, Brussels, Belgium, 2006, and Hamburg, Germany, 2011. Cerebrovasc Dis 2012;34:290-6.
19. Egger M, Spence JD, Fenster A, Parraga G. Validation of 3D ultra- sound vessel wall volume: an imaging phenotype of carotid atherosclerosis.
Ultrasound Med Biol 2007;33:905-14.
20. Ludwig M, Zielinski T, Schremmer D, Stumpe KO. Reproducibility of 3-dimensional ultrasound readings of volume of carotid atherosclerotic plaque. Cardiovasc Ultrasound 2008;6:42.
21. Spence JD, Hegele RA. Noninvasive phenotypes of atherosclerosis: similar windows but different views. Stroke 2004;35:649-53.
22. Finn AV, Kolodgie FD, Virmani R. Correlation between carotid inti- mal/medial thickness and atherosclerosis: a point of view from pathology.
Arterioscler Thromb Vasc Biol 2010;30:177-81.
23. Brook RD, Bard RL, Patel S, Rubenfire M, Clarke NS, Kazerooni EA, Wakefield TW, Henke PK, Eagle KA. A negative carotid plaque area test is superior to other noninvasive atherosclerosis studies for reducing the likelihood of having underlying significant coronary artery disease. Arte- rioscler Thromb Vasc Biol 2006;26:656-62.
24. O’Leary DH, Bots ML. Imaging of atherosclerosis: carotid intima-media thickness. Eur Heart J 2010;31:1682-9.
25. Lorenz MW, Markus HS, Bots ML, Rosvall M, Sitzer M. Prediction of clinical cardiovascular events with carotid intima-media thickness: a sys- tematic review and meta-analysis. Circulation 2007;115:459-67.