D I A B E T E S & M E T A B O L I S M J O U R N A L
This is an Open Access article distributed under the terms of the Creative Commons At- tribution Non-Commercial License (http://creativecommons.org/licenses/by-nc/3.0/) which permits unrestricted non-commercial use, distribution, and reproduction in any medium, provided the original work is properly cited.
Assessment of the Association between Mean
Hemoglobin A1c Levels for 5 Years and Coronary Artery Disease by Coronary Angiography in
Nondiabetic Patients
Jae-Joon Kim1, Ji-Hoon Kang1, Ja-Jun Goo1, Kyoung-Nyoun Kim1, Ja-Young Lee1, Mi-kyung Kim2, Tae Ik Kim1
1Department of Internal Medicine, Maryknoll Medical Center, Busan,
2Department of Internal Medicine, Inje University College of Medicine, Busan, Korea
Background: The effects of glucose on cardiovascular events or mortality in nondiabetic patients has been recently reported.
However, since atherosclerosis can be formed over a long period of time, it is necessary to devote several years to unveil the rela- tionship between the two factors. Here, we attempted to find out the relationship between the mean hemoglobin A1c (HbA1c) level and HbA1c variability for 5 years and coronary artery disease (CAD) by using coronary angiography (CAG) to assess non- diabetic patients.
Methods: We reviewed patients who performed CAG who were followed up for at least 5 years after the initial diagnosis. The fasting blood test was performed annually for glucose and HbA1c level. CAD was defined as more than 50% of luminal narrow- ing. The severity of CAD was divided into two groups depending on whether no vessels were involved or one more vessel were involved (CAD(-) or CAD(+), respectively).
Results: The patients in CAD(+) group had higher mean HbA1c level for 5 years than CAD(-) group (5.71±0.40 vs. 5.86±0.68;
P=0.04). Mean HbA1c was a significant predictor for CAD in multiple regression (odds ratio, 2.224; P=0.028). The percentage of patients with CAD was significantly higher in patients with >6.2% of mean HbA1c levels compared to patients with <6.2% of mean HbA1c levels (P<0.019).
Conclusion: When the mean HbA1c levels were above 6.2%, the risk of CAD was higher. Also this study shows that HbA1c lev- el can be one of the predictors for CAD even if the patients do not have diabetes.
Keywords: Coronary artery disease; Hemoglobin A, glycosylated
Corresponding author: Mi-kyung Kim
Division of Endocrinology, Department of Internal Medicine,
Inje University Haeundae Paik Hospital, Inje University College of Medicine, 875 Haeun-daero, Haeundae-gu, Busan 612-862, Korea
INTRODUCTION
Diabetes is a well-known and an important risk factor for cor- onary artery disease (CAD) [1-6], but several studies have demonstrated the correlation between blood glucose levels and coronary atherosclerosis even in nondiabetic patients [7-12].
Hemoglobin A1c (HbA1c), which reflects the average plasma glucose level for the several months prior to examination, have been used in many epidemiology studies as a parameter for
glycemic control, and those studies reported the relationship between HbA1c and the chronic complications of diabetes [13,14]. Furthermore, increased levels of HbA1c are reported to be associated with the presence of coronary atherosclerosis and atherosclerosis burden [5]. In addition, few other studies have shown the relationship between HbA1c and atheroscle- rosis in nondiabetic patients [4,15-20].
It is well-known that it takes a long while until vessel chang- es by diseases such as atherosclerosis eventually cause a CAD.
http://dx.doi.org/10.4093/dmj.2014.38.1.58 pISSN 2233-6079 · eISSN 2233-6087
Previous studies that were conducted mainly focused on the HbA1c levels, but it failed to yield comprehensive results re- garding the effect of chronic changes of vessels, induced by atherosclerosis, on the glucose level. In addition, observing the fluctuations in the blood glucose level over prolonged periods have been emphasized these days over reading the HbA1c lev- el only once to represent the average glucose level for over sev- eral months. The authors of Diabetes Control and Complica- tions Trial study suggested the potential of HbA1c variability in diabetic complications to represent longer duration of glu- cose control. Their study showed that the possibility of associ- ation between HbA1c variability and chronic diabetic compli- cation including cardiovascular events and microvascular complications in type 1 diabetes [21,22].
In normal people, their glucose levels would not be constant even for one day and their glucose levels would be oscillating for several years. Thus, the HbA1c levels that are measured for 5 years and the degree of inconsistency would also be different.
In this study, we attempted to reveal the relationship between the mean HbA1c levels for over 5 years and its variability dur- ing that time and coronary atherosclerosis in nondiabetic pa- tients.
METHODS
This study was performed in a retrospective manner, based on chart review. The data, collected by the cardiology department of Maryknoll Medical Center, regarding the patients who have conducted coronary angiography (CAG) since 2004 was used in this study. The systolic and diastolic blood pressure of these patients were checked every clinic visit according to the prin- ciples for baseline assessment which was set up by the depart- ment. The patients underwent fasting blood test including rou- tine complete blood count liver function test, kidney function, and lipid profile at least once a year. Their fasting glucose and HbA1c levels were monitored every year as a screening test for diabetes mellitus. Inclusion criteria of our study was that the subjects must have performed CAG due to chest pain and had been followed up in our institute for at least 5 years before the final CAG. CAG was taken when the patients had typical an- gina chest pain and also atypical chest pain for differential di- agnosis. The subjects with known diabetes and diagnosed as diabetes during follow-up based on fasting blood sugar >126 or HbA1c >6.5% were excluded. The patients who had mea- sured their HbA1c level at least three times during the follow-
up period were elected. The final 211 patients who were select- ed did not have a history of diabetes mellitus or any biochemi- cal evidence. The mean HbA1c was calculated, and the HbA1c variability assessed by standard deviation (SD) of HbA1c lev- els for 5 years. HbA1c at CAG is the serum HbA1c levels mea- sured at the time CAG was performed. CAD was defined as the presence of one or more lesions of more than 50% luminal narrowing in the coronary artery. Our data were analyzed with the SPSS version 18 (IBM Co., Armonk, NY, USA). Compari- son of multiple factors between groups divided by CAD was performed by Student t-tests. Logistic regression analysis of CAD with the variables was performed. The proportion of pa- tients who had CAD among the groups divided by the mean HbA1c were analyzed with the chi-square test. P value less than 0.05 was considered as statistically significant. HbA1c was measured by ion exchange high performance liquid chro- matography using Variant II (Bio-Rad, Hercules, CA, USA).
RESULTS
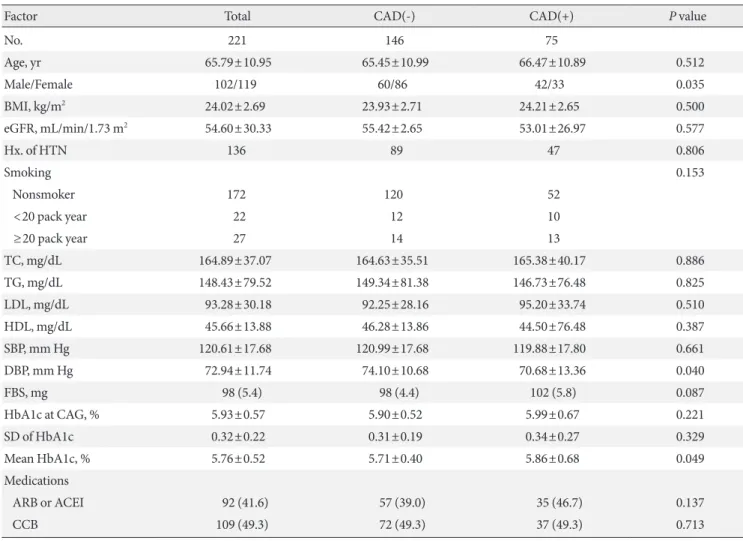
The mean age of our subjects was 65.79±10.95 years, of which 102 of the subjects were male. BMI was 24.02±2.69 kg/m2, and estimated glomerular filtration rate (eGFR) was 54.60±30.33 mL/min/1.73 m2. HbA1c at the time of CAG was 5.93%±0.57%, SD of serial HbA1c level for 5 years was 0.32±0.22, and the mean HbA1c for 5 years was 5.76%±0.52% (Table 1). We di- vided the subjects into three groups by smoking history. With- in these groups, 172 patients were in the nonsmoker group, 22 patients in 1 to 20 pack year group, and 27 patients were in the above 20 pack year group. We also divided the patients into two groups based on the presence or absence of CAD. Interesting- ly, the percentages of patients in each groups that were divided by smoking history were not different between the CAD(-) and CAD(+) group (Table 1). Between the two groups, the mean systolic blood pressure was not significantly different, but the diastolic blood pressure was significantly lower in the CAD(+) group compared to the CAD(-) group (70.68±13.36 mm Hg vs. 74.10±10.68 mm Hg). Other characteristics including age, percentage of male, BMI, eGFR, and lipid profiles were not significantly different between the CAD(-) and CAD(+) groups.
In addition, neither the HbA1c level at the time when CAG was taken (5.90%±0.52% in CAD(-) group and 5.99%±0.67% in CAD(+) group) nor its SD showed any significant difference.
However, the mean of HbA1c for 5 years in CAD(+) group was significantly higher than CAD(-) group (5.86%±0.86% vs.
5.71%±0.40%; P=0.049) (Table 1). With these result, the pa- tients were divided into four groups: <5.7%; ≥5.7% and <6.0%;
≥6.0% and <6.2%; ≥6.2% and <6.5% of HbA1c for 5 years.
Further analysis with the new groups showed that the percent- age of patients with CAD was significantly higher in patients with mean HbA1c levels between 6.2% and 6.5% compared to other groups (P<0.019). On the other hand, other groups did not show any difference in the percentage of CAD(+) patients (Fig. 1). Male sex, total cholesterol, LDL cholesterol, and mean HbA1c were the independent predictors for CAD in nondia- betic patients who were adjusted by age, BMI, blood pressure, HbA1c at CAG, and SD of HbA1c (Table 2).
Table 1. Comparison of risk factors between groups divided by the presence of coronary artery disease
Factor Total CAD(-) CAD(+) P value
No. 221 146 75
Age, yr 65.79±10.95 65.45±10.99 66.47±10.89 0.512
Male/Female 102/119 60/86 42/33 0.035
BMI, kg/m2 24.02±2.69 23.93±2.71 24.21±2.65 0.500
eGFR, mL/min/1.73 m2 54.60±30.33 55.42±2.65 53.01±26.97 0.577
Hx. of HTN 136 89 47 0.806
Smoking 0.153
Nonsmoker 172 120 52
<20 pack year 22 12 10
≥20 pack year 27 14 13
TC, mg/dL 164.89±37.07 164.63±35.51 165.38±40.17 0.886
TG, mg/dL 148.43±79.52 149.34±81.38 146.73±76.48 0.825
LDL, mg/dL 93.28±30.18 92.25±28.16 95.20±33.74 0.510
HDL, mg/dL 45.66±13.88 46.28±13.86 44.50±76.48 0.387
SBP, mm Hg 120.61±17.68 120.99±17.68 119.88±17.80 0.661
DBP, mm Hg 72.94±11.74 74.10±10.68 70.68±13.36 0.040
FBS, mg 98 (5.4) 98 (4.4) 102 (5.8) 0.087
HbA1c at CAG, % 5.93±0.57 5.90±0.52 5.99±0.67 0.221
SD of HbA1c 0.32±0.22 0.31±0.19 0.34±0.27 0.329
Mean HbA1c, % 5.76±0.52 5.71±0.40 5.86±0.68 0.049
Medications
ARB or ACEI 92 (41.6) 57 (39.0) 35 (46.7) 0.137
CCB 109 (49.3) 72 (49.3) 37 (49.3) 0.713
Values are presented as number, mean±standard deviation, or number (%).
CAD, coronary artery disease; BMI, body mass index; eGFR, estimated glomerular filtration rate; Hx. of HTN, history of hypertension; TC, to- tal cholesterol; TG, triglyceride; LDL, low density lipoprotein; HDL, high density lipoprotein; SBP, systolic blood pressure; DBP, diastolic blood pressure; FBS, fasting blood sugar; HbA1c, hemoglobin A1c; CAG, coronary angiography; SD, standard deviation; ARB, angiotensin II recep- tor blocker; ACEI, angiotensin converting enzyme inhibitor; CCB, calcium channel blocker.
Fig. 1. The percentage of patients with coronary artery disease in groups divided by the mean hemoglobin A1c (HbA1c) levels.
60 50 40 30 20 10 ts we percentage of patienThith rterassey die (%)ry anaroco 0
5.7–6.0 6.0–6.2 6.2–6.5
HbA1c mean (%)
DISCUSSION
Our study showed that higher mean HbA1c levels for 5 years might be related to CAD even in nondiabetic subjects. In our study, the mean HbA1c levels taken over the previous 5 years were better predictors for coronary atherosclerosis than the HbA1c levels measured at the time CAG was taken. For several years now, a few reports have studied the relationship between HbA1c and atherosclerosis in nondiabetic patients. Moreover, one study followed up on older, nondiabetic adults for 8 years to elucidate the relations between HbA1c, fasting plasma glu- cose, postchallenge plasma glucose, and mortality from car- diovascular disease (CVD) and ischemic heart disease (IHD) [4]. The authors concluded that the highest quartile of HbA1c (≥6.7%) is a predictor for CVD and IHD mortality in women without diabetes, but not in men. In addition, another study concluded that increased levels of HbA1c in asymptomatic in- dividuals without diabetes are associated with the presence of coronary atherosclerosis where a burden of mixed coronary plaques gathers [8]. Additionally, accumulating evidence sug- gested high levels of HbA1c as an indicator of significantly in- creased risk for ischemic stroke in nondiabetic male adult and presented HbA1c as a potential predictive factor for even those
in the nondiabetic range [15,23].
When we divided the patients into four groups according to their mean HbA1c levels for 5 years, the patients with a mean HbA1c value of ≥6.2% showed a significantly increased percent- age of CAD(+) patients compared to those with lower HbA1c levels. It has been well known that prediabetes is also a risk factor for cardiovascular pathologies like diabetes [12,24,25].
However, fasting hyperglycemia and postprandial hyperglyce- mia, so called impaired fasting glucose and impaired glucose tolerance, which are better predictors for cardiovascular event are largely debated [11,12]. More studies suggested that post- prandial hyperglycemia is a better predictor or even the only predictor for risk of CVD [4,16]. However, in our study, the postprandial glucose levels were not taken as there are difficul- ties in measuring the exact postmeal glucose level in clinical practice. Nevertheless, our results indicated that the mean HbA1c levels for 5 years were related to CAD, but not fasting glucose levels. It has been reported that the postprandial glu- cose level is elevated in earlier stages than fasting glucose levels in the natural course of type 2 diabetes. Although HbA1c is the average glucose levels including fasting and postprandial glucose levels, the contribution of postprandial glucose is big- ger than fasting glucose in lower HbA1c levels. Considering Table 2. Predictors for coronary artery disease in nondiabetic patients analyzed by multiple logistic regression
B SE P value Odds ratio 95% CI for EXP (B)
Lower limit Upper limit
Age, yr -0.001 0.017 0.937 0.999 0.966 1.033
Male sex 0.087 0.004 0.027 1.465 1.211 1.651
Smoker 0.042 0.011 0.098 1.155 0.998 1.224
BMI, kg/m2 0.022 0.071 0.754 1.022 0.889 1.175
TC, mg/dL -0.030 0.014 0.032 0.971 0.944 0.997
LDL, mg/dL 0.032 0.015 0.032 1.032 1.003 1.063
TG, mg/dL 0.005 0.003 0.100 1.005 0.999 1.010
HDL, mg/dL 0.011 0.015 0.468 1.011 0.981 1.042
SBP, mm Hg 0.000 0.015 0.989 1.000 0.972 1.029
DBP, mm Hg -0.023 0.025 0.356 0.977 0.929 1.027
SD of HbA1c 0.919 1.027 0.370 1.508 0.335 2.755
HbA1c at CAG, % -0.950 0.667 0.154 0.387 0.105 1.430
Mean HbA1c 1.653 0.753 0.028 2.224 1.195 3.841
B, the coefficient for the constant; SE, the standard error around the coefficient for the constant; CI, confidence interval; EXP, the exponentia- tion of the B coefficient, which is an odds ratio; BMI, body mass index; TC, total cholesterol; LDL, low density lipoprotein; TG, triglyceride;
HDL, high density lipoprotein; SBP, systolic blood pressure; DBP, diastolic blood pressure; SD, standard deviation; HbA1c, hemoglobin A1c;
CAG, coronary angiography.
such knowledge, our results which demonstrate the correla- tion between HbA1c and CAD but not with fasting glucose may be consistent to the previous findings in other studies. The reason why the already known risk factors for CAD such as age and blood pressure did not act as predictors in our study is not clear. One possible explanation might be the small num- bers of our study subjects due to our selection criteria. As a re- sult, the age was higher in CAD(+), although not significant.
Also, the blood pressures were well-controlled in our study, perhaps preventing it from acting as a predictor.
There are some reports that suggest the variability of HbA1c as a risk factor for diabetic complications. Oscillating glucose levels can lead to endothelial dysfunction and more oxidative stress, which can be more deleterious than a constantly high glucose level [26]. Kilpatrick et al. [21] reported that the vari- ability of HbA1c can be used to predict the complications in type 1 diabetes. Furthermore, it is known to be an important risk factor for all cause mortality in type 2 diabetic patients [27].
We also attempted to elucidate the relationship between HbA1c variability and coronary atherosclerosis in nondiabetic patients, but in our study the HbA1c variability did not show any differ- ence between the CAD(+) and CAD(-) groups and was not even a predictor for CAD. We suspect that this could be because HbA1c variability was represented as SD, which was very small in lower HbA1c levels of nondiabetic patients.
Our study has several limitations. First, the subjects in our study were enrolled from a single center. Second, this study is an observational study, not a randomized controlled study. Here, CAD was defined as the presence of one or more lesions of more than 50% luminal narrowing in coronary artery. Yet, the degree of CAD was not separated, and to confirm the diagno- sis for diabetes mellitus, we should have performed a 75 g oral glucose tolerance test (OGTT). However, OGTT is not conve- nient because patients must drink uncomfortable test liquid and wait for 2 hours. So, we used fasting glucose level and HbA1c to screen for diabetes. However, because the cholesterol vari- ability for 5 years was not checked, it is impossible to tell if cholesterol changes may also affect coronary atherosclerosis.
In conclusion, our study showed that the mean HbA1c lev- els for 5 years may be a significant predictor for CAD even in patients that are not diagnosed with diabetes, but HbA1c lev- els measured at the time of CAG and the HbA1c variability for 5 years are not suitable.
CONFLICTS OF INTEREST
No potential conflict of interest relevant to this article was re- ported.
REFERENCES
1. Haffner SJ, Cassells H. Hyperglycemia as a cardiovascular risk factor. Am J Med 2003;115 Suppl 8A:6S-11S.
2. Haffner SM, Lehto S, Ronnemaa T, Pyorala K, Laakso M. Mor- tality from coronary heart disease in subjects with type 2 dia- betes and in nondiabetic subjects with and without prior myo- cardial infarction. N Engl J Med 1998;339:229-34.
3. Meigs JB, Larson MG, D’Agostino RB, Levy D, Clouse ME, Nathan DM, Wilson PW, O’Donnell CJ. Coronary artery calci- fication in type 2 diabetes and insulin resistance: the Framing- ham Offspring Study. Diabetes Care 2002;25:1313-9.
4. Meigs JB, Nathan DM, D’Agostino RB Sr., Wilson PW; Fram- ingham Offspring Study. Fasting and postchallenge glycemia and cardiovascular disease risk: the Framingham Offspring Study. Diabetes Care 2002;25:1845-50.
5. Wei M, Gaskill SP, Haffner SM, Stern MP. Effects of diabetes and level of glycemia on all-cause and cardiovascular mortality.
The San Antonio Heart Study. Diabetes Care 1998;21:1167-72.
6. Carr ME. Diabetes mellitus: a hypercoagulable state. J Diabetes Complications 2001;15:44-54.
7. Nielson C, Lange T, Hadjokas N. Blood glucose and coronary artery disease in nondiabetic patients. Diabetes Care 2006;29:
998-1001.
8. Rivera JJ, Choi EK, Yoon YE, Chun EJ, Choi SI, Nasir K, Bran- cati FL, Blumenthal RS, Chang HJ. Association between increas- ing levels of hemoglobin A1c and coronary atherosclerosis in asymptomatic individuals without diabetes mellitus. Coron Ar- tery Dis 2010;21:157-63.
9. Balkau B, Shipley M, Jarrett RJ, Pyorala K, Pyorala M, Forhan A, Eschwege E. High blood glucose concentration is a risk fac- tor for mortality in middle-aged nondiabetic men: 20-year fol- low-up in the Whitehall Study, the Paris Prospective Study, and the Helsinki Policemen Study. Diabetes Care 1998;21:360-7.
10. Nasir K, Santos RD, Tufail K, Rivera J, Carvalho JA, Meneghel- lo R, Brady TD, Blumenthal RS. High-normal fasting blood glucose in non-diabetic range is associated with increased cor- onary artery calcium burden in asymptomatic men. Athero- sclerosis 2007;195:e155-60.
11. Levitan EB, Song Y, Ford ES, Liu S. Is nondiabetic hyperglyce-
mia a risk factor for cardiovascular disease? A meta-analysis of prospective studies. Arch Intern Med 2004;164:2147-55.
12. Hashimoto K, Ikewaki K, Yagi H, Nagasawa H, Imamoto S, Shibata T, Mochizuki S. Glucose intolerance is common in Japanese patients with acute coronary syndrome who were not previously diagnosed with diabetes. Diabetes Care 2005;28:
1182-6.
13. The Diabetes Control and Complications Trial Research Group.
The effect of intensive treatment of diabetes on the develop- ment and progression of long-term complications in insulin- dependent diabetes mellitus. N Engl J Med 1993;329:977-86.
14. UK Prospective Diabetes Study (UKPDS) Group. Intensive blood-glucose control with sulphonylureas or insulin com- pared with conventional treatment and risk of complications in patients with type 2 diabetes (UKPDS 33). UK Prospective Diabetes Study (UKPDS) Group. Lancet 1998;352:837-53.
15. Sander D, Schulze-Horn C, Bickel H, Gnahn H, Bartels E, Conrad B. Combined effects of hemoglobin A1c and C-reac- tive protein on the progression of subclinical carotid athero- sclerosis: the INVADE study. Stroke 2006;37:351-7.
16. Park S, Barrett-Connor E, Wingard DL, Shan J, Edelstein S.
GHb is a better predictor of cardiovascular disease than fasting or postchallenge plasma glucose in women without diabetes.
The Rancho Bernardo Study. Diabetes Care 1996;19:450-6.
17. Norhammar A, Tenerz A, Nilsson G, Hamsten A, Efendic S, Ryden L, Malmberg K. Glucose metabolism in patients with acute myocardial infarction and no previous diagnosis of dia- betes mellitus: a prospective study. Lancet 2002;359:2140-4.
18. Blake GJ, Pradhan AD, Manson JE, Williams GR, Buring J, Ridker PM, Glynn RJ. Hemoglobin A1c level and future car- diovascular events among women. Arch Intern Med 2004;164:
757-61.
19. Oh HG, Rhee EJ, Kim TW, Lee KB, Park JH, Yang KI, Jeong D, Park HK. Higher glycated hemoglobin level is associated with increased risk for ischemic stroke in non-diabetic Korean male adults. Diabetes Metab J 2011;35:551-7.
20. Khaw KT, Wareham N, Bingham S, Luben R, Welch A, Day N.
Association of hemoglobin A1c with cardiovascular disease and mortality in adults: the European prospective investiga- tion into cancer in Norfolk. Ann Intern Med 2004;141:413-20.
21. Kilpatrick ES, Rigby AS, Atkin SL. A1C variability and the risk of microvascular complications in type 1 diabetes: data from the Diabetes Control and Complications Trial. Diabetes Care 2008;31:2198-202.
22. Waden J, Forsblom C, Thorn LM, Gordin D, Saraheimo M, Groop PH; Finnish Diabetic Nephropathy Study Group. A1C variability predicts incident cardiovascular events, microalbu- minuria, and overt diabetic nephropathy in patients with type 1 diabetes. Diabetes 2009;58:2649-55.
23. Bjornholt JV, Erikssen G, Aaser E, Sandvik L, Nitter-Hauge S, Jervell J, Erikssen J, Thaulow E. Fasting blood glucose: an un- derestimated risk factor for cardiovascular death. Results from a 22-year follow-up of healthy nondiabetic men. Diabetes Care 1999;22:45-9.
24. Tominaga M, Eguchi H, Manaka H, Igarashi K, Kato T, Seki- kawa A. Impaired glucose tolerance is a risk factor for cardio- vascular disease, but not impaired fasting glucose. The Funa- gata Diabetes Study. Diabetes Care 1999;22:920-4.
25. Blake DR, Meigs JB, Muller DC, Najjar SS, Andres R, Nathan DM. Impaired glucose tolerance, but not impaired fasting glu- cose, is associated with increased levels of coronary heart dis- ease risk factors: results from the Baltimore Longitudinal Study on Aging. Diabetes 2004;53:2095-100.
26. Ceriello A, Esposito K, Piconi L, Ihnat MA, Thorpe JE, Testa R, Boemi M, Giugliano D. Oscillating glucose is more deleterious to endothelial function and oxidative stress than mean glucose in normal and type 2 diabetic patients. Diabetes 2008;57:1349- 54.
27. Ma WY, Li HY, Pei D, Hsia TL, Lu KC, Tsai LY, Wei JN, Su CC.
Variability in hemoglobin A1c predicts all-cause mortality in patients with type 2 diabetes. J Diabetes Complications 2012;
26:296-300.