Korean Circulation Journal
Introduction
Both exercise testing and corrected QT (QTc) have been used for detecting heart disease in routine clinical practice. The diagnostic value of QT prolongation at rest in predicting cardiovascular disease and mortality has been well established.1) Normally, both QT and RR
Print ISSN 1738-5520 • On-line ISSN 1738-5555
Maximal Exercise-Corrected QT as a Predictor
of Coronary Artery Disease: Comparison of Simpler Heart Rate Corrections
Aydın Akyuz, MD, Seref Alpsoy, MD, Dursun Cayan Akkoyun, MD, Hasan Degirmenci, MD, and Niyazi Guler, MD
Department of Cardiology, Namık Kemal University Medical School, Tekirdag, Turkey
Background and Objectives: The relationship between QT prolongation and myocardial ischemia is widely known. Due to the limited value of ST depression, we aimed to evaluate, by using four simpler heart rate corrections (Bazett, Framingham, Fridericia and Hodges), the value of maximal exercise-QTc prolongation in the diagnosis of coronary artery disease (CAD) presence and severity.
Subjects and Methods: We enrolled 234 subjects (mean age 57.3±9 years, 143 men) who had undergone exercise testing and coronary angiography due to a suspicion of CAD in the study. Evaluating CAD severity with Gensini scoring, the CAD group (n=122) and controls with non-CAD were compared in terms of corrected QT duration at maximal exercise.
Results: Age, gender, hypertension, dyslipidemia, smoking, exercise duration, resting, and peak heart rate were similar between the two groups (all p>0.05). The CAD group had higher raw QT values than the controls {268 (169-438) vs. 240 (168-348), p<0.001}. Although Fra- mingham QTc of ≥350 ms and Fridericia QTc of ≥340 ms were seen to be useful for the diagnosis of CAD, there was no additive diagnostic value of exercise QTc in addition to ST depression. Maximal exercise-QTc Bazett (r=0.163, p=0.01), Framingham (r=0.239, p=0.001), and Fri- dericia (r=0.206, p=0.001) equations were weakly positively correlated with Gensini scoring.
Conclusion: The patients with CAD have longer QTc intervals at peak heart rates during exercise. This finding provides insufficient evid- ence to support routine incorporation of QTc at peak heart rates into exercise test interpretation. (Korean Circ J 2013;43:655-663) KEY WORDS: Coronary artery disease; Corrected QT; Exercise test.
Received: June 20, 2013 Revision Received: July 19, 2013 Accepted: August 29, 2013
Correspondence: Aydın Akyuz, MD, Department of Cardiology, Namık Ke- mal University Medical School, Hurriyet Mahallesi Sehit Gökmen Yavuz Caddesi 2/1 kat: 4 Daire: 11 Tekirdag, Turkey
Tel: 90-5424116550, Fax: 90-2822626810 E-mail: [email protected]
• The authors have no financial conflicts of interest.
This is an Open Access article distributed under the terms of the Creative Commons Attribution Non-Commercial License (http://creativecommons.
org/licenses/by-nc/3.0) which permits unrestricted non-commercial use, distribution, and reproduction in any medium, provided the original work is properly cited.
intervals shorten with exercise due to parasympathetic withdrawal and sympathetic activation.2)3) In particular, during the period from rest to exercise, the relationship between QT and RR intervals is com- plex, due to the fact that QT fails to shorten while the heart rate in- creases. QT-RR dynamics are affected by age, ischemia, exercise, sex, diabetes mellitus (DM), smoking, and antiarrhytmics drugs, as well as genotypic differences concerning the structure and function of repolarization channels.4)5)
Many formulae, such as logarithmic (Ashman), hyperbolic, linear (Framingham, Hodges, Rautaharju PM), log-linear, and non-linear (Bazett, Fridericia) functions, have been proposed to correct for the heart rate effects on QT interval.6-10) Because most of them tend to be imprecise in detecting the exact QT interval at differing heart ra- tes, the linear regression function, which uses rate correction fac- tors, has been recently proposed.10)
Although ST-segment depression is the most commonly used cri- terion for the detection of coronary artery disease (CAD), its sensi- tivity and specificity during exercise testing is about 65% and 84%, respectively.11) Thus, to obtain better electrocardiogram (ECG) analy-
sis during exercise, some investigators focused on QT changes and, consequently, an increased QT dispersion of ≥70 ms during the exer- cise has been proposed as a predictor of CAD.12)13) Although the as- sociation of both CAD and increased QTc is a well-known synergis- tic risk factor of sudden cardiac death,14) no study thus far has in- vestigated the QTc response in terms of simpler heart rate correction formulae to maximal exercise to predict CAD. Thus, we aimed to as- sess the QTc interval by using the formulae of Bazett, Fridericia, Fra- mingham, and Hodges at maximal exercise to predict the presence and severity of CAD.
Subjects and Methods
Study participants
The study prospectively investigated 234 consecutive subjects (mean age 57.3±9 years; 91 women aged 56.8±9 years, range 36- 73 years; 143 men aged 58±9.5 years, range 34-74 years) who re- quired exercise stress testing due to a suspicion of CAD. The first group, the CAD group, was composed of 122 CAD patients with an abnormal exercise test (48 female and 74 male, mean age 55.5±9.1 years). The second group, the control group, was composed of 112 non-CAD subjects with an abnormal exercise test (43 female and 69 male, mean age 54.9±8.6). All subjects had a normal resting 12 lead normal ECG and no history of cardiovascular disease. Through- out the study, the subjects were not allowed to take medication known to affect cardiac repolarisation, such as beta-blockers, calci- um antagonist, or other antiarrhytmics. The exclusion criteria for both groups were as follows: atrial fibrillation or flutter, previous myocardial infarction, congestive heart failure, chronic obstructive or other pulmonary diseases, any systemic disease, poor neuromus- cular capability, and moderate to severe valvular disease. The study was approved by the local ethics committee. All participants pro- vided informed consent.
Exercise test and QT analysis
The Bruce protocol was used for the treadmill exercise testing.
85% of the age-predicted heart rate was considered the main tar- get heart rate. Exercise was continued until the occurrence of ST de- pression, angina pectoris, dyspnea, and palpitations or exhaustion.
During the study, 12-lead ECGs were digitally recorded continuously at 500 Hz using the CardioSoft exercise ECG system, which has on- screen computer-driven calipers (version 4.14, GE Healthcare, Frei- burg, Germany). At least 1 mm or higher horizontal or downsloping ST-segment depression 80 ms after the J point was considered ab- normal. All stored ECG results, using the standard 12-lead ECG trac- ing at 50 mm/s paper speed at 10 mm/mV amplitude, were ana- lyzed offline.
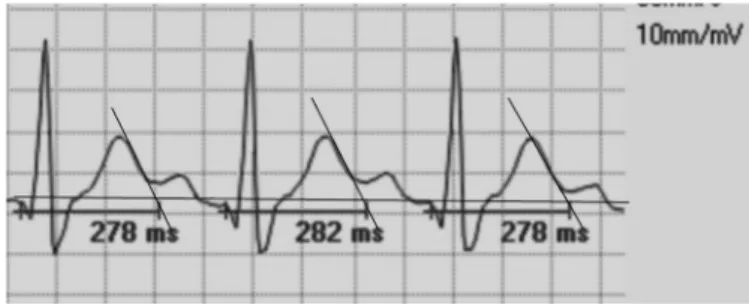
Measurements were taken by two cardiologists. To determine the raw QT interval, the lead DII and V 5 of each ECG was used be- cause its large-amplitude T wave permitted was sufficiently reliable to determine the end of the T wave as described previously.15) We used a mean value of leads DII and V 5 derived from at least 3 car- diac cycles (heartbeats) and measured from the beginning of the earliest onset of the QRS complex to the end of the T wave. When the T and U waves were close together, we identified the end of the T wave as the point at which its descending limb returns to the TP baseline. When the end of the T waves did not cross the isoelec- tric line, we determined the end of the T wave by the slope method, wherein it is defined by the intersection point between the tangent drawn at the maximum downslope of the T wave and the isoelectric line (Fig. 1). We did not include cases that had a biphasic T wave or those in which we could not determine an isoelectric line between the T and P wave at the maximal exercise ECG due to ECG artefacts.
The corrected QT was calculated using the following formulae; Ba- zett’s formula QTc=QT/RR1/2, Framingham QTc=QT+0.154 (1-RR), Fridericia formula QTc=QT/RR1/3, and Hodges QTc=QT+0.175 {hazard ratio (HR)-60}, respectively.6-9)
Angiographic assessment
Selective coronary angiography (Integris, Philips Medical Systems, Eindhoven, the Netherlands) was carried out using the Judkins tech- nique through femoral artery access within a maximum of 90 days from the exercise test. The angiographic characteristics were ob- tained from multiple views for both the left and right coronary ar- teries. The coronary artery was considered diseased if stenosis in a major epicardial coronary artery was ≥50% in diameter. The Gensi- ni scoring system was used to calculate the severity of CAD.16) The degree of coronary artery stenosis was evaluated according to the consensus opinion of three experienced interventional cardiologists.
Statistical analysis
All data were analyzed using the Statistical Package for the Social Sciences (SPSS) version 17 (SPSS Inc., Chicago, IL, USA) software pa- ckage. Data were expressed as mean±standard deviation and me-
Fig. 1. Illustrates the representative example of exercise raw QT measure- ment at 50 mm/s paper speed.
dian (minimum-maximum) values for normal and abnormal distribu- tion, respectively. Categorical data such as gender, diabetes, hyper- tension, and smoking were denoted as count and percentages, and were compared using the chi-square test. Following a checking of the variables using the Kolmogorov-Smirnov normality test, the mean differences for continuous variables between the two groups were examined by the unpaired Student t-test and the Mann-Whit- ney U test. After the categorization of QTc values, a chi-square test was performed to compare categorical variables such as gender, hy- pertension, smoking, diabetes, and the number of coronary artery involvement. Additionally, a paired t-test and Wilcoxon signed rank nonparametric test for paired data were used to compare the dif- ferences between the two study groups’ pretest and maximal exer- cise QTc values. Receiver operating characteristic (ROC) curve analy- sis was performed to identify the optimal cut-off value of the QTc at maximal exercise for the prediction of CAD. A Pearson correlation analysis was used to investigate whether there was a correlation between various QTc formulae and CAD presence and severity. Uni- variate and multivariate linear regression analysis was used to pre- dict the variables affecting exercise QTc prolongation. A p of less than 0.05 was accepted as statistically significant.
Reliability
Intraobserver and interobserver variability of QT measurements were assessed by averaging three consecutive QT intervals in lead DII
and V 5 from 30 randomly selected ECGs. After the measurer was masked to the previous results, the same ECGs were remeasured in random order. The reliability of intraobserver variability was tested using the paired t-test. For interobserver comparisons, a second in- vestigator was blinded to the results of the first investigator. The reliability of interobserver variability was tested using the Student t-test.
Results
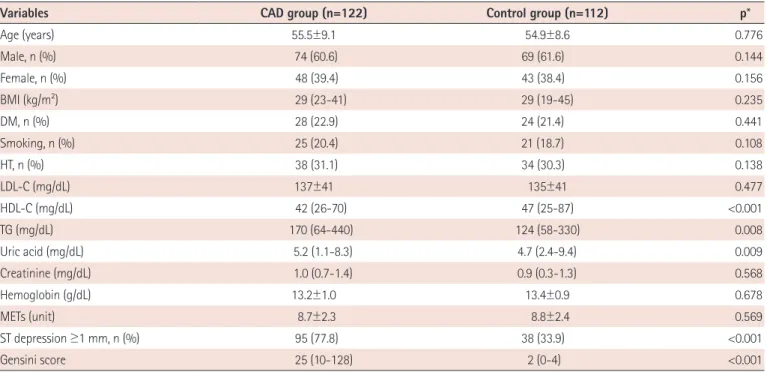
Demographic, clinical characteristics, and exercise electrocardio- graphic findings of the two groups are shown in Table 1 and 2. There was no difference between the two groups in terms of age, gender, body mass index (BMI), DM, smoking, and hypertension. ST depres- sion of ≥1 mm {n=95 (77.8%) vs. n=38 (33.9%), p<0.001}, Gensi- ni scoring {25 (10-128) vs. 2 (0-4), p<0.001}, triglyceride (TG) {170 (64-440) vs. 124 (58-330), p=0.008} and uric acid {5.2 (1.1-8.3) vs.
4.7 (2.4-9.4), p=0.009} were higher, and high density lipoprotein- cholesterol (HDL-C) {42 (26-70) vs. 47 (25-87), p<0.001} was lower in the CAD group than in the control group. There were no signifi- cant differences with respect to fasting glucose, haemoglobin, se- rum creatinine, low density lipoprotein-cholesterol, or exercise test METs (metabolic equivalents) values (all p>0.05) (Table 1).
Resting HR, raw QT interval, QTc formulae results during maximal exercise, systolic, and diastolic blood pressure (BP) in the pretest ex-
Table 1. Baseline characteristics, biochemical results, and Gensini scoring for both groups
Variables CAD group (n=122) Control group (n=112) p*
Age (years) 55.5±9.1 54.9±8.6 0.776
Male, n (%) 74 (60.6) 69 (61.6) 0.144
Female, n (%) 48 (39.4) 43 (38.4) 0.156
BMI (kg/m2) 29 (23-41) 29 (19-45) 0.235
DM, n (%) 28 (22.9) 24 (21.4) 0.441
Smoking, n (%) 25 (20.4) 21 (18.7) 0.108
HT, n (%) 38 (31.1) 34 (30.3) 0.138
LDL-C (mg/dL) 137±41 135±41 0.477
HDL-C (mg/dL) 42 (26-70) 47 (25-87) <0.001
TG (mg/dL) 170 (64-440) 124 (58-330) 0.008
Uric acid (mg/dL) 5.2 (1.1-8.3) 4.7 (2.4-9.4) 0.009
Creatinine (mg/dL) 1.0 (0.7-1.4) 0.9 (0.3-1.3) 0.568
Hemoglobin (g/dL) 13.2±1.0 13.4±0.9 0.678
METs (unit) 8.7±2.3 8.8±2.4 0.569
ST depression ≥1 mm, n (%) 95 (77.8) 38 (33.9) <0.001
Gensini score 25 (10-128) 2 (0-4) <0.001
Data are presented as mean±SD, median (minimum-maximum) values and number/percentage. *Chi-square, Mann-Whitney U test and unpaired Student’s t-tests. BMI: body mass index, CAD: coronary artery diseases, DM: diabetes mellitus, HT: hypertension, LDL-C: low density lipoprotein-cholesterol, METs:
peak metabolic equivalents of exercise test, TG: triglyceride, HDL-C: high density lipoprotein-cholesterol
ercise, and peak HR, the mean maximal exercise METs values, achievement time from resting HR to peak HR, systolic, and diastolic BP in maximal exercise were similar in the two groups (all p>0.05).
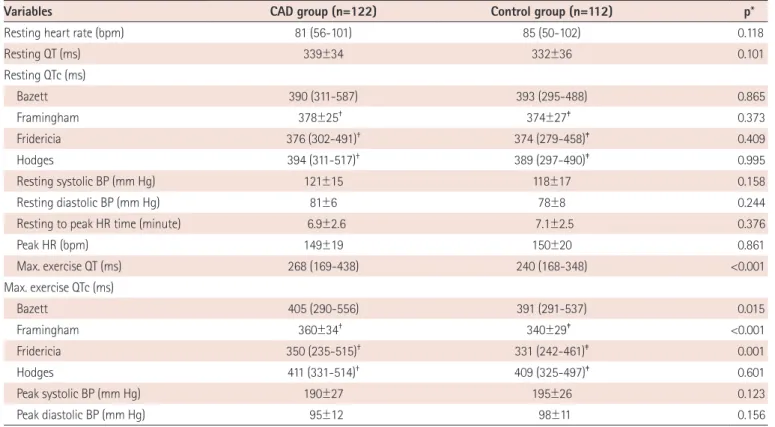
Maximal exercise raw QT interval was longer in the CAD group than in the control group {268 (169-438) ms vs. 240 (168-348) ms, p<0.001}.
Among the maximal exercise QTc derivatives findings, only the Hodges formula provided similar results in the two groups, while the Bazett, Fridericia, and Framingham formulae resulted in higher values in the CAD group than in the control group {405 (290-556) ms vs. 391 (291-537) ms, p=0.015}, {350 (235-515) ms and 331 (279- 458) ms, p=0.001} and (360±34 ms vs. 340±29 ms, p<0.001), re- spectively. In the paired t-test and Wilcoxon rank test analysis, com- paring pre-test and maximal exercise QTc derivates, Bazett formula QTc results were similar for both the CAD (p=0.109) and the control groups (p=0.523), while the Framingham, Fridericia, and Hodges for- mulae results were significantly different for the two groups (all p<
0.001) (Table 2).
Maximal exercise-Framingham QTc and Fridericia QTc were eval- uated by ROC analysis in predicting CAD presence. The closest values of Framingham 350 ms and of Fridericia 340 ms to the best speci- ficity and sensitivity points on the ROC curve were identified {for Framingham QTc: area under the curve (AUC); 0.628±0.035 (0.559- 0.696), p<001} (Fig. 2) and {for Fridericia QTc: AUC; 0.620±0.035 Table 2. Resting and maximal exercise testing findings for both groups
Variables CAD group (n=122) Control group (n=112) p*
Resting heart rate (bpm) 81 (56-101) 85 (50-102) 0.118
Resting QT (ms) 339±34 332±36 0.101
Resting QTc (ms)
Bazett 390 (311-587) 393 (295-488) 0.865
Framingham 378±25† 374±27‡ 0.373
Fridericia 376 (302-491)† 374 (279-458)‡ 0.409
Hodges 394 (311-517)† 389 (297-490)‡ 0.995
Resting systolic BP (mm Hg) 121±15 118±17 0.158
Resting diastolic BP (mm Hg) 81±6 78±8 0.244
Resting to peak HR time (minute) 6.9±2.6 7.1±2.5 0.376
Peak HR (bpm) 149±19 150±20 0.861
Max. exercise QT (ms) 268 (169-438) 240 (168-348) <0.001
Max. exercise QTc (ms)
Bazett 405 (290-556) 391 (291-537) 0.015
Framingham 360±34† 340±29‡ <0.001
Fridericia 350 (235-515)† 331 (242-461)‡ 0.001
Hodges 411 (331-514)† 409 (325-497)‡ 0.601
Peak systolic BP (mm Hg) 190±27 195±26 0.123
Peak diastolic BP (mm Hg) 95±12 98±11 0.156
*Chi-square, Mann-Whitney U test and unpaired Student’s t-tests, paired t-test and Wilcoxon rank test, †Between resting and maximal exercise in the CAD group (p<0.001), ‡Between resting and maximal exercise in the control group (p<0.001). CAD: coronary artery disease, bpm: beat per minute, BP: blood pressure, HR: heart rate, ms: millisecond
Fig. 2. The sensitivity and specificity of the Framingham and Fridericia for- mulae in the ROC curve. For the Framingham of ≥350 ms, the area under the curve (AUC): 0.628±0.035 (0.559-0.696), p<0.01 and for the Fridericia QTc: AUC: 0.620±0.035 (0.551-0.688), p<0.01. ROC: receiver operating characteristic.
1.0
0.8
0.6
0.4
0.2
0.0
1-specificity
Sensitivity
0.0 0.2 0.4 0.6 0.8 1.0 ROC curve
Maximal exercise-Framingham QTc Maximal exercise-Fridericia QTc
(0.551-0.688), p<001}. There was no difference between Framing- ham the QTc AUC and Fridericia QTc AUC values (p=0.846). The sen- sitivity, specificity, positive and negative predictive values maximal exercise QTc for predicting CAD presence were determined as fol- lows: for Framingham of ≥350 ms; 62.2%, 64.3%, 65.5%, and 61%, and for Fridericia of ≥340 ms; 54.1%, 56.3%, 57.3%, and 55.9%, respectively.
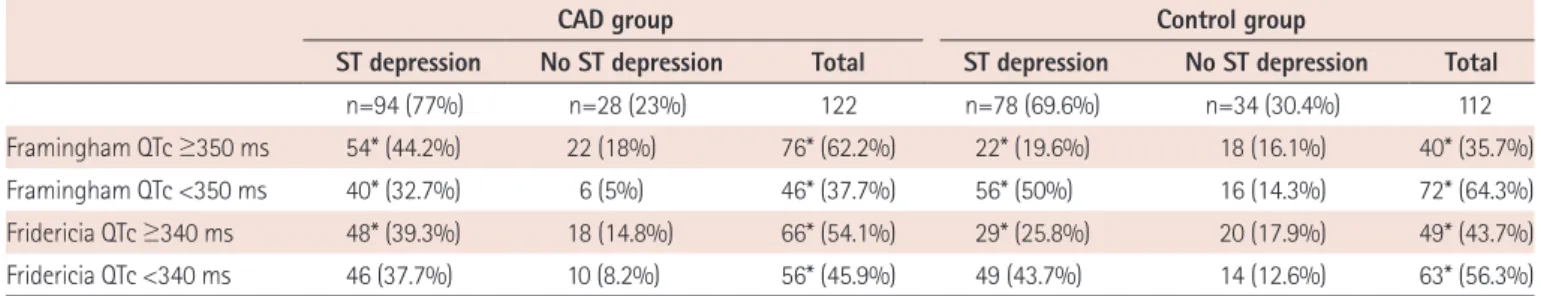
No significant difference was found in terms of ST depression be- tween the two groups. While the number of subjects who had ST depression and peak exercise QT prolongation in the CAD group was higher than that of the control group {for Framingham QTc ≥350 ms: n=54 (44.2%) vs. n=22 (19.6%), p<0.01 and for Fridericia QTc
≥340 ms: n=48 (39.3%) vs. n=29 (25.8%), p<0.01, respectively}, the number of subjects who had no ST depression and peak exercise QT prolongation was similar between the two groups (p>0.05) (Ta- ble 3). Gender, diabetes, dyslipidemia, hypertension, smoking, and the number of coronary artery vessel involvement were similar in those with peak exercise prolongation and with no peak exercise prolongation (all p>0.05), but no presence of CAD {n=39 (33.6%) vs.
46 (38.9%), p=0.032} (Table 4). After entered variables of age, BMI, TG, HDL-C, uric acid, METS, peak heart rate, ST depression, and Gen- sini scoring into univariate and multivariate linear regression anal- ysis, age {unstandardized β=0.86±0.2, p=0.004, confidence interval (CI) 95% from 0.22 to 1.14} and peak heart rate (unstandardized β=-0.58±0.08, p<0.001, CI 95%: from -0.75 to -0.41) were found to be associated with QT prolongation (Table 5).
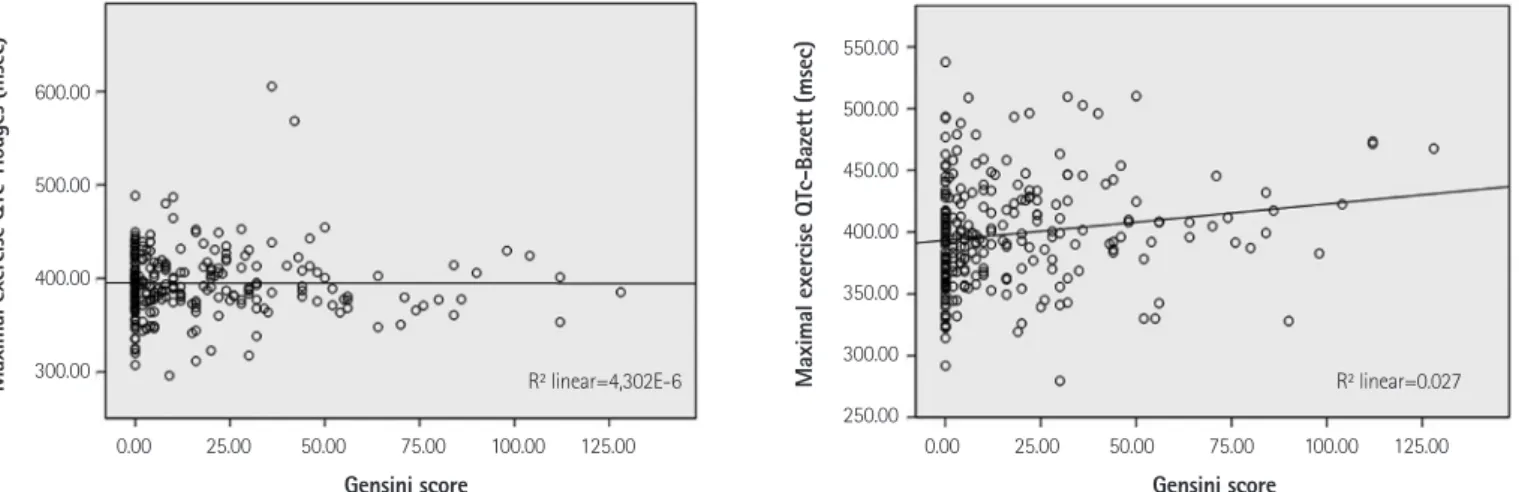
In the correlation analysis, QTc measurements according to the Bazett (r=0.163, p=0.01), Framingham (r=0.239, p=0.001), and Frid- ericia (r=0.206, p=0.001) equations were weakly positively correlated with Gensini scoring, but the Hodges equation was not (r=0.001, p=0.989) (Figs. 3 and 4).
Reliability
Intra and interobserver reliability comparisons of QT measure- ments at resting and peak heart rates were similar. For resting QT measurements, the mean differences were 1.1 and 1.3 ms, p=0.417 and p=0.296, respectively. For peak heart rate QT measurements,
the mean differences were 1.2 and 1.4 ms, p=0.398 and p=0.241, respectively.
Discussion
We primarily aimed to investigate whether there was QTc pro- longation due to ischemia and these formulae were eligible for predicting CAD presence and severity. This study firstly shows that CAD patients have higher peak exercise QTc values. Although the time from resting to peak HR at maximal exercise was similar in the CAD and non-CAD groups, there was longer raw QT in the CAD group in the study. Secondly, these findings showed that exercise-induced ischemia was one of the reasons for QT prolongation as well as ST depression, and there was no additive diagnostic value of QTc at peak heart rate in addition to ST depression observed in the study.
The percentage of those without ST depression and with longer QTc was similar between the two groups. In addition, exercise QTc sen- sitivity and specificity were lower than that of ST depression, as de- scribed by previous studies, of 68% and 77%, respectively.17) The sensitivity of ST depression was 77% in the CAD group. We did not calculate the specificity of ST depression in our study, because our Table 3. Comparison of the prolongation of Framingham and Fridericia QTc and ST depression between the CAD and the control group
CAD group Control group
ST depression No ST depression Total ST depression No ST depression Total
n=94 (77%) n=28 (23%) 122 n=78 (69.6%) n=34 (30.4%) 112
Framingham QTc ≥350 ms 54* (44.2%) 22 (18%) 76* (62.2%) 22* (19.6%) 18 (16.1%) 40* (35.7%)
Framingham QTc <350 ms 40* (32.7%) 6 (5%) 46* (37.7%) 56* (50%) 16 (14.3%) 72* (64.3%)
Fridericia QTc ≥340 ms 48* (39.3%) 18 (14.8%) 66* (54.1%) 29* (25.8%) 20 (17.9%) 49* (43.7%)
Fridericia QTc <340 ms 46 (37.7%) 10 (8.2%) 56* (45.9%) 49 (43.7%) 14 (12.6%) 63* (56.3%)
*Chi-square test between the CAD and the control group (p<0.01). CAD: coronary artery disease
Table 4. Comparison of categorical variables according to categorized Framingham QTc ≥350 msn and QTc <350 msn groups
Variables, n (%)
Framingham QTc ≥350 msn
n=116 (%)
Framingham QTc <350 msn
n=118 (%)
p*
Male gender 74 (63.8) 69 (58.5) 0.884
Diabetes 30 (25.8) 22 (18.6) 0.546
Dyslipidemia 41 (35.3) 42 (35.6) 0.976
Hypertension 39 (33.6) 33 (27.9) 0.421
Smoking 26 (22.4) 20 (16.9) 0.346
CAD presence 76 (65.5) 46 (38.9) 0.032
1-CVI 25 (21.5) 25 (21.1) 0.984
2-CVI 23 (19.4) 17 (14.4) 0.288
3-CVI 17 (14.6) 15 (12.7) 0.156
*Chi-square test, coronary artery vessel involvement. CAD: coronary artery disease
Table 5. Univariate and multivariate linear regression analysis for predicting the variables related to exercise QTc prolongation according to the Framing- ham method
Variables Unstandardized
beta±SE p 95% confidence interval
Lower bound Upper bound
Univariate
Age 0.68±0.23 <0.001 0.46 1.25
BMI -0.42±0.47 0.378 -1.36 0.51
Triglyceride 2.15±1.3 0.853 -0.47 0.04
HDL-C -0.08±0.18 0.966 -0.36 0.35
Uric acid 2.15±1.3 0.104 -0.8 0.28
METS -0.33±0.89 0.711 -2.1 1.4
Peak heart rate -0.54±0.09 <0.001 -0.73 -0.34
ST depression -0.32±2.7 0.229 -8.6 2.07
Gensini scoring 0.10±0.09 0.270 -0.8 0.28
Multivariate
Age 0.86±0.2 0.004 0.22 1.14
Peak heart rate -0.58±0.08 <0.001 -0.75 -0.41
BMI: body mass index, HDL-C: high density lipoprotein-cholesterol, METs: metabolic equivalents, SE: standard error
Fig. 3. Shows a positive linear relationship between Gensini scoring and maximal exercise QTc according to the Framingham (r=0.239, p=0.001) and Frid- ericia formulae (r=0.206, p=0.001).
500.00
450.00
400.00
350.00
300.00
250.00
700.00
600.00
500.00
400.00
300.00
200.00
Gensini score Gensini score
Maximal exercise QTc-Framingham (msec) Maximal exercise QTc-Fridericia (msec)
0.00 25.00 50.00 75.00 100.00 125.00 0.00 25.00 50.00 75.00 100.00 125.00
R2 linear=0.057 R2 linear=0.042
Fig. 4. Gensini scoring is not correlated with maximal exercise QTc according to the Hodges formula (r=0.001, p=0.989), but there is a weakly positive lin- ear relationship between Gensini scoring and maximal exercise QTc according to Bazett (r=0.163, p=0.01).
600.00
500.00
400.00
300.00
550.00
500.00
450.00
400.00
350.00
300.00
250.00
Gensini score Gensini score
Maximal exercise QTc-Hodges (msec) Maximal exercise QTc-Bazett (msec)
0.00 25.00 50.00 75.00 100.00 125.00 0.00 25.00 50.00 75.00 100.00 125.00
R2 linear=4,302E-6 R2 linear=0.027
control group consisted of non-CAD subjects with ST depression or exercise-induced angina. In other words, their abnormal exercise electrocardiograms were mainly false positives. Finally, we found that age and peak heart rate were found to be related to peak exercise QTc time.
Age, gender, heart rate, underlying rhythm and conduction de- fects, neuromuscular capability, pulmonary function, physiologic and metabolic state, and or some drugs influence the QT interval. Fur- thermore, instantaneous ECG at maximal exercise does not estimate the exact QTc interval due to the QT/RR hysteresis. Although numer- ous methods have been proposed to correct QT intervals for heart rate, Bazett is the most universally adopted method. However, it provides no adequate correction at low, ≤60 beats/min, and high,
≥100 beats/min, heart rates, respectively. The Framingham and Fred- ericia methods have been proposed for use outside the normal ran- ges.18) In fact, hysteresis and the time for QT to adapt to RR interval change play an important component of physiology. These metho- dologies are based on population mean correction factors and do not address intra- or inter-individual variability. Although the Ba- zett, Framingham, Fridericia, and Hodges formulae have not been proposed to determine intra- or inter-individual variability for mea- suring QTc, especially at peak heart rates, we aimed to evaluate wh- ether there is a difference at peak exercise between CAD patients and non-CAD subjects.
Not surprisingly, we found that these four equations’ results were different for both resting and peak exercise heart rates. In this data set, the Framingham and Fridericia formulae led to significantly de- creased QTc values, while the Bazett and Hodges correction formu- lae led to significantly increased QTc values at fast heart rates. Previ- ous studies have shown that Bazett overcorrects the QTc, while Fri- dericia undercorrects the QTc at fast heart rates.19)20) Compared to the others at fast heart rates, the distributions of QTc based on Frid- ericia and Framingham were similar, and showed a significant dif- ference between CAD patients and non-CAD subjects. However, the Hodges QTc revealed no difference. The Bazett QTc at peak heart rates was different between the two groups, but it was not differ- ent between the resting and maximal heart rates for the two groups, due to its wider distribution.
The exercise test using ST depression analysis was not more de- cisive in clinical practice. Making exercise testing more routinely useful related to some QT criteria, such as QT dispersion or T wave analysis, has also been sought in the last decade.16)21) In the present study, we compared four different QTc measurement equations and studied their eligibility for the detection of CAD presence and se- verity. Considered ST depression, our study suggests that Framing- ham and Fridericia equations were not as eligible as ST depression for detecting CAD presence during peak heart rate during the exer-
cise test, and both of them were only weakly correlated with CAD severity. We showed, particularly, that rate-independent QT short- ens more in normal controls than in CAD patients at peak exercise.
Framingham, a linear method, with QTc ≥350 ms at maximal exer- cise, was not as satisfying as ST depression in daily routine practice in determining the presence of CAD, even though it has moderate sensitivity, 62.2%, and specificity, 64.3%, and no additive diagnos- tic value in addition to ST depression. We found that the Fridericia formula’s sensitivity was mildly inferior to that of the Framingham formula in determining CAD presence.
While parasympathetic effects on the heart rate at maximal ex- ercise in healthy subjects are continuous and protective against arrhythmias,22) catecholamine and sympathetic effects of vigorous physical exertion in patients with CAD may trigger myocardial in- farction or sudden cardiac death.23) Both graded and sudden intense exercise more commonly trigger cardiac events due to exercise-in- duced ischemia, resulting in ventricular repolarization heterogene- ity, which may be proarrhythmic, by altering the QT rate adapta- tion.21)24)25) There are many different mechanisms for QTc prolo- ngation in myocardial ischemia, such as tranmural dispersion or repolarization heterogeneity, as well as autonomic neural effects.
Normally, exercise-induced ischemia may alter the behaviour of the QT/RR relationship in patients with CAD by decreasing the dura- tion of action potential.26) We considered that the first reason that CAD patients have longer QTc than non-CAD subjects in our study may potentially be related to the longer hysteresis duration for CAD patients.27) Indeed, the substantial intersubject variability of the QT/
RR relationship has been recently well documented, and the basic QT/RR relationship has been explained by hysteresis, with QT adap- tation to instantaneous heart rate changes taking roughly two minutes.28) The precise mechanism of QT hysteresis is not known, however, yet what is understood is that autonomic and non-auto- nomic factors are responsible.29)30) The second reason may be based on the fact that graded exercise potentially leads to the impairment of cardiac physiological reflexes due to ischemia with greater sym- pathetic overdrive and acidosis.
Measurement QT intervals at fast heart rates is the first limita- tion of our study. To minimize misleading results, we particularly ex- cluded cases that appeared to be unreliable for measuring QT inter- val. We did not use any correction factor for the determinate in- stantaneous QT/RR relationship for either group, because our study was not designed to characterize the best formula for measuring QTc. This may be seen as a mitigating factor, but we particularly aimed to compare these simpler correction formulae. Second, we assessed QT interval only in lead DII and V 5. QT intervals, in fact, can be measured differently in different leads. Third, QT intervals at peak exercise are influenced both by its antecedent RR interval and by
the preceding two-minute RR intervals.
In conclusion, the measurement of maximal exercise-QT Fram- ingham QTc of ≥350 ms and Fridericia QTc of ≥340 ms can be in- corporated into clinical decision-making, but QTc prolongation at peak heart rates provides no additive diagnostic information in ad- dition to ST depression. Furthermore, these simpler heart rate cor- rections of the QT interval at maximal exercise are not practical for routine clinical use. Further maximal exercise QTc studies which utilize rate correction factors or are estimated for each individual QT/RR variability may be more beneficial in determining the addi- tive diagnostic value of QTc at maximal exercise for the detection of CAD presence and severity.
References
1. Crow RS, Hannan PJ, Folsom AR. Prognostic significance of corrected QT and corrected JT interval for incident coronary heart disease in a general population sample stratified by presence or absence of wide QRS complex: the ARIC Study with 13 years of follow-up. Circulation 2003;108:1985-9.
2. Rickards AF, Norman J. Relation between QT interval and heart rate.
New design of physiologically adaptive cardiac pacemaker. Br Heart J 1981;45:56-61.
3. Davey P, Bateman J. Heart rate and catecholamine contribution to QT interval shortening on exercise. Clin Cardiol 1999;22:513-8.
4. Schijvenaars BJ, van Herpen G, Kors JA. Intraindividual variability in electrocardiograms. J Electrocardiol 2008;41:190-6.
5. Sohaib SM, Papacosta O, Morris RW, Macfarlane PW, Whincup PH.
Length of the QT interval: determinants and prognostic implications in a population-based prospective study of older men. J Electrocardiol 2008;41:704-10.
6. Bazett HC. An analysis of the time-relations of electrocardiograms.
Heart 1920;7:353-70.
7. Fridericia LS. Die systolendauer im elektrokardiogramm bei normalen menschen und bei herzkranken. Acta Med Scan 1920;53:469-86.
8. Hodges M, Salerno D, Erlinen D. Bazett’s QT correction reviewed-Evi- dence that a linear QT correctionfor heart is better. J Am Coll Cardiol 1983;12:694.
9. Sagie A, Larson MG, Goldberg RJ, Bengtson JR, Levy D. An improved method for adjusting the QT interval for heart rate (the Framingham Heart Study). Am J Cardiol 1992;70:797-801.
10. Rautaharju PM, Surawicz B, Gettes LS, et al. AHA/ACCF/HRS recom- mendations for the standardization and interpretation of the electro- cardiogram: part IV: the ST segment, T and U waves, and the QT inter- val: a scientific statement from the American Heart Association Elec- trocardiography and Arrhythmias Committee, Council on Clinical Car- diology; the American College of Cardiology Foundation; and the Heart Rhythm Society. Endorsed by the International Society for Comput- erized Electrocardiology. J Am Coll Cardiol 2009;53:982-91.
11. Miranda CP, Liu J, Kadar A, et al. Usefulness of exercise-induced ST- segment depression in the inferior leads during exercise testing as a
marker for coronary artery disease. Am J Cardiol 1992;69:303-7.
12. Takase B, Masaki N, Hattori H, Ishihara M, Kurita A. Usefulness of au- tomatic QT dispersion measurement for detecting exercise-induced myocardial ischemia. Anadolu Kardiyol Derg 2009;9:189-95.
13. Ulgen MS, Karadede A, Alan S, Temamog˘ulari AV, Karabulut A, Toprak N. Contribution of the peak exercise QT dispersion to the accuracy of an exercise test during the evaluation of coronary artery disease. Acta Cardiol 2000;55:335-9.
14. Chugh SS, Reinier K, Singh T, et al. Determinants of prolonged QT inter- val and their contribution to sudden death risk in coronary artery dis- ease: the Oregon Sudden Unexpected Death Study. Circulation 2009;
119:663-70.
15. Goldenberg I, Moss AJ, Zareba W. QT interval: how to measure it and what is “normal”. J Cardiovasc Electrophysiol 2006;17:333-6.
16. Gensini GG. A more meaningful scoring system for determining the severity of coronary heart disease. Am J Cardiol 1983;51:606.
17. Gianrossi R, Detrano R, Mulvihill D, et al. Exercise-induced ST depres- sion in the diagnosis of coronary artery disease. A meta-analysis. Circu- lation 1989;80:87-98.
18. Aytemir K, Maarouf N, Gallagher MM, Yap YG, Waktare JE, Malik M.
Comparison of formulae for heart rate correction of QT interval in ex- ercise electrocardiograms. Pacing Clin Electrophysiol 1999;22:1397- 401.
19. Luo S, Michler K, Johnston P, Macfarlane PW. A comparison of com- monly used QT correction formulae: the effect of heart rate on the QTc of normal ECGs. J Electrocardiol 2004;37 Suppl:81-90.
20. Rautaharju PM, Zhang ZM. Linearly scaled, rate-invariant normal limits for QT interval: eight decades of incorrect application of power func- tions. J Cardiovasc Electrophysiol 2002;13:1211-8.
21. Chauhan VS, Krahn AD, Mitoff P, Klein GJ, Skanes AC, Yee R. Sudden intense exercise increases QT heart rate slope and T wave complexity in long QT syndrome and normal subjects. Pacing Clin Electrophysiol 2004;
27:1415-23.
22. Kannankeril PJ, Goldberger JJ. Parasympathetic effects on cardiac electrophysiology during exercise and recovery. Am J Physiol Heart Circ Physiol 2002;282:H2091-8.
23. Mittleman MA, Siscovick DS. Physical exertion as a trigger of myocar- dial infarction and sudden cardiac death. Cardiol Clin 1996;14:263-70.
24. Schwartz PJ, Priori SG, Spazzolini C, et al. Genotype-phenotype corre- lation in the long-QT syndrome: gene-specific triggers for life-threat- ening arrhythmias. Circulation 2001;103:89-95.
25. Hirao H, Shimizu W, Kurita T, et al. Frequency-dependent electrophysi- ologic properties of ventricular repolarization in patients with congeni- tal long QT syndrome. J Am Coll Cardiol 1996;28:1269-77.
26. Shaw RM, Rudy Y. Electrophysiologic effects of acute myocardial isch- emia: a theoretical study of altered cell excitability and action potential duration. Cardiovasc Res 1997;35:256-72.
27. Lauer MS, Pothier CE, Chernyak YB, et al. Exercise-induced QT/R-R-in- terval hysteresis as a predictor of myocardial ischemia. J Electrocardiol 2006;39:315-23.
28. Malik M. Problems of heart rate correction in assessment of drug-in- duced QT interval prolongation. J Cardiovasc Electrophysiol 2001;12:
411-20.
29. Magnano AR, Holleran S, Ramakrishnan R, Reiffel JA, Bloomfield DM.
Autonomic nervous system influences on QT interval in normal sub- jects. J Am Coll Cardiol 2002;39:1820-6.
30. Arrowood JA, Kline J, Simpson PM, et al. Modulation of the QT interval:
effects of graded exercise and reflex cardiovascular stimulation. J Appl Physiol (1985) 1993;75:2217-23.