Original Article: Food Science/Microbiology
Comparison of the Nutritional Compositions of Insect-Resistant and Glufosinate-Tolerant Rice and Conventional Rice
Soo-Yun Park · Si Myung Lee · Yunsoo Yeo · Soon Jong Kweon · Hyun Suk Cho · Jae Kwang Kim*
Received: 7 June 2012 / Accepted: 8 October 2012 / Published Online: 31 March 2013
© The Korean Society for Applied Biological Chemistry 2013
Abstract The nutritional composition of transgenic rice (Agb0101) with bar and modified cry1Ac1 genes grown with herbicides was compared with that of its non-transgenic counterpart. The analyzed components (proximates, amino acids, fatty acids, minerals, vitamins, trypsin inhibitors, and phytic acid) in the herbicide- treated Agb0101 brown rice were substantially equivalent to those of its non-transgenic counterpart.
Keywords compositional analysis · herbicide tolerance · insect resistance · substantial equivalence · transgenic rice
The insecticidal genes of Bacillus thuringiensis (Bt) are widely used for the production of insect-resistant plants (Maqbool et al., 2001; Bajaj and Mohanty, 2005), with cry1Ab and cry1Ac being the most commonly used Bt genes in transgenic crops. The genes encode the production of crystal (Cry) protein, which exhibits a toxic effect by penetrating the cell membrane and forming pores, resulting in injury to the midgut epithelial cells of some insects.
The effect of Bt insecticidal proteins is highly specific to target insects while being harmless to plants and mammals (Bravo et al., 2007). In Korea, the Rural Development Administration (RDA) developed genetically modified rice (Agb0101) containing the modified cry1Ac1 gene, which displayed high resistance to rice leaf folder under field conditions (Kim et al., 2009). In addition, to achieve herbicide-tolerance, the bar gene from Streptomyces hygroscopicus was also introduced into the rice genome.
Phosphinothricin-N-acetyltransferase (PAT) encoded by the bar gene catalyzes acetylation of the free amino group of phosphinothricin,
thereby detoxifying the herbicide L-phosphinothricin (glufosinate) into an inactive compound (Oberdoerfer et al., 2005).
Assessing the safety of genetically modified (GM) plants is essential for commercialization and strictly required for the use of GM plants in food. This assessment is based on the ‘substantial equivalence’ concept formulated by the Organization for Economic Cooperation and Development (OECD) in 1993. Further details were added by the Codex Alimentarius Commission of the Food and Agriculture Organization of the United Nations/World Health Organization (FAO/WHO). Assessing substantial equivalence entails comparing the GM crop with its non-transgenic counterpart to identify possible differences. Substantial equivalence is not a safety assessment per se, but is a starting point from which to assess transgenic food safety.
Composition analysis is an important consideration in the evaluation of substantial equivalence. The OECD consensus documents have identified key food and feed nutrients and anti- nutrients required for the safety study of new rice varieties (OECD, 2004). In accordance with the guidelines, we analyzed nutrients and anti-nutritive components of Agb0101 grown in 2009 and confirmed that nutritional quality of Agb0101 was substantially equivalent to that of its non-transgenic counterpart (Park et al., 2012). The Codex guidelines have stated that trials should be conducted over a sufficient number of generations at multiple sites to allow accurate assessment of compositional characteristics. In the case of herbicide tolerance, comparisons involving the GM plants grown with herbicide applications may also need to be considered (Codex Alimentarius, 2009). Comparative compositional analyses have been previously reported for transgenic rice containing a bar gene (Li et al., 2008; Choi et al., 2012).
However, herbicide applications to this transgenic rice have not been reported. Therefore, in this study we analyzed the nutritional composition and anti-nutrient content of Agb0101 grown under application of the herbicide glufosinate and then assessed whether the nutritional quality of Agb0101 is altered in the generations S.-Y. Park · S. M. Lee · Y. Yeo · S. J. Kweon · H.S. Cho · J. K. Kim
National Academy of Agricultural Science, Rural Development Administration, Suwon 441-707, Republic of Korea
*Corresponding author (J. K. Kim: [email protected])
following herbicide treatment.
Seedlings of the GM rice and its parent cultivar (Oryza sativa L., cv. Nakdongbyeo) were planted in adjoining fields in 2010 under the same field management conditions. Two months after transplantation, glufosinate ammonium herbicide (Basta, Bayer Crop Science, Germany) was applied at 108 g active ingredient/
ha as a single application. After harvest, the whole grain (rough rice) samples were dried and then manually hulled and ground to obtain a fine powder using a cyclone mixer mill (HMF-590, Hanil, Korea) and a mortar and pestle. The powder was used in compositional analyses, which were conducted according to experimental procedures described in our previous report (Park et al., 2012). The nutritional composition of herbicide-treated Agb0101 was then compared with that of its conventional counterpart.
Equivalence tests were used to determine whether the differences in treatments exceeded the range of normal variation in the comparator. We used the two one-sided tests (TOST) procedure for equivalence testing. The statistical analysis was carried out using the SAS 9.2 software package (SAS Institute, USA). In the TOST procedure, the null hypothesis tested was “Treatment 1 is not equivalent to treatment 2” versus the alternative hypothesis
“Treatment 1 is equivalent to treatment 2.” To test for equivalence, the 90% confidence intervals for the differences between the two treatments were constructed. The confidence intervals 100(1–2×
α)% (=90%), where α =0.05, were calculated in pairs for the treatment differences. Thus, the 90% confidence interval method is equivalent to carrying out TOST at a 5% significance level.
Equivalence boundaries were set to ±20% of the means according to the recommendation by the Nordic Council of Ministers (Nordic Council, 2000).
The main nutrient and amino acid compositions are described in Tables 1 and 2. Crude protein content was estimated by determining the total nitrogen using the Kjeldahl method (AOAC, 2005b), and crude fat was analyzed by the Soxhlet extraction method (AOAC, 2000a). Ash content was determined by gravimetric measurement of the sample residue after ignition in an oven at 600oC until a constant weight was reached (AOAC, 2005a). Total
dietary fiber was quantified as the weight of residue minus the weight of protein and ash after digestion of the sample with α- amylase, protease, and amyloglucosidase (Prosky et al., 1988).
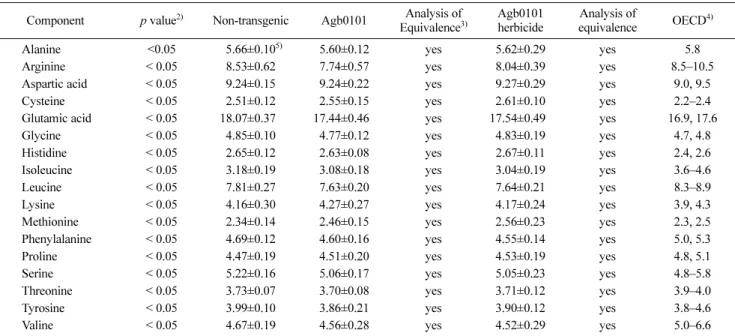
For the analysis of the sulfur-containing amino acids cysteine and methionine, samples were oxidized with performic acid followed by hydrolysis with hydrochloric acid. The remaining 15 amino acids were analyzed using an automatic amino acid analyzer directly after protein hydrolysis with hydrochloric acid (AOAC, 2005c). No significant differences were found in the mean values of protein, lipid, ash, dietary fiber, carbohydrate, and amino acids between Agb0101 and herbicide-treated Agb0101 compared with their non-transgenic counterpart. Although total dietary fiber levels were slightly high, the values of main nutrients and amino acids did not deviate considerably from ranges of commercial rice provided by the OECD (2004).
The individual fatty acid content was determined after lipid extraction and saponification with 0.5 N sodium hydroxide in methanol. The saponification mixture was methylated using 14%
boron trifluoride/methanol, and the resulting methyl esters were extracted with pentane. The methyl esters of the fatty acids were analyzed by gas chromatography (AOCS, 1997b). Pentadecanoic acid was used as an internal standard. As shown in Table 3, the statistical analyses revealed that Agb0101, herbicide-treated Agb0101, and non-transgenic rice contained equivalent fatty acids. Although a consensus document published by the OECD was not available, the measured values of fatty acids fell within the ranges of values observed in the six typical Korean varieties as reported by Choe et al. (2002).
Levels of the minerals listed in Table 4 were determined by inductively coupled plasma optical emission spectrometry (Integra XL Inductively Coupled Plasma Optical Emission Spectrometer, GBC Co., Australia) according to AOAC method 999.11 (AOAC, 2000b). Extractions of vitamin B1 and B2 were performed according to the method of Sims and Shoemaker (1993) and Esteve et al. (2001). Vitamins were determined using a high- performance liquid chromatography method with fluorometric detection. Niacin and vitamin E were detected as described by Table 1 Comparison and analysis of equivalence of the proximates measured in brown rice1)
Component p value2) Non-transgenic Agb0101 Analysis of equivalence3)
Agb0101 herbicide
Analysis of
equivalence OECD4)
Protein <0.05 07.08±0.275) 7.09±0.27 yes 6.98±0.41 yes 7.1–8.3
Lipid <0.05 2.19±0.26 1.97±0.19 yes 2.03±0.24 yes 1.6–2.8
Ash <0.05 1.26±0.05 1.36±0.10 yes 1.39±0.05 yes 1.0–1.5
Total dietary fiber <0.05 3.62±0.22 3.70±0.35 yes 3.91±0.26 yes 3.0
Carbohydrates6) <0.05 89.47±0.320 89.55±0.400 yes 89.39±0.580 yes 87.4–90.3
1)The values of proximate were calculated as percentage of dry matter (sample contained 10% moisture).
2)On the basis of the TOST, confidence intervals 100(1–2×α)%, where α =0.05, were calculated for equivalence assessment. In the equivalence study, the null hypothesis tested was “Treatment 1 is not equivalent to treatment 2” versus the alternative hypothesis “Treatment 1 is equivalent to treatment 2.”
3)The criterion for equivalence (yes) is met when the 90% confidence interval of the difference does not exceed the 20% range of the reference (cv.
Nakdongbyeo). If the 90% confidence interval of the difference exceeds the 20% range of the reference (cv. Nakdongbyeo), this is indicated by
“no”.
4)Source: OECD data.
5)Each value is the mean ± standard deviation (n =10).
6)Carbohydrates levels were estimated by the following formula: % carbohydrates =100–(% protein + % lipid + % ash).
Kim et al. (2011; 2012). The levels of minerals and vitamins both in Agb0101 and herbicide-treated Agb0101 were very similar to those of their non-transgenic counterpart (Table 4). Their values were also statistically equivalent and, with the exception of copper and vitamin B2, within the reference ranges reported by the OECD (2004). However, levels of both copper and vitamin B2 were also
lower in the non-transgenic control than the range of values provided by the OECD, indicating that this is not an effect caused by either genetic modification or herbicide treatment.
Equivalence was demonstrated for anti-nutrients (Table 4).
Trypsin inhibitor activity was determined using AOCS method Ba 12-75 (AOCS, 1997a). Phytic acid content was analyzed by ion Table 2 Comparison and analysis of equivalence of the amino acids measured in brown rice1)
Component p value2) Non-transgenic Agb0101 Analysis of Equivalence3)
Agb0101 herbicide
Analysis of
equivalence OECD4)
Alanine <0.05 05.66±0.105) 5.60±0.12 yes 5.62±0.29 yes 5.8
Arginine < 0.05 8.53±0.62 7.74±0.57 yes 8.04±0.39 yes 8.5–10.5
Aspartic acid < 0.05 9.24±0.15 9.24±0.22 yes 9.27±0.29 yes 9.0, 9.5
Cysteine < 0.05 2.51±0.12 2.55±0.15 yes 2.61±0.10 yes 2.2–2.4
Glutamic acid < 0.05 18.07±0.370 17.44±0.460 yes 17.54±0.490 yes 16.9, 17.6
Glycine < 0.05 4.85±0.10 4.77±0.12 yes 4.83±0.19 yes 4.7, 4.8
Histidine < 0.05 2.65±0.12 2.63±0.08 yes 2.67±0.11 yes 2.4, 2.6
Isoleucine < 0.05 3.18±0.19 3.08±0.18 yes 3.04±0.19 yes 3.6–4.6
Leucine < 0.05 7.81±0.27 7.63±0.20 yes 7.64±0.21 yes 8.3–8.9
Lysine < 0.05 4.16±0.30 4.27±0.27 yes 4.17±0.24 yes 3.9, 4.3
Methionine < 0.05 2.34±0.14 2.46±0.15 yes 2.56±0.23 yes 2.3, 2.5
Phenylalanine < 0.05 4.69±0.12 4.60±0.16 yes 4.55±0.14 yes 5.0, 5.3
Proline < 0.05 4.47±0.19 4.51±0.20 yes 4.53±0.19 yes 4.8, 5.1
Serine < 0.05 5.22±0.16 5.06±0.17 yes 5.05±0.23 yes 4.8–5.8
Threonine < 0.05 3.73±0.07 3.70±0.08 yes 3.71±0.12 yes 3.9–4.0
Tyrosine < 0.05 3.99±0.10 3.86±0.21 yes 3.90±0.12 yes 3.8–4.6
Valine < 0.05 4.67±0.19 4.56±0.28 yes 4.52±0.29 yes 5.0–6.6
1)The values of amino acids were calculated as a percentage to total protein.
2)On the basis of the TOST, confidence intervals 100(1–2×α)%, where α =0.05, were calculated for equivalence assessment. In the equivalence study, the null hypothesis tested is “Treatment 1 is not equivalent to treatment 2” versus the alternative hypothesis “Treatment 1 is equivalent to treatment 2.”
3)The criterion for equivalence (“yes”) is met when the 90% confidence interval of the difference does not exceed the 20% range of the reference (cv. Nakdongbyeo). If the 90% confidence interval of the difference exceeds the 20% range of the reference (cv. Nakdongbyeo), this is indicated by “no.”
4)Source: OECD data.
5)Each value is the mean ± standard deviation (n =10).
Table 3 Comparison and analysis of equivalence of the fatty acids measured in brown rice1)
Component p value2) Non-transgenic Agb0101 Analysis of
equivalence3)
Agb0101 herbicide
Analysis of equivalence
C14:0 < 0.05 0.0.31±0.034) 0.35±0.05 yes 0.38±0.09 yes
C16:0 < 0.05 16.70±0.260 16.21±0.290 yes 16.28±0.240 yes
C18:0 < 0.05 0.75±0.12 0.84±0.13 yes 0.88±0.14 yes
C18:1 < 0.05 42.42±0.820 40.47±0.360 yes 40.32±0.500 yes
C18:2 < 0.05 36.36±0.540 38.24±0.490 yes 38.18±0.800 yes
C18:3 < 0.05 1.49±0.18 1.63±0.07 yes 1.62±0.07 yes
C20:0 < 0.05 0.66±0.04 0.67±0.09 yes 0.67±0.09 yes
C22:0 < 0.05 0.35±0.03 0.40±0.03 yes 0.41±0.08 yes
C24:0 < 0.05 0.90±0.09 1.03±0.15 yes 1.00±0.09 yes
1)The values of fatty acids are indicated as a percentage of total fatty acids.
2)On the basis of the TOST, confidence intervals 100(1–2×α)%, where α =0.05, were calculated for equivalence assessment. In the equivalence study, the null hypothesis tested was “Treatment 1 is not equivalent to treatment 2” versus the alternative hypothesis “Treatment 1 is equivalent to treatment 2.”
3)The criterion for equivalence (“yes”) is met when the 90% confidence interval of the difference does not exceed the 20% range of the reference (cv. Nakdongbyeo). If the 90% confidence interval of the difference exceeds the 20% range of the reference (cv. Nakdongbyeo), this is indicated by “no.”
4)Each value is the mean ± standard deviation (n =10).
exchange chromatography following AOAC 986.11 (AOAC, 2005d). Equivalence analysis showed that the two anti-nutritional factors were statistically equivalent. The inhibitory activity of trypsin inhibitors was very low in all of the rice samples compared to the 100–184 trypsin inhibitor units (TIU)/mg detected in soybean (Kakade et al., 1972).
In conclusion, the nutritional composition and anti-nutrient content of Agb0101 grown under herbicide application as studied here were substantially equivalent to those of the conventional rice counterpart. Comparison of nutritional composition is an important consideration in the safety assessment of food and feed products derived from GM crops for which no changes to the nutritional composition are intended. The results of this study confirm that the nutritional quality of Agb0101 with bar and modified cry1Ac1 genes was unchanged by herbicide treatment and growing season expansion, when compared to that of its non-transgenic counterpart.
Acknowledgments This work was supported by grants from the National Academy of Agricultural Science (Code PJ006834) and the Next-Generation BioGreen 21 Program (SSAC, PJ0081842012), Rural Development Administration, Republic of Korea.
References
AOAC (2000a) Fat (crude) or ether extract in meat. AOAC official methods 960.39, Gaithersburg, MD, USA.
AOAC (2000b) Determination of lead, calcium, copper, iron, zinc, sodium, magnesium, phosphorus, potassium, manganese in food. AOAC official methods 999.11, Gaithersburg, MD, USA.
AOAC (2005a) Ash of flour. AOAC official methods 923.03, Gaithersburg, MD, USA.
AOAC (2005b) Nitrogen (total) in fertilizers. AOAC official methods 955.04, Gaithersburg, USA.
AOAC (2005c) Protein efficiency ratio. AOAC official methods 982.30, Gaithersburg, MD, USA.
AOAC (2005d) Phytate in foods. AOAC official methods 986.11, Gaithersburg, MD, USA.
AOCS (1997a) In Official Methods and Recommended Practices of the American Oil Chemists. Champaign, IL, USA.
AOCS (1997b) Fatty acid composition by gas chromatography. In Official Methods and Recommended Practices of the American Oil Chemists.
Method Ce 1-62. Champaign, IL, USA.
Bajaj S and Mohanty A (2005) Recent advances in rice biotechnology towards genetically superior transgenic rice. Plant Biotechnol J 3, 275–
307.
Bravo A, Gill SS, and Soberón M (2007) Mode of action of Bacillus thuringiensis Cry and Cyt toxin and their potential for insect control.
Toxicon 49, 423–35.
Choe JS, Ahn HH, and Nam HJ (2002) Comparison of nutritional composition in Korean rice. J Korean Soc Food Sci Nutr 31, 885–92.
Choi H, Moon JK, Park BS, Park HW, Park SY, Kim TS et al. (2012) Comparative nutritional analysis for genetically modified rice, Iksan483 and Milyang204, and nontransgenic counterparts. J Korean Soc Appl Biol Chem 55, 19–26.
Codex Alimentarius (2009) Foods derived from modern biotechnology.
Codex Alimentarius Commission, Joint FAO/WHO Food Standards Programme, Rome, Italy.
Esteve MJ, Farré R, Frígola A, and García-Cantabella JM (2001) Simultaneous determination of thiamin and riboflavin in mushrooms by Table 4 Comparison and analysis of equivalence of the minerals, vitamins, and anti-nutrients measured in brown rice
Component p value1) Non-transgenic Agb0101 Analysis of equivalence2)
Agb0101 herbicide
Analysis of
equivalence OECD3) Minerals
Copper, µg/g <0.05 07.97±2.234) 8.00±1.98 yes 7.56±1.78 yes 1–7
Iron, µg/g <0.05 16.39±3.580 16.14±2.460 yes 16.24±2.300 yes 2–60
Sodium, µg/g <0.05 194.02±42.040 205.26±53.350 yes 181.03±24.420 yes 20–400
Zinc, µg/g <0.05 28.35±2.270 32.78±1.610 yes 31.93±1.700 yes 7–33
Calcium, mg/g <0.05 0.16±0.04 0.16±0.01 yes 0.15±0.02 yes 0.1–0.6
Potassium, mg/g <0.05 2.18±0.30 2.43±0.16 yes 2.73±0.31 yes 0.7–3.2
Magnesium, mg/g <0.05 1.13±0.06 1.16±0.07 yes 1.15±0.05 yes 0.2–1.7
Phosphorus, mg/g <0.05 3.00±0.14 3.20±0.21 yes 3.22±0.12 yes 2–5
Vitamins
Vitamin B1, µg/g <0.05 3.81±0.31 4.18±0.35 yes 4.02±0.29 yes 2.9-6.1
Vitamin B2, µg/g <0.05 0.15±0.01 0.15±0.01 yes 0.15±0.01 yes 0.4-1.4
Niacin, µg/g <0.05 50.69±1.770 49.63±1.220 yes 49.12±2.720 yes 35-53
Vitamin E, µg/g <0.05 16.08±2.550 16.47±2.800 yes 16.92±3.290 yes 9-25
Anti-nutrients
Trypsin inhibition, TIU/mg <0.1 <0.1 yes <0.1 yes Not available
Phytic acid, % <0.05 0.78±0.08 0.91±0.06 yes 0.87±0.06 yes Not available
1)On the basis of the TOST, confidence intervals 100(1–2×α)%, where α =0.05, were calculated for equivalence assessment. In the equivalence study, the null hypothesis tested was “Treatment 1 is not equivalent to treatment 2” versus the alternative hypothesis “Treatment 1 is equivalent to treatment 2.”
2)The criterion for equivalence (“yes”) is met when the 90% confidence interval of the difference does not exceed the 20% range of the reference (cv. Nakdongbyeo). If the 90% confidence interval of the difference exceeds the 20% range of the reference (cv. Nakdongbyeo), this is indicated by “no.”
3)Source: OECD data.
4)Each value is the mean ± standard deviation (n =10).
liquid chromatography. J Agric Food Chem 49, 1450–4.
Kakade ML, Simons NR, Liener IE, and Lambert JW (1972) Biochemical and nutritional assessment of different varieties of soybeans. J Agric Food Chem 20, 87–90.
Kim EH, Suh SC, Park BS, Shin KS, Kweon SJ, Han EJ et al. (2009) Chloroplast-targeted expression of synthetic cry1Ac in transgenic rice as an alternative strategy for increased pest protection. Planta 23, 397–405.
Kim JK, Ha SH, Park SY, Lee SM, Kim HJ, Lim SH et al. (2012) Determination of lipophilic compounds in genetically modified rice using gas chromatography-time-of-flight mass spectrometry. J Food Compos Anal 25, 31–8.
Kim JK, Park SY, Ha SH, Lee SM, Lim SH, Yu CY et al. (2011) Stable isotope dilution gas chromatography-time-of-flight mass spectrometry method for determining niacin in rice. Cereal Chem 88, 397–9.
Li X, He X, Luo Y, Xiao G, Jiang X, and Huang K (2008) Comparative analysis of nutritional composition between herbicide-tolerant rice with bar gene and its non-transgenic counterpart. J Food Compos Anal 21, 535–9.
Maqbool SB, Riazuddin S, Loc NT, Gatehouse AMR, Gatehouse JA, and Christou P (2001) Expression of multiple insecticidal genes confers broad resistance against a range of different rice pests. Mol Breed 7, 85–
93.
Nordic Council (2000) Safety assessment of novel food plants. Chemical analytical approaches to the establishment of substantial equivalence.
TemaNord 1998, 591. Nordic Council of Ministers, Copenhagen, Denmark.
Oberdoerfer RB, Shillito RD, De Beuckeleer M, and Mitten DH (2005) Rice (Oryza sativa L.) containing the bar gene is compositionally equivalent to the nontransgenic counterpart. J Agric Food Chem 53, 1457–65.
OECD (2004) Environment, health and safety publications series on the safety of novel foods and feeds. No. 10. Consensus document on compositional considerations for new varieties of rice (Oryza sativa): key food and feed nutrients and anti-nutrients. Paris, France.
Park SY, Lee SM, Lee JH, Ko HS, Kweon SJ, Suh SC et al. (2012) Compositional comparative analysis between insect-resistant rice (Oryza sativa L.) with a synthetic cry1Ac gene and its non-transgenic counterpart. Plant Biotechnol Rep 6, 29–37.
Prosky L, Asp NG, Schweizer TF, DeVries JW, and Furda I (1988) Determination of insoluble, soluble, and total dietary fiber in foods and food products: interlaboratory study. J AOAC 71, 1017–23.
Sims A and Shoemaker D (1993) Simultaneous liquid chromatographic determination of thiamine and riboflavin in selected foods. J AOAC Int 76, 1156–60.