Role of Coronary Artery Calcium Scoring in Detection of
Coronary Artery Disease according to Framingham Risk Score in Populations with Low to Intermediate Risks
Current guidelines recommend that coronary artery calcium (CAC) screening should only be used for intermediate risk groups (Framingham risk score [FRS] of 10%-20%). The CAC distributions and coronary artery disease (CAD) prevalence in various FRS strata were determined. The benefit to lower risk populations of CAC score-based screening was also assessed. In total, 1,854 participants (aged 40-79 years) without history of CAD, stroke, or diabetes were enrolled. CAC scores of > 0, ≥ 100, and ≥ 300 were present in 33.8%, 8.2%, and 2.9% of the participants, respectively. The CAC scores rose significantly as the FRS grew more severe (P < 0.01). The total CAD prevalence was 6.1%. The occult CAD prevalence in the FRS ≤ 5%, 6%-10%, 11%-20%, and > 20% strata were 3.4%, 6.7%, 9.0%, and 11.6% (P < 0.001). In multivariate logistic regression analysis adjusting, not only the intermediate and high risk groups but also the low risk (FRS 6%-10%) group had significantly increased odds ratio for occult CAD compared to the very low-risk (FRS ≤ 5%) group (1.89 [95% confidence interval, CI, 1.09-3.29] in FRS 6%-10%; 2.48 [95% CI, 1.47-4.20] in FRS 11%-20%; and 3.10 [95% CI, 1.75-5.47] in FRS > 20%; P < 0.05). In conclusion, the yield of screening for significant CAC and occult CAD is low in the very low risk population but it rises in low and intermediate risk populations.
Keywords: Coronary Artery Calcium Score; Coronary Computed Tomography; Coronary Computed Tomography Angiography; Framingham Risk Score
Won-Jang Kim,1 Chang Hee Kwon,2 Seungbong Han,4 Woo Seok Lee,2 Joon Won Kang,3 Jung-Min Ahn,2 Jong-Young Lee,2 Duk-Woo Park,2 Soo-Jin Kang,2 Seung-Whan Lee,2 Young-Hak Kim,2 Cheol Whan Lee,2 Seong-Wook Park,2 and Seung-Jung Park2
1Department of Cardiology, CHA Bundang Medical Center, CHA University School of Medicine, Seongnam, Korea; 2Department of Cardiology, University of Ulsan College of Medicine, Asan Medical Center, Seoul, Korea; 3Department of Radiology, University of Ulsan College of Medicine, Asan Medical Center, Seoul, Korea; 4Department of Applied Statistics, Gachon University, Seongnam, Korea
Received: 13 September 2015 Accepted: 28 March 2016 Address for Correspondence:
Seung-Jung Park, MD
Department of Cardiology, University of Ulsan College of Medicine, Asan Medical Center, 88 Olympic-ro 43-gil, Songpa-gu, Seoul 05505, Korea
E-mail: sjpark@ amc.seoul.kr
http://dx.doi.org/10.3346/jkms.2016.31.6.902 • J Korean Med Sci 2016; 31: 902-908
INTRODUCTION
Cardiovascular disease remains the leading cause of morbidity and mortality throughout the world. A large proportion of pa- tients who develop sudden cardiac death or nonfatal myocar- dial infarction do not experience prior symptoms: indeed, as many as 50% of myocardial infarctions occur in persons with- out a known history of symptomatic coronary artery disease (CAD) (1). Therefore, it is important to identify individuals at risk of coronary events before they develop clinical symptoms.
To assess the cardiovascular risk in healthy individuals, most clinicians use a combination of traditional risk factors. Of the various risk-estimation systems that are available, the Framing- ham risk score (FRS) is the system that is most commonly used to predict 10 year cardiovascular risk (2). This system is based on history and clinical and laboratory measurements. However, although it is used as the gold standard for evaluating screening techniques, it fails to identify many people who are destined to have a coronary event (3). Therefore, noninvasive imaging tests such as coronary artery calcium (CAC) scoring and coronary
computed tomography angiography (CCTA) have been evalu- ated for their ability to screen for CAD. It has been shown that CAC scoring can predict coronary events better than FRS, with subjects with severe CAC (≥ 300 or 400) having the greatest risk (4-7). CCTA is also considered to be a very accurate diagnostic tool for detecting obstructive CAD (8). Several recent guidelines have recommended that CAC scoring should only be used to estimate the cardiovascular risk of the intermediate risk popu- lation (defined as an FRS-estimated 10 year risk of between 10%
and 20%) (9). Several guidelines also consider CCTA for diag- nosing CAD in asymptomatic populations, but none of these guidelines actually recommend the use of CCTA for screening (10-12). Actually, the Framingham risk estimate is often invoked as a gatekeeper for imaging techniques, such as CAC scoring and CCTA (13,14).
Recent data from the Multi-Ethnic Study of Atherosclerosis (MESA) suggest that the yield of screening for advanced CAC burden (CAC ≥ 300) is higher in the low to intermediate risk individuals (FRS of 5.1%-20.0%) (15). Additionally, it has been suggested that if subjects classified as low risk in the FRS system Cardiovascular Disorders
are excluded from further screening, about two-thirds of wom- en and a quarter of men with substantial atherosclerosis will be missed (16). However, the relationships between FRS and CAC and CCTA-detected CAD remain poorly understood.
The present study was performed to evaluate the distribution of CAC scores and the prevalence of CCTA-detected CAD in the various FRS strata. Whether lower risk populations could bene- fit from screening with CAC scoring and CCTA was also assessed.
MATERIALS AND METHODS Study population
Between January, 2008, and December, 2009, 2,276 participants (40-79 years of age) underwent CCTA in a health examination at the Asan Medical Center, Seoul, Korea. Participants with a past history of CAD (n = 148) or stroke (n = 32) were excluded.
Participants with diabetes (n = 294) were also excluded because they were considered to be at high cardiovascular risk accord- ing to the National Cholesterol Education Program Adult Treat- ment Panel (NCEP-ATP) III guidelines (17). Participants who were using lipid-lowering agent (n = 41) were excluded, as were participants whose CAC scores were not measured (n = 15).
Thus, in total, 1,854 asymptomatic participants (1,232 men and 622 women) were included in the analyses.
Cardiovascular risk factors
The medical history of myocardial infarction, angina, hyperten- sion, stroke, diabetes mellitus, smoking, and current medica- tion profile were determined by using a systemized question- naire. Body weight, height, body mass index (BMI), and blood pressure were also measured during the visit of each partici- pant. Total cholesterol, high-density lipoprotein cholesterol, low-density lipoprotein cholesterol, triglyceride, fasting plasma glucose, and serum creatinine levels, and white blood cell (WBC) counts were measured after a fasting period of at least 12 hours on the same day of examination.
Framingham risk score
The 10 year FRS of each participant was calculated on the basis of age, sex, total and high-density lipoprotein cholesterol levels, any smoking in the past years, blood pressure, and the use of antihypertensive medication by using the risk prediction func- tions of the NCEP-ATP III guidelines (17). The FRS predicts the 10 year risk of coronary events (fatal/nonfatal myocardial in- farction or sudden death). On the basis of the concurrent 10 year FRS, the participants were classified as very low risk (0%- 5% risk of an event within 10 years), low risk (5.1%-10%), inter- mediate risk (10.1%-20%), and high risk (> 20%).
Computed tomography and data acquisition
Computed tomographic examinations were performed with a
64-slice scanner VCT XT (General Electric, Milwaukee, WI, USA).
First, a CAC scan without contrast was performed, followed by CCTA. Subjects with a heart rate > 70 beats/min were given beta-blocking agents before scanning. Each subject was also given nitroglycerine 0.6 mg sublingually 1 minute before scan- ning. A standard scanning protocol was utilized with 64 × 0.625 mm slice collimation, 350 ms rotation time, 80-120 kV tube volt- age, and 500-800 mA tube current, depending on subject body habitus. All scans were performed by using electrocardiogram- gated dose modulation. A bolus of 80 mL iomeprol (Iomeron 400, Bracco, Milan, Italy) was injected intravenously (4 mL/sec), followed by a saline flush of 50 mL.
A region of interest was placed on the descending thoracic aorta and image acquisition was initiated automatically once a selected threshold (150 Hounsfield units [HU]) was reached, with bolus tracking. The electrocardiogram of each subject was recorded simultaneously to permit retrospective segmental data reconstruction. The images were initially reconstructed at the mid-diastolic phase (75% of the R-R interval) of the cardiac cy- cle. The mean radiation dose was 4.7 ± 1.6 mSv.
Computed tomographic data analysis
All data were analyzed on a remote workstation (Advantage Workstation; General Electric, Milwaukee, WI, USA). Each le- sion was identified by using a multiplanar reconstruction tech- nique and the maximum intensity projection of short-axis, two- chamber, and four-chamber views.
The contrast-enhanced portion of the coronary lumen was traced semi-automatically at the maximal stenotic site and com- pared to the mean value of the proximal and distal reference sites. A stenosis exceeding 50% was defined as significant. CAD was defined as significant (≥ 50%) luminal diameter stenosis of the coronary artery in the presence or absence of coronary cal- cium.
CAC scores were determined by using the previously describ- ed scoring system (18,19) and categorized in the following man- ner: no calcification, 0; mild calcification, 0.1-99.9; moderate calcification, 100-299.9; and severe calcification, ≥ 300.
Statistical analysis
Continuous variables were compared by using Student’s t-test or the Mann-Whitney U test, and categorical variables were com- pared by using χ2 or Fisher’s exact test, as appropriate. Baseline characteristics were compared on the basis of the presence of CAD. The distributions of CAC and the prevalence of CAD in the various FRS strata were compared by using χ2 test with Bon- ferroni multiple comparison post hoc analysis. The comparison was performed again after stratification by sex. The yield of scre- ening for CAD was assessed by determining the number need- ed to screen (NNS), which was calculated by dividing the total number of participants in each FRS stratum by the number of
people with CAD within that FRS stratum (15). The NNS de- fines the number of people who need to be screened to identify one asymptomatic individual with CAD in each FRS stratum.
Multivariate logistic regression analyses were conducted to de- termine the odds ratio (OR) of significant CAC and CAD in the FRS strata. Adjusting variables were BMI, glucose, and WBC count.
All statistical analyses were performed with SPSS (version 19.0 for Windows, SPSS, Inc., Chicago, IL, USA). All statistical tests were 2-tailed, and a P value < 0.05 was considered to be statistically significant.
Ethics statement
This retrospective study was undertaken after approval by the institutional review board (IRB No. 2012-0162) of the Asan Med- ical Center and the requirement for informed consent from in- dividual patients was waived.
RESULTS
Baseline characteristics
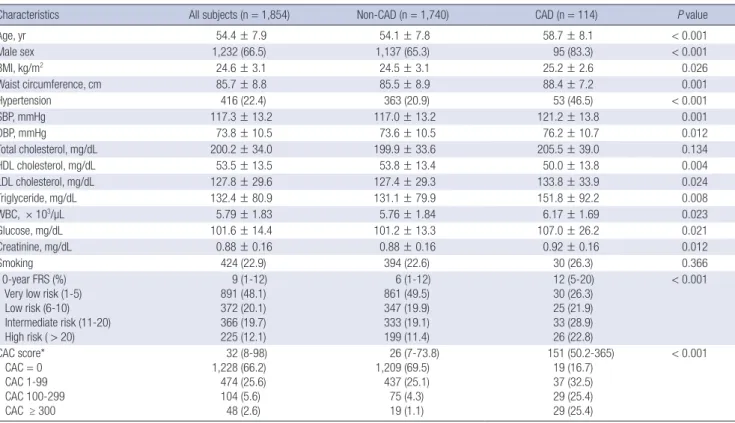
Table 1 shows the clinical characteristics of all subjects and the subjects with and without CAD. There were 114 participants with CAD (6.1%). The two groups differed significantly in terms
of most classical risk factors.
Distribution of CAC and prevalence of CAD in the various FRS strata
Table 2 shows the distributions and prevalence of the CAC score categories in the various FRS strata. The CAC scores rose signif- icantly as the FRS increased (all P for trend < 0.01).
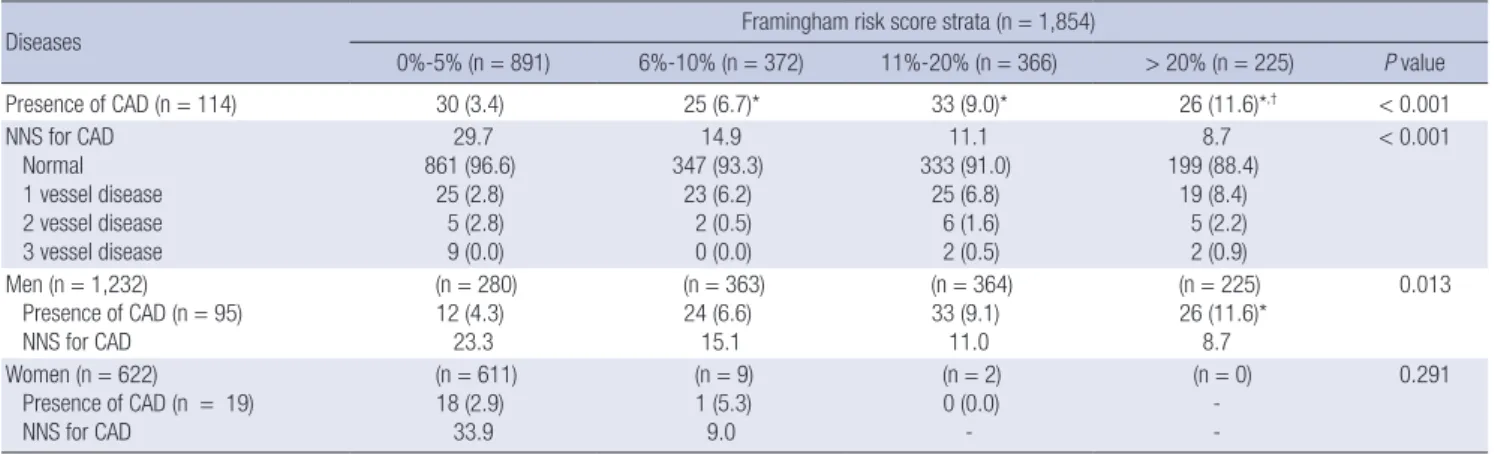
Table 3 shows the prevalence of CAD in the various FRS strata.
It was low in very low risk individuals (FRS ≤ 5%) but significant- ly higher in the low and intermediate risk FRS subjects. About half (48.2%) of the subjects with CAD belonged to the very low and low risk FRS strata. The NNS to detect one participant with CAD decreased as the FRS rose. When the data were further stratified by sex, the prevalence of CAD correlated persistently with FRS in men (P for trend = 0.013). However, a different pat- tern was observed for the women: almost all of the women (620, 99.7%) were stratified into the very low and low FRS groups, and all of the CAD cases in women were in the latter groups.
Of the individuals in the very low and low FRS strata, subjects with a CAC score of > 0 had a significantly higher prevalence of CAD (45/332, 13.6%) than the subjects with a CAC score of 0 (10/931, 1.1%) (P < 0.001, data not shown).
Table 1. Baseline characteristics of the whole study population and the subjects with and without coronary artery disease (CAD)
Characteristics All subjects (n = 1,854) Non-CAD (n = 1,740) CAD (n = 114) P value
Age, yr 54.4 ± 7.9 54.1 ± 7.8 58.7 ± 8.1 < 0.001
Male sex 1,232 (66.5) 1,137 (65.3) 95 (83.3) < 0.001
BMI, kg/m2 24.6 ± 3.1 24.5 ± 3.1 25.2 ± 2.6 0.026
Waist circumference, cm 85.7 ± 8.8 85.5 ± 8.9 88.4 ± 7.2 0.001
Hypertension 416 (22.4) 363 (20.9) 53 (46.5) < 0.001
SBP, mmHg 117.3 ± 13.2 117.0 ± 13.2 121.2 ± 13.8 0.001
DBP, mmHg 73.8 ± 10.5 73.6 ± 10.5 76.2 ± 10.7 0.012
Total cholesterol, mg/dL 200.2 ± 34.0 199.9 ± 33.6 205.5 ± 39.0 0.134
HDL cholesterol, mg/dL 53.5 ± 13.5 53.8 ± 13.4 50.0 ± 13.8 0.004
LDL cholesterol, mg/dL 127.8 ± 29.6 127.4 ± 29.3 133.8 ± 33.9 0.024
Triglyceride, mg/dL 132.4 ± 80.9 131.1 ± 79.9 151.8 ± 92.2 0.008
WBC, × 103/µL 5.79 ± 1.83 5.76 ± 1.84 6.17 ± 1.69 0.023
Glucose, mg/dL 101.6 ± 14.4 101.2 ± 13.3 107.0 ± 26.2 0.021
Creatinine, mg/dL 0.88 ± 0.16 0.88 ± 0.16 0.92 ± 0.16 0.012
Smoking 424 (22.9) 394 (22.6) 30 (26.3) 0.366
10-year FRS (%) Very low risk (1-5) Low risk (6-10) Intermediate risk (11-20) High risk ( > 20)
9 (1-12) 891 (48.1) 372 (20.1) 366 (19.7) 225 (12.1)
6 (1-12) 861 (49.5) 347 (19.9) 333 (19.1) 199 (11.4)
12 (5-20) 30 (26.3) 25 (21.9) 33 (28.9) 26 (22.8)
< 0.001
CAC score*
CAC = 0 CAC 1-99 CAC 100-299 CAC ≥ 300
32 (8-98) 1,228 (66.2) 474 (25.6) 104 (5.6)
48 (2.6)
26 (7-73.8) 1,209 (69.5)
437 (25.1) 75 (4.3) 19 (1.1)
151 (50.2-365) 19 (16.7) 37 (32.5) 29 (25.4) 29 (25.4)
< 0.001
Data are expressed as No. (%), mean ± standard deviation, or median (1st-3rd quartile).
CAD, coronary artery disease; BMI, body mass index; SBP, systolic blood pressure; DBP, diastolic blood pressure; HDL, high-density lipoprotein; LDL, low-density lipoprotein;
WBC, white blood cell; FRS, Framingham risk score; CAC, coronary artery calcium.
*Of those with CAC score > 0 and expressed as median (1st-3rd quartile).
Table 2. Distribution of coronary artery calcium (CAC) scores and numbers needed to screen (NNS) in the various Framingham risk score (FRS) strata
Calcium scores Framingham risk score strata (n = 1,854)
0%-5% (n = 891) 6%-10% (n = 372) 11%-20% (n = 366) > 20% (n = 225) P value
Median CAC score† 28 (5.5-98) 28 (8-89) 34.5 (8-91) 44 (14.2-144)
CAC score strata CAC = 0 CAC 1-99 CAC 100-299 CAC ≥ 300
714 (80.1) 135 (15.2) 29 (3.3) 13 (1.5)
217 (58.3) 120 (32.3) 27 (7.3)
8 (2.2)
187 (51.1) 139 (38.0) 26 (7.1) 14 (3.8)
110 (48.9) 80 (35.6) 22 (9.8) 13 (5.8)
< 0.001
CAC > 0 (n = 626) 177 (19.9) 155 (41.7)* 179 (48.9)* 115 (51.1)* < 0.001
NNS (CAC > 0) 5.0 2.4 2.0 2.0
CAC ≥ 100 (n = 152) 42 (4.7) 35 (9.4)* 40 (10.9)* 35 (15.6)* < 0.001
NNS (CAC ≥ 100) 21.2 10.6 9.2 6.4
CAC ≥ 300 (n = 48) 13 (1.5) 8 (2.2) 14 (3.8) 13 (5.8)* 0.001
NNS (CAC ≥ 300) 68.5 46.5 26.1 17.3
Values are median (1st-3rd quartile) or number (%). The P values were obtained by using χ2 test.
CAC, coronary artery calcium; NNS, number needed to screen to identify one individual with a CAC score above a specified CAC cut-off point, within each specified stratum; SD, standard deviation.
*P < 0.0083 versus very low Framingham risk score (1%-5%), as determined by Bonferroni multiple comparison post hoc analysis; †Of those with CAC score > 0.
Table 3. Prevalence of coronary artery disease and the number needed to screen in the various Framingham risk score strata
Diseases Framingham risk score strata (n = 1,854)
0%-5% (n = 891) 6%-10% (n = 372) 11%-20% (n = 366) > 20% (n = 225) P value
Presence of CAD (n = 114) 30 (3.4) 25 (6.7)* 33 (9.0)* 26 (11.6)*,† < 0.001
NNS for CAD Normal 1 vessel disease 2 vessel disease 3 vessel disease
29.7 861 (96.6)
25 (2.8) 5 (2.8) 9 (0.0)
14.9 347 (93.3)
23 (6.2) 2 (0.5) 0 (0.0)
11.1 333 (91.0)
25 (6.8) 6 (1.6) 2 (0.5)
8.7 199 (88.4)
19 (8.4) 5 (2.2) 2 (0.9)
< 0.001
Men (n = 1,232) Presence of CAD (n = 95) NNS for CAD
(n = 280) 12 (4.3)
23.3
(n = 363) 24 (6.6)
15.1
(n = 364) 33 (9.1)
11.0
(n = 225) 26 (11.6)*
8.7
0.013
Women (n = 622) Presence of CAD (n = 19) NNS for CAD
(n = 611) 18 (2.9)
33.9
(n = 9) 1 (5.3) 9.0
(n = 2) 0 (0.0)
-
(n = 0) - -
0.291
Values are number (%). The P values were obtained by using χ2 test.
CAD, coronary artery disease; NNS, number needed to screen to identify one individual with CAD, as detected by coronary computed tomography angiography, within each Fram- ingham risk score stratum.
*P < 0.0083 vs. very low Framingham risk score (0%-5%), as determined by Bonferroni multiple comparison post hoc analysis; †P < 0.0083 vs. low Framingham risk score (6%-10%), as determined by Bonferroni multiple comparison post hoc analysis.
Table 4. Prevalence of coronary artery disease and number needed to screen in the various coronary artery calcium (CAC) score strata
Diseases CAC score strata (n = 1,854)
CAC Score = 0 (n = 1,228) CAC Score 1-99 (n = 474) CAC Score 100-299 (n = 104) CAC Score ≥ 300 (n = 48) P value
Presence of CAD (n = 114) 19 (1.5) 37 (7.8)* 29 (27.9)*,† 29 (60.4)*,†,‡ < 0.001
NNS for CAD Normal 1 vessel disease 2 vessel disease 3 vessel disease
64.6 1209 (98.5)
18 (1.5) 1 (0.1) 0 (0.0)
12.8 437 (92.2)
31 (6.5) 4 (0.8) 2 (0.4)
3.6 75 (72.1) 26 (25.0) 3 (2.9) 0 (0.0)
1.7 19 (39.6) 17 (35.4) 10 (20.8) 2 (4.2)
< 0.001
Men (n = 1,232) Presence of CAD (n = 95) NNS for CAD
(n = 723) 16 (2.2)
45.2
(n = 386) 28 (7.3)*
13.8
(n = 80) 25 (31.3)*,†
3.2
(n = 43) 26 (60.5)*,†,‡
1.7 < 0.001
Women (n = 622) Presence of CAD (n = 19) NNS for CAD
(n = 505) 3 (0.6) 168.3
(n = 88) 9 (10.2)*
9.8
(n = 24) 4 (16.7)*
6.0
(n = 5) 3 (60.0)*,†
1.7
< 0.001
Values are number (%). The P values were obtained by χ2 test.
CAC, coronary artery calcium; CAD, coronary artery disease; NNS, number need to screen.
*P < 0.008 vs CAC score = 0 stratum, as determined by Bonferroni multiple comparison post hoc analysis; †P < 0.0083 versus CAC score 1-99 stratum, as determined by Bonferroni multiple comparison post hoc analysis; ‡P < 0.0083 versus CAC score 100-299 stratum, as determined by Bonferroni multiple comparison post hoc analysis.
Prevalence of CAD in various CAC score strata
Table 4 shows how the presence of CAD associates with CAC score strata. Of the subjects with a CAC score of > 0, 95 (15.2%) had significant coronary artery stenosis. In the moderate-severe CAC score stratum, the prevalence of CAD was 38.2%. The NNSs for CAD in the moderate and severe CAC score groups were 3.6 and 1.7, respectively. When stratified by sex, the prevalence of CAD increased significantly as the CAC score rose in both men and women. In the subgroup analysis of the patients with a CAC score of 0, 19 (1.5%) subjects had CAD. Most (16, 84%) were men.
These participants were classified in the very low (n = 5), low (n = 5), intermediate (n = 5), and high (n = 4) FRS groups.
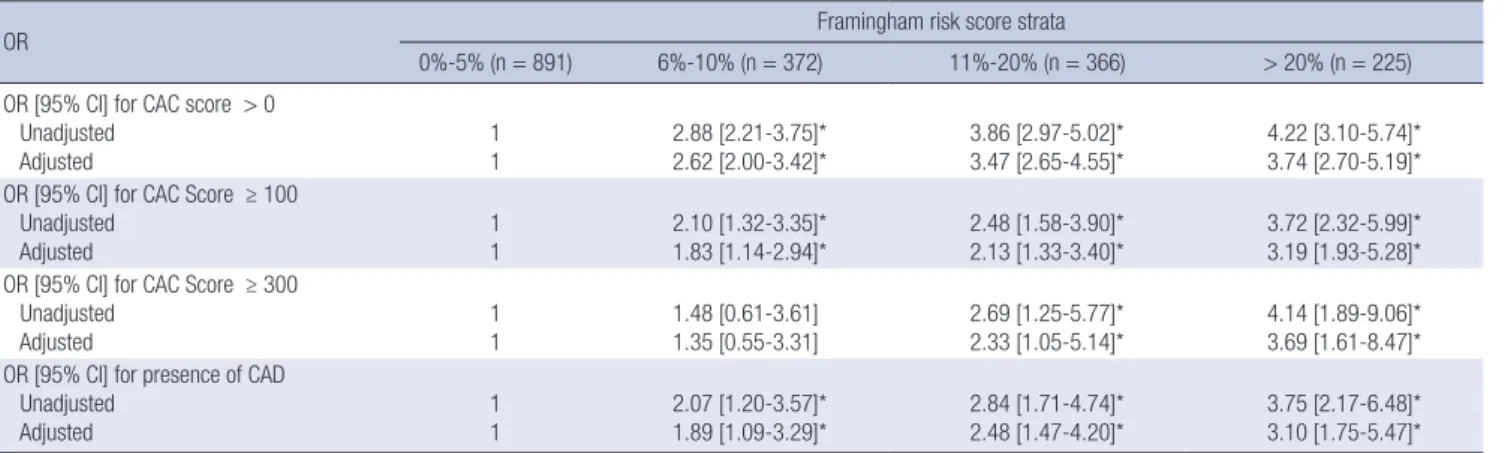
Multivariate logistic regression analysis of significant CAC scores and CAD according to FRS strata
In unadjusted analysis, compared to the very low risk group as a reference, the ORs for CAD were significantly high in the low, intermediate, and high risk FRS groups (Table 5). Furthermore, in multivariate logistic regression analysis adjusting for BMI, glucose, and WBC count, the low risk group (FRS 6%-10%) as well as the intermediate and high risk groups also had signifi- cantly increased ORs for occult CAD compared to the very low risk group (FRS ≤ 5%) (P < 0.05).
DISCUSSION
The major findings of the present study were: 1) a total of 6.1%
of participants had occult CAD that was detected by CCTA; 2) about half (48%) of those with CAD belonged to the very low and low FRS groups; 3) the distribution of CAC scores and the prevalence of occult CAD associated significantly with 10 year FRS strata in men but not in women, because almost all of the women were classified into very low and low FRS groups; 4) in multivariate analysis, the low risk group as well as the interme-
diate and high risk groups had significantly increased ORs for occult CAD when compared to the very low risk group.
The FRS is suggested to be the first step in CAD assessment and to serve as a gatekeeper for imaging modalities, such as CAC scoring and CCTA (13,14). Current guidelines recommend that CAC scoring should only be used in the intermediate CAD risk population, namely, those whose estimated 10 year risk (FRS) is between 10% and 20% (9). However, several studies suggest that it may not be appropriate to base treatment strategies on FRS alone; recent studies also revealed that CAC scoring and CCTA may reclassify persons into more appropriate risk catego- ries, thereby providing a better insight into the occult CAD in apparently healthy individuals (16,20,21). Moreover, one of the multi-ethnic study of atherosclerosis (MESA) studies reported that the yield of screening for advanced CAC burden (CAC ≥ 300) is higher in low to intermediate risk individuals, namely, those with an FRS of 5.1%-20.0% (15).
In the present study, the NNS was used as a tool to evaluate the yield of screening for occult CAD across FRS and CAC score strata, similar to another study (17). Regarding the individuals with occult CAD in the present study, the NNS decreased sig- nificantly as the FRS became more severe. However, when strat- ified by sex, the only significant difference was the difference between very low and high FRS strata in men. Moreover, it is difficult to use FRS for women because almost all of the women in the present study were classified into the very low and low risk FRS strata. After using CAC scoring to stratify the same pop- ulation, the NNS was 64.6 and 12.8 for individuals with CAC scores of 0 and 1-99, respectively, and 3.6 and 1.7 for those with CAC scores of 100-299 and ≥ 300, respectively. Thus, there was a 38-fold difference in the NNSs for occult CAD between CAC scores of 0 and ≥ 300, and a 5-fold difference in the NNSs of CAC scores of 0 and 1-99. These trends remained significant af- ter stratification of the basis of sex. This suggests that the yield Table 5. Multivariate logistic regression analysis of significant coronary artery calcium (CAC) score and the presence of coronary artery disease in the various Framingham risk score strata
OR Framingham risk score strata
0%-5% (n = 891) 6%-10% (n = 372) 11%-20% (n = 366) > 20% (n = 225) OR [95% CI] for CAC score > 0
Unadjusted
Adjusted 1
1 2.88 [2.21-3.75]*
2.62 [2.00-3.42]* 3.86 [2.97-5.02]*
3.47 [2.65-4.55]* 4.22 [3.10-5.74]*
3.74 [2.70-5.19]*
OR [95% CI] for CAC Score ≥ 100 Unadjusted
Adjusted
1 1
2.10 [1.32-3.35]*
1.83 [1.14-2.94]*
2.48 [1.58-3.90]*
2.13 [1.33-3.40]*
3.72 [2.32-5.99]*
3.19 [1.93-5.28]*
OR [95% CI] for CAC Score ≥ 300 Unadjusted
Adjusted
1 1
1.48 [0.61-3.61]
1.35 [0.55-3.31]
2.69 [1.25-5.77]*
2.33 [1.05-5.14]*
4.14 [1.89-9.06]*
3.69 [1.61-8.47]*
OR [95% CI] for presence of CAD Unadjusted
Adjusted
1 1
2.07 [1.20-3.57]*
1.89 [1.09-3.29]*
2.84 [1.71-4.74]*
2.48 [1.47-4.20]*
3.75 [2.17-6.48]*
3.10 [1.75-5.47]*
Model adjusted for body mass index, glucose, and white blood cell count.
OR, odds ratios; CI, confidence interval; CAC, coronary artery calcium; CAD, coronary artery disease.
*P value < 0.05.
of screening is substantially different for individuals with a CAC score of 0 compared to those with a CAC score of more than 0.
This result is consistent with the observations of the previous study from MESA (4,22).
In addition, multivariable analysis did not show a significant correlation between the FRS strata and the prevalence of occult CAD. Compared to the very low risk group (FRS ≤ 5%), the low risk group (FRS 6%-10%), along with the intermediate and high risk groups, had a significantly increased OR for occult CAD. By contrast, when compared to CAC score of 0 as the reference stratum, the ORs for occult CAD increased significantly as the CAC score became more severe (supplement Table). This find- ing also suggests that CAC scoring outperforms FRS in terms of screening an asymptomatic population for occult CAD.
Although coronary angiography is generally accepted as the gold standard for diagnosing the presence of CAD, it is difficult to use coronary angiography as a screening test for asymptom- atic individuals because of its highly invasive nature. Instead, CCTA has been proposed as a powerful noninvasive diagnostic test for visualizing the coronary arteries and the manifestations of coronary atherosclerosis (23). The prevalence of CAD in the asymptomatic population, as detected by CCTA, is approximate- ly 5%-7% (21). Similarly, the prevalence of CCTA-detected oc- cult CAD in the present study was 6.1%, which indicates that the prevalence of occult CAD in apparently healthy individuals is not negligible. However, it is questionable whether CCTA could be a routine screening modality because of problems relating to radiation exposure and cost-effectiveness.
The present study had several limitations. First, all participants underwent a general health evaluation, which suggests that a selection bias may have been present. Second, all participants were from the same ethnic background and lived in the same geographical region. Therefore, the generalizability of the find- ings of the present study to the worldwide population may be limited. Finally, it remains possible that some of the CAD cases detected by CCTA were not true lesions because CT has the tendency to overestimate the severity of luminal stenosis and image artifacts are the major cause of false-positive and false- negative interpretations, as we did not perform invasive coro- nary angiography in the subjects with CCTA-detected CAD.
In conclusion, the 10 year FRS estimate is of limited useful- ness as a screening modality for coronary atherosclerosis in an asymptomatic population because approximately half of the individuals with CCTA-detected occult CAD were misclassified into very low and low risk groups on the basis of FRS. Moreover, almost all women, including those with CAD, were classified into these groups and therefore, FRS did not associate indepen- dently with the presence of CAD. By contrast, CAC scoring as- sociated significantly with occult CAD in both men and wom- en. This study also showed that the yield of screening for signifi- cant CAC scoring and occult CAD was low in the very low risk
population but rose in the low and intermediate risk subjects.
These findings suggest that CAC scoring may be useful screen- ing tools for identifying subjects with occult CAD in the low and intermediate risk populations.
DISCLOSURE
The authors have no potential conflicts of interest to disclose.
AUTHOR CONTRIBUTION
Study concept and design: Kim WJ, Kwon CH, Park SJ. Study implementation, analysis and interpretation of data: Kim WJ, Kwon CH, Han SB, Kang JW, Park SJ. Drafting of article or criti- cal revision: Kim WJ, Kwon CH, Han SB. Final approval of the version to be published: all authors.
ORCID
Won-Jang Kim http://orcid.org/0000-0002-9915-3722 Chang Hee Kwon http://orcid.org/0000-0001-8716-1146 Seungbong Han http://orcid.org/0000-0003-2938-8072 Woo Seok Lee http://orcid.org/0000-0003-0250-1266 Joon Won Kang http://orcid.org/0000-0001-5756-3814 Jung-Min Ahn http://orcid.org/0000-0003-4031-391X Jong-Young Lee http://orcid.org/0000-0002-0092-9958 Duk-Woo Park http://orcid.org/0000-0001-6643-0239 Soo-Jin Kang http://orcid.org/0000-0003-1115-6097 Seung-Whan Lee http://orcid.org/0000-0002-9301-8183 Young-Hak Kim http://orcid.org/0000-0002-5956-1254 Cheol Whan Lee http://orcid.org/0000-0002-9185-6669 Seong-Wook Park http://orcid.org/0000-0001-7371-4336 Seung-Jung Park http://orcid.org/0000-0002-9187-5405
REFERENCES
1. Tunstall-Pedoe H, Morrison C, Woodward M, Fitzpatrick B, Watt G. Sex differences in myocardial infarction and coronary deaths in the Scottish MONICA population of Glasgow 1985 to 1991. Presentation, diagnosis, treatment, and 28-day case fatality of 3991 events in men and 1551 events in women. Circulation 1996; 93: 1981-92.
2. Wilson PW, D’Agostino RB, Levy D, Belanger AM, Silbershatz H, Kannel WB. Prediction of coronary heart disease using risk factor categories. Cir- culation 1998; 97: 1837-47.
3. Brindle P, Beswick A, Fahey T, Ebrahim S. Accuracy and impact of risk as- sessment in the primary prevention of cardiovascular disease: a system- atic review. Heart 2006; 92: 1752-9.
4. Lakoski SG, Greenland P, Wong ND, Schreiner PJ, Herrington DM, Kro- nmal RA, Liu K, Blumenthal RS. Coronary artery calcium scores and risk for cardiovascular events in women classified as “low risk” based on Fram- ingham risk score: the multi-ethnic study of atherosclerosis (MESA). Arch Intern Med 2007; 167: 2437-42.
5. Greenland P, LaBree L, Azen SP, Doherty TM, Detrano RC. Coronary ar- tery calcium score combined with Framingham score for risk prediction in asymptomatic individuals. JAMA 2004; 291: 210-5.
6. Detrano R, Guerci AD, Carr JJ, Bild DE, Burke G, Folsom AR, Liu K, Shea S, Szklo M, Bluemke DA, et al. Coronary calcium as a predictor of coronary events in four racial or ethnic groups. N Engl J Med 2008; 358: 1336-45.
7. Shaw LJ, Raggi P, Schisterman E, Berman DS, Callister TQ. Prognostic val- ue of cardiac risk factors and coronary artery calcium screening for all- cause mortality. Radiology 2003; 228: 826-33.
8. Hamon M, Biondi-Zoccai GG, Malagutti P, Agostoni P, Morello R, Valgimi- gli M, Hamon M. Diagnostic performance of multislice spiral computed tomography of coronary arteries as compared with conventional inva- sive coronary angiography: a meta-analysis. J Am Coll Cardiol 2006; 48:
1896-910.
9. Ferket BS, Genders TS, Colkesen EB, Visser JJ, Spronk S, Steyerberg EW, Hunink MG. Systematic review of guidelines on imaging of asymptomat- ic coronary artery disease. J Am Coll Cardiol 2011; 57: 1591-600.
10. Bluemke DA, Achenbach S, Budoff M, Gerber TC, Gersh B, Hillis LD, Hun- dley WG, Manning WJ, Printz BF, Stuber M, et al. Noninvasive coronary artery imaging: magnetic resonance angiography and multidetector com- puted tomography angiography: a scientific statement from the Ameri- can Heart Association committee on cardiovascular imaging and inter- vention of the council on cardiovascular radiology and intervention, and the councils on clinical cardiology and cardiovascular disease in the young.
Circulation 2008; 118: 586-606.
11. Chow BJ, Larose E, Bilodeau S, Ellins ML, Galiwango P, Kass M, Sheth T, Jassal DS, Kirkpatrick ID, Mancini GB, et al. The ‘what, when, where, who and how?’ of cardiac computed tomography in 2009: guidelines for the clinician. Can J Cardiol 2009; 25: 135-9.
12. Hendel RC, Patel MR, Kramer CM, Poon M, Hendel RC, Carr JC, Gerstad NA, Gillam LD, Hodgson JM, Kim RJ, et al. ACCF/ACR/SCCT/SCMR/
ASNC/NASCI/SCAI/SIR 2006 appropriateness criteria for cardiac com- puted tomography and cardiac magnetic resonance imaging: a report of the American College of Cardiology Foundation Quality Strategic Direc- tions Committee Appropriateness Criteria Working Group, American College of Radiology, Society of Cardiovascular Computed Tomography, Society for Cardiovascular Magnetic Resonance, American Society of Nuclear Cardiology, North American Society for Cardiac Imaging, Soci- ety for Cardiovascular Angiography and Interventions, and Society of In- terventional Radiology. J Am Coll Cardiol 2006; 48: 1475-97.
13. Budoff MJ, Achenbach S, Blumenthal RS, Carr JJ, Goldin JG, Greenland P, Guerci AD, Lima JA, Rader DJ, Rubin GD, et al. Assessment of coronary artery disease by cardiac computed tomography: a scientific statement
from the american heart association committee on cardiovascular imag- ing and intervention, council on cardiovascular radiology and interven- tion, and committee on cardiac imaging, council on clinical cardiology.
Circulation 2006; 114: 1761-91.
14. Oudkerk M, Stillman AE, Halliburton SS, Kalender WA, Möhlenkamp S, McCollough CH, Vliegenthart R, Shaw LJ, Stanford W, Taylor AJ, et al. Cor- onary artery calcium screening: current status and recommendations from the European Society of Cardiac Radiology and North American Society for Cardiovascular Imaging. Eur Radiol 2008; 18: 2785-807.
15. Okwuosa TM, Greenland P, Ning H, Liu K, Bild DE, Burke GL, Eng J, Lloyd- Jones DM. Distribution of coronary artery calcium scores by Framing- ham 10-years risk strata in the MESA (Multi-Ethnic Study of Atheroscle- rosis) potential implications for coronary risk assessment. J Am Coll Car- diol 2011; 57: 1838-45.
16. Johnson KM, Dowe DA. The detection of any coronary calcium outper- forms Framingham risk score as a first step in screening for coronary ath- erosclerosis. AJR Am J Roentgenol 2010; 194: 1235-43.
17. Expert Panel on Detection, Evaluation, and Treatment of High Blood Cho- lesterol in Adults. Executive summary of the third report of the national cholesterol education program (NCEP) expert panel on detection, evalu- ation, and treatment of high blood cholesterol in adults (Adult Treatment Panel III). JAMA 2001; 285: 2486-97.
18. Agatston AS, Janowitz WR, Hildner FJ, Zusmer NR, Viamonte M Jr, Detra- no R. Quantification of coronary artery calcium using ultrafast computed tomography. J Am Coll Cardiol 1990; 15: 827-32.
19. Rumberger JA, Brundage BH, Rader DJ, Kondos G. Electron beam com- puted tomographic coronary calcium scanning: a review and guidelines for use in asymptomatic persons. Mayo Clin Proc 1999; 74: 243-52.
20. Elias-Smale SE, Proença RV, Koller MT, Kavousi M, van Rooij FJ, Hunink MG, Steyerberg EW, Hofman A, Oudkerk M, Witteman JC. Coronary cal- cium score improves classification of coronary heart disease risk in the elderly: the Rotterdam study. J Am Coll Cardiol 2010; 56: 1407-14.
21. Choi EK, Choi SI, Rivera JJ, Nasir K, Chang SA, Chun EJ, Kim HK, Choi DJ, Blumenthal RS, Chang HJ. Coronary computed tomography angiogra- phy as a screening tool for the detection of occult coronary artery disease in asymptomatic individuals. J Am Coll Cardiol 2008; 52: 357-65.
22. Michos ED, Vasamreddy CR, Becker DM, Yanek LR, Moy TF, Fishman EK, Becker LC, Blumenthal RS. Women with a low Framingham risk score and a family history of premature coronary heart disease have a high prev- alence of subclinical coronary atherosclerosis. Am Heart J 2005; 150: 1276- 81.
23. Achenbach S. Computed tomography coronary angiography. J Am Coll Cardiol 2006; 48: 1919-28.
Supplement Table 1. Univariate and Multivariable Odds Ratios and 95% confidence intervals of coronary artery calcium (CAC) score category for presence of obstructive coro- nary artery disease (CAD) among the various Framingham risk score strata
OR [95% CI] of presence of CAD Framingham Risk Score Strata
0%-5% P value 6%-10% P value 11%-20% P value > 20% P value
Unadjusted CAC = 0 1 1 1 1
CAC Score 1-99 12.58 [4.29-36.83] < 0.001 3.03 [0.97-9.48] 0.057 3.13 [1.06-9.22] 0.038 2.54 [0.72-8.99] 0.14 CAC Score 100-299 36.99 [10.52-130.06] < 0.001 12.11 [3.41-43.08] < 0.001 22.75 [6.93-74.71] < 0.001 12.37 [3.23-47.33] < 0.001 CAC Score ≥ 300 226.88 [54.73-940.51] < 0.001 127.20 [20.41-792.64] < 0.001 36.40 [9.22-143.78] < 0.001 42.40 [9.48-189.72] < 0.001
Adjusted CAC = 0 1 1 1 1
CAC Score 1-99 7.46 [2.39-23.24] < 0.001 3.34 [1.00-11.12] 0.050 2.92 [0.93-9.13] 0.066 2.18 [0.57-8.28] 0.25 CAC Score 100-299 20.18 [5.05-80.71] < 0.001 17.06 [4.09-71.09] < 0.001 20.79 [5.76-75.02] < 0.001 11.65 [2.73-49.62] 0.001 CAC Score ≥ 300 84.69 [18.09-396.63] < 0.001 179.39 [23.59-1364.47] < 0.001 42.39 [8.76-205.1] < 0.001 48.17 [8.51-272.58] < 0.001 Model adjusted for age, sex, body mass index, total cholesterol, whole blood cell count, and hypertension.
OR indicates odds ratios; CI, confidence interval; CAC, coronary artery calcium; CAD, coronary artery disease.