서 론
방사선치료기술이 발전함에 따라 치료계획 시 킬로볼트 전산화 단층촬영(kilovoltage-computed tomography,
KVCT)을 통해 얻은 영상을 바탕으로 3차원 이상의 방사 선 치료 계획을 세우고 이를 치료에 적용하는 경우가 많다.
CT촬영 시 X선이 환자를 투과하고 남은 광자의 양을 측정 하여 재구성 통해 영상을 얻게 된다.(1) 이러한 CT 영상을 통해 Axial Image를 획득하여 체적을 3차원으로도 구현 할 수 있어 치료 계획 시 정상조직에는 최소한의 선량 및 종양 조직에 최대한 선량을 주는 정확한 치료계획이 가능
책임저자 : 권동열, 삼성서울병원 서울특별시 강남구 일원로 81 Tel : 02) 6190-5203
E-mail : [email protected]
두경부 양성자 치료계획 시 MVCT를 이용한 Metal Volume 평가 및 양성자 선량분포 평가
삼성서울병원 방사선종양학과 서성국·권동열·박세준·박용철·최병기
목 적 : 두경부 방사선 치료 시 Dental Implant에 의한 Metal Artifact로 인해 보철물의 크기, 모양 및 Volume 이 달라지고 이로 인해 타겟 및 주변 정상조직에 대한 방사선치료계획의 정확성이 떨어진다. 본 연구는 치아크 기를 재현한 Metal을 KVCT, SMART-MAR CT, MVCT를 통해 영상을 획득 하여 Volume을 평가하고 양성자 치료계획에 적용시켜 선량분포의 차이를 분석해 보고자 한다.
대상 및 방법 : 치과에서 치료하는 방법을 고려하여 인레이, 크라운, 브릿지와 비슷한 크기의 A보철물(0.5×
0.5×0.5 cm), B보철물(1×1×1 cm), C보철물(1×2×1 cm)을 저용융점납합금(Cerrobend, 9.64 g/cm3) 사용 하여 제작하였다. In House Head & Neck Phantom 안에 보철물를 위치시키고 CT Simulator(Discovery CT 590RT, GE, USA)를 이용해 Slice thickness 1.25 mm로 KVCT 영상과 SMART-MAR 영상을 획득하였 다. MVCT 영상은 RADIXACT® Series(Accuray Pricision®, USA)을 이용해 동일한 방법으로 획득하였다.
MVCT, SMART-MAR CT, KVCT를 통해 획득한 보철물의 형상을 전산화 치료계획장비 Pinnacle(Ver 9.10, Philips, Palo Alto, USA)의 Autocontour Thresholds Raw Values를 통해 X, Y, Z축의 크기 및 Volume을 비 교하였다. 양성자 치료계획은 위의 실험에서 얻은 보철물B(1×1×1 cm)의 각 CT별 치아 Contour를 KVCT 상에 fusion하여 양성자 치료계획(Ray station 5.1, RaySearch, USA)을 세우고 선량의 차이를 비교 평가하였다.
결 과 : 실측 사이즈 대비 A보철물(MVCT : 1.0배, SMART-MAR CT : 1.84배, KVCT : 1.92배), B보철물 (MVCT : 1.02배, SMART-MAR CT : 1.47배, KVCT : 1.82배), C보철물(MVCT : 1.0배, SMART-MAR CT : 1.46배, KVCT : 1.66배)로 각 크기의 보철물에서 MVCT가 가장 실제 Volume과 유사하게 측정되었다. 양성자 치료계획에서 B보철물의 Volume을 각각 적용하여 측정한 결과 D99 % volume의 선량이 기준 3082 CcGE 대 비 MVCT:3094 CcGE, SMART-MAR CT:2902 CcGE, KVCT:2880 CcGE로 측정되었다.
결 론 : 전체적인 Volume과 X축 Z축의 크기는 MVCT에서 실제 크기와 가장 일치했고 superior-Inferior방 향인 Y축은 CT에 따라 차이 없이 길이가 일정했다. 두경부 양성자 치료 시 보철물의 크기, 모양 및 Volume이 비슷한 MVCT에서 가장 실제 값과 비슷한 선량분포를 보였고 MVCT를 이용한 보철물의 contour를 KVCT에 fusion하여 양성자치료계획에 적용 시 매우 유용할 것으로 사료된다.
▶ 핵심용어 : Dental Implant, Metal Artifact, SMART-MAR, MVCT, Proton
하다.(2)
최근 두경부암 환자의 치료 계획 시 치아 치료를 위한 Metal 재질의 Dental Implant를 시술한 환자들이 많아짐 에 따라 CT영상에서도 이러한 Metal Artifact로 인하여 영상이 왜곡되는 경우가 발생하고 있다. 이러한 Artifact는 Beam hardening effect에 의해 광자의 전달양은 현저히 줄어들게 되고 이는 금속 물질 주변으로 Streaking Ar- tifacts를 야기하여 금속 물질의 정확한 묘사와 주변 해부 학적 구조의 구분을 어렵게 한다.(3) 이러한 Metal Artifact 를 줄여주기 위해 Metal Artifact Reduction Algorithm 을 이용한 MAR(Metal Artifact Reduction) CT의 적용 에 관한 연구와 메가볼트 전산화 단층촬영(Megavoltage computed tomography, MVCT)을 이용한 환자 영상 획 득을 통해 Metal Artifact를 줄여줄 수 있다는 연구 결과 발표도 있지만 Metal Artifact 주변의 HU값 차이에 대한 연구들이 대부분이다.(4-6)
본 연구의 목적은 두경부암 환자 환자를 대상으로 치아 부분의 보철물의 크기를 재현한 Metal(Real Size)로 제작 하고 MVCT, SMART-MAR CT, KVCT를 통해 영상을 획 득 하여 Metal(Real Size)의 고밀도 보철물이 각각의 CT 에 따라 크기, 모양 및 Volume값이 어떤 차이를 갖는지 알아보고 양성자 치료에서의 매질의 밀도와 크기에 의해 Stopping power의 계산이 달라질 수 있으므로 각각의 CT에서 획득한 Metal contour를 KVCT에 fusion하여 양 성자 치료계획 시 유용성을 평가하고자 한다.(7-8)
대상 및 방법
1. 실험재료
- CT Simulator (Discovery CT 590 RT, GE, USA) - RADIXACT® Series (Accuray Pricision®, USA) - 저 용융점 납 합금 (Cerrobend, 9.64 g/cm3) - In House Head and Neck Phantom - Pinnacle (Ver 9.10, Philips, Palo Alto, USA) - Ray station 5.0 (Raysearch, USA)
2. 실험방법 1) Phantom study
치아 치료 시 재료는 고밀도의 보철물과 비슷한 밀도를 갖는 대체물질로 저 용융점 납합금(Cerrobend, 9.64 g/
cm3)을 실험에 사용하였다. 보철물의 형태는 치아치료에 대표적인 Inray와 Crown, Bridge의 모양을 대체할 수 있 게 사각형모양으로 A(0.5×0.5×0.5 cm), B(1×1×1 cm), C(1
×2×1 cm)의 크기로 각각 제작하여 하였다(Fig. 1).
제작된 금속 물질을 본원에서 자제 제작된 두경부 전용 In House Head and neck Phantom의 hole 안에 위치시 키고 빈 부분에는 물을 채운 후 CT Simulator(High Ad- vantage, GE, USA)를 이용해 촬영 조건 120 kv, 350 mA, Slice thickness: 1.25 mm로 KVCT 영상과 SMART- MAR 영상을 획득하였다. MVCT 영상은 RADIXACT®
Series(Accuray Pricision®, USA)을 이용해 Standard
(a) Metal Block (b) In House Head & Neck Phantom(SMC) Fig. 1. Cerrobend block : Inray : A(0.5×0.5×0.5 cm), Crown : B(1×1×1 cm), Bridg : C(1×2×1 cm)
Algorithm, Slice thickness : 1 mm로 측정하였다(Fig. 2).
KVCT, SMART-MAR CT, MVCT를 통해 획득한 물 질(A, B, C)의 형상을 전산화치료계획장비 Pinnacle(Ver 9.10, Philips, Palo Alto, USA)의 Autocontour Thresh- olds Raw Values(Lower 4000, Upper 4300)를 통해 contouring하여 X(right-left), Y(superior-inferior), Z(anterior-posterior)의 크기 및 Volume을 비교하였다 (Fig. 3).
2) Patient study
가상으로 Dental Implant의 Volume을 Fusion하기 위 해 본원에서 양성자 치료를 받은 두경부(Oral Cavity) 환 자 중 Dental Implant가 없는 1명을 선정하고 MVCT를 통해 얻어진 B(1×1×1 cm)의 Volume Contour와 KVCT, SMART-MAR CT를 통해 얻어진 B(1×1×1 cm)의 Vol- ume Contour를 치아에 Fusion하여 양성자 치료계획 장 비 Ray station 5.1(RaySearch, USA)을 이용하여 각각의 contour에 실제 보철물의 밀도 값(lead : 9.64 g/cm3)을 적용한 후 치료계획을 세웠다(Fig. 4).
치료계획은 Monte Calo Algorithm으로 Beam angle 315°, 270°을 설정하였으며 치료 technique은 Smitomo 사의 Line scanning 방식을 적용하여 CTV에 처방선량 220 CcGE×27 Fx = 5940 CcGE을 주었다. 선량평가는 CTV 내 D95 %, D99 % 평가하고 Dose uniformity는 Ho- mogeneity Index (H.I)(Table 1), Target conformity는 Conformity Index (C.I)(Table 2)를 통해 선량비교 및 분 석하였다.
Table 1. Homogeneity index Homogeneity
index
Dx/D100-x
Dx : Dose at x % volume
Table 2. Conformity index
Conformity index
TVRI/VRI
TVRI : Target volume covered by the reference isodose
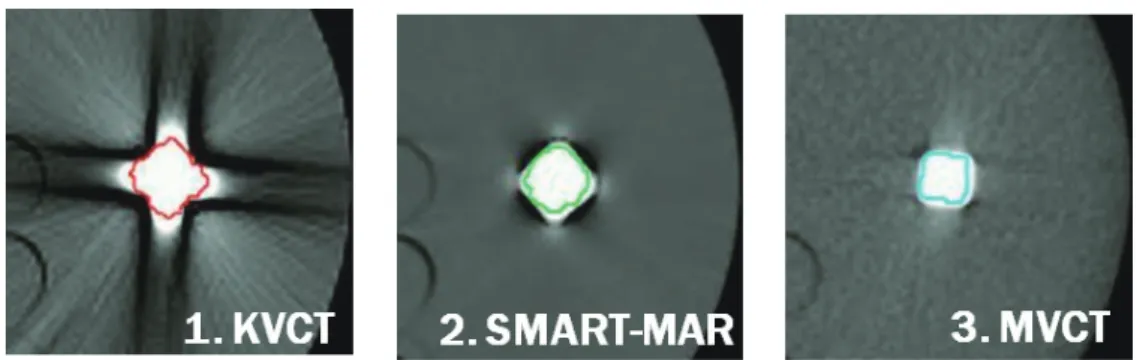
VRI : Volume of the reference isodosec Fig. 2. Axial CT image with Metal B(1×1×1 cm) in Head & Neck In House Phantom. 1 : Auto contour- ing Metal B on KVCT, 2 : Auto contouring Metal B on MAR CT 3. Auto contouring Metal B on MVCT
Fig. 3. X(right-left), Y(superior-inferior), Z(anterior-pos-
terior) Fig. 4. KVCT Axial Image with Metal Contour from each CT
결 과
1. Phantom Study
실측 대비 Volume 평가는 A보철물의 체적(Volume : 0.125 cm3)은 MVCT에서는 1.04배(Vol : 0.13 cm3),
SMART-MAR CT에서는 1.84배(Vol : 0.23 cm3), KVCT 에서는 1.92배(Vol : 0.24 cm3)로 측정되었다. B보철물의 체적(Volume : 1 cm3)은 MVCT 1.02배(Vol : 1.02 cm3), SMART-MAR CT 1.47배(Vol : 1.47 cm3), KVCT 1.82배 (Vol : 1.82 cm3)로 측정되었다. C보철물의 체적(Volume : 2 cm3)은 MVCT 1.0배(Vol : 1.99 cm3), SMART-MAR CT 1.46배(Vol : 2.92 cm3), KVCT 1.66배(Vol : 3.32 cm3) 로 측정되었으며 각 크기의 보철물에서 MVCT가 가장 실 제 체적과 유사한 크기로 측정됨을 알 수 있었다(Fig. 5).
X, Y, Z방향의 길이는 A보철물의 크기(0.5×0.5×0.5 cm)일 때 MVCT에서는 (0.61×0.6×0.53 cm), SMART- MAR CT에서는 (0.87×0.62×0.88 cm), KVCT에서 (1.02
×0.5×1.15 cm)로 측정되었고 B보철물(1×1×1 cm)일 때 MVCT(1.14×1.01×1.05 cm), SMART-MAR CT(1.45×0.99
×1.56 cm), KVCT(1.8×1×1.86 cm)로 측정되었고 C보철 물(1×2×1 cm)일 때 MVCT(1.07×2×1.15 cm), SMART- MAR CT(1.52×2×1.55 cm), KVCT(1.85×1.99×1.79 cm) 로 측정되었다.
X, Z 축의 방향에서 실측 대비 MVCT의 경우 1.13배, 1.09배 SMART-MAR CT의 경우 1.54배, 1.58배 KVCT의 경우 1.87배, 1.92배로 MVCT에서 가장 실제 사이즈와 유 사한 크기로 측정됨을 알 수 있었다. Y축의 방향에서는 실 측 대비 MVCT의 경우 1.03배 SMART-MAR CT의 경우 1.03배 KVCT의 경우 0.99배로 각각의 CT별 큰 차이를 보 이지 않았다(Fig. 6, 7).
Fig. 5. Metal Volume Evaluation base on MVCT, MAR, KVCT Image
Fig. 7. Metal A, B, C Size(Y length) Evaluation base on MVCT, MAR, KVCT Image
Fig. 6. Metal A, B Size(X, Z length) Evaluation base on MVCT, MAR, KVCT Image
2. Patient study
B보철물(1×1×1 cm)의 실제 (a) Real Volume을 적용 하였을 경우 CTV 내 선량분포는 D99 %(3082 CcGE), D98
%(3431 CcGE), D95 %(5272 CcGE), Average(5458 CcGE), D50(5531 CcGE)로 측정되었으며 이를 기준이 되는 선량 분포로 정하였다(Fig. 8). MVCT를 통해 얻어진 Volume을 적용하였을 경우 CTV 내 선량분포는 D99 %에서 기준 선량 분포 대비 0.3 % 선량증가를 보였으며 D95 %에서는 0.2 %
의 선량증가를 보여 실제 체적을 기준으로 측정된 선량과 가장 일치하는 결과를 얻을 수 있었다. SMART-MAR CT 를 통해 얻어진 Volume을 적용하였을 경우 CTV 내 선량 분포는 D99 %에서 5.9 % 선량감소를 보였으며 D95 %에서는 3.2 % 선량감소 값을 얻었고 KVCT를 통해 얻어진 Vol- ume을 적용하였을 경우 CTV 내 선량분포는 D99 %에서 6.6 % 선량감소를 보였으며 D95 %에서는 5.7 % 선량감소 값 을 얻을 수 있었다(Fig. 8, 9).
각각의 CT 영상에서 얻어진 금속물질의 contour를 적 용하여 CTV영역의 H.I값을 분석한 결과 B보철물(1×1×1 cm)의 실제 (a) Real Volume contour을 적용한 경우에 는 0.6의 H.I값을 얻을 수 있었고 MVCT, MAR CT, KVCT 에서 측정된 Metal Volume contour를 적용한 경우 각각 0.6, 0.54, 0.53의 값을 얻을 수 있었다. C.I값의 경우에는 실제 (a) Real Volume contour를 적용한 경우에는 0.69 의 C.I값을 얻을 수 있었고 MVCT, SMART-MAR CT, KVCT에서 측정된 Metal Volume contour를 적용한 경 우 각각 0.69, 0.69, 0.68의 값을 얻을 수 있었다(Table 3).
고안 및 결론
Phantom study에서 MVCT, SMART-MAR CT, KVCT 영상의 3가지 Metal Volume을 보면 MVCT를 이 용하여 측정된 Metal Volume이 실제 Volume과 가장 유사하였고 SMART-MAR CT와 KVCT를 이용하여 얻 은 Metal Volume의 경우에는 실제 Metal Volume보다 1.57배, 1.77배로 더 커졌음을 알 수 있다. 보철물(A, B, C) 의 X, Z축의 길이의 비교한 결과는 Real에 가장 가까운 영상은 MVCT(X : 1.13배, Z: 1.09배)로 차이가 없었지만 SMART-MAR CT(X : 1.53배, Z: 1.58배), KVCT(X : 1.87 Fig. 8. Dose difference base on each contour. (a): Real
size Metal contour fusion, (b): Metal contour fusion base on MVCT, (c): Metal contour fusion base on MAR, (d): Metal contour fusion base on KVCT
Table 3. Comparison of homogeneity index and confor- mity index
C.I H.I
Real 0.69 0.6
MVCT 0.69 0.6
MAR 0.69 0.54
KVCT 0.68 0.53
Fig. 9. D95 %, D99 % difference base on each contour.
배, Z : 1.92배)는 X, Z길이의 변화가 커졌다. 특히 Axial영 상에서 Metal Shape이 정사각형 모양에서 마름모꼴 모양 이 변하는 현상이 KVCT, SMART-MAR CT영상에서 나 타났고 MVCT만이 Real Metal shape과 비슷한 정사각형 을 나타냈다.
Superior-Inferior의 길이의 경우에는 각 CT의 종류에 따른 차이를 보이지 않았다. 이는 Brink 등의 연구를 통 해 CT의 Helical scan의 특징으로 Artifact가 S-I 방향으 로는 영향을 주지 않는 것을 확인할 수 있었으며 치아에 Metal Artifact가 발생 시 S-I방향은 어떤 CT를 사용하더 라도 실제와 비슷한 값을 얻을 수 있다는 것을 알 수 있었 다.(9)
이 논문의 제한점으로는 실제 보철치료에 사용하는 재 질을 사용하지 않고 밀도가 비슷한 Cerrobend를 이용한 점이 있으며 치아 보철 치료의 한 종류인 Bridge 모양을 묘 사한 C보철물(1×2×1 cm)의 경우에는 Phantom hole 직 경의 한계로 인하여 Metal의 긴 축을 X, Z축 방향이 아닌 Y축 방향으로 위치시킨 결과 B보철물(1×1×1 cm)의 결과 값과 비슷한 결과를 얻었다.
후속 논문에서는 보다 적합한 Phantom을 제작하여 Z 축의 긴 부분의 측정하고 다양한 밀도를 갖는 치과재료인 세라믹, Ni-Cr, 아말감, 합금 등을 이용한 보철물 제작을 통해 후속적 연구가 필요할 것으로 사료된다.
앞선 실험을 통해 얻은 MVCT, MAR CT, KVCT에서 측 정된 Metal Volume contour를 적용한 양성자 Patient study에서는 SMART-MAR CT와 KVCT를 이용하여 얻 은 Metal Volume contour를 적용한 경우 D99 %에서 각 각 5.9 %, 6.6 %의 선량감소를 보여 Minimum Dose 차 이가 크게 나타났고 MVCT에서 측정된 Metal Volume contour를 적용한 경우 실제와 비슷한 선량분포를 가졌다 (Fig. 8).
이 논문을 통해 두경부 치아부분의 방사선 치료계획 시 금속보철물의 실제 크기, 모양 및 형태가 각 CT에 따라 다 르게 나타나며 이는 양성자치료 계획 시 선량분포에 많은 영향을 줄 수 있다는 것을 알 수 있다. 양성자 치료 시 매질 의 작은 변화에도 SOBP(Spread Out Bragg Peak)에 영 향을 미쳐 양성자 선량분포에 영향을 주기 때문에 기본적 으로 Beam pass way에 Metal 쪽 Beam 방향을 피해서
치료계획을 세우도록 고려해야 하겠지만 치아 보철물이 많 아 Beam을 피하기 어려울 경우 널리 보급되어 있는 To- motherapy의 MVCT를 이용하거나 MVCBCT를 활용해 Metal Volume contour를 얻고 이를 양성자 치료에 적용 한다면 치료의 정확도를 높이는데 매우 유용할 것으로 사 료된다.(10)
참고문헌
1. Hoheisel M: Review of medical imaging with em- phasis on X-ray detectors. Nucl. Instr. Meth. A.
2006;563:215–24. [Google Scholar]
2. 이상태: “TEXTBOOK of Computed Tomography”. 청 구문화사. 2005
3. F. E. Boas and D. Fleischmann: Computed tomog- raphy artifacts: Causes and reduction techniques.
Imaging in Medicine 4 (2) 2012;229-240
4. 한영길·장요종·강동혁 등: 국립암센터 양성자치료센 터의 양성자 치료계획에서 Iterative Metal Artifact Reduction(IMAR) Algorithm 적용의 유용성 평가. 대한 방사선치료학회지 제29권 제1호, 2017
5. Langen KM, Meeks SL, Poole DO, Wagner TH et al.:
The use of megavoltage CT (MVCT) images for dose recomputations. GHPhys Med Biol. 2005 Sep 21;
50(18):4259-76. [PubMed] [Ref list]
6. Gao Liugang1, Sun Hongfei1, Ni Xinye1 et al.: Metal artifact reduction through MVCBCT and kVCT in radiotherapy. 3. Scientific RepoRts | 6:37608 | DOI:
10.1038/srep37608
7. Jakel O, Reiss P.: The influence of metal arte- facts on the range of ion beams. Phys. Med. Biol.
2007;52:635–44. [PubMed] [Google Scholar]),
8. Wei J, Sandison GA, Hsi WC, Ringor M et al.: Do- simetric impact of a CT metal artefact suppression algorithm for proton, electron and photon therapies.
Lu X Phys Med Biol. 2006 Oct 21; 51(20):5183-97.
[PubMed] [Ref list]
9. Brink, JA, et al. “Helical CT: principles and technical considerations.” Radiographics 1994 14(4):887.
10. LEVIN, W. P., et al.: Proton beam therapy. British journal of Cancer, 2005; 93.8:849-854
Evaluation of Metal Volume and Proton Dose Distribution Using MVCT for Head and Neck Proton Treatment Plan
Dept. of Radiation Oncology, Samsung Medical Center
Seo Sung Gook, Kwon Dong Yeol, Park Se Joon, Park Yong Chul, Choi Byung Ki
Purpose : The size, shape, and volume of prosthetic appliance depend on the metal artifacts resulting from den- tal implant during head and neck treatment with radiation. This reduced the accuracy of contouring targets and surrounding normal tissues in radiation treatment plan. Therefore, the purpose of this study is to obtain the im- ages of metal representing the size of tooth through MVCT, SMART-MAR CT and KVCT, evaluate the volumes, apply them into the proton therapy plan, and analyze the difference of dose distribution.
Materials and Methods: Metal A (0.5×0.5×0.5 cm), Metal B (1×1×1 cm), and Metal C (1×2×1 cm) similar in size to inlay, crown, and bridge taking the treatments used at the dentist’s into account were made with Cerrobend (9.64 g/cm3). Metal was placed into the In House Head & Neck Phantom and by using CT Simulator (Discovery CT 590RT, GE, USA) the images of KVCT and SMART-MAR were obtained with slice thickness 1.25 mm. The im- ages of MVCT were obtained in the same way with RADIXACT® Series (Accuracy Precision®, USA). The images of metal obtained through MVCT, SMART-MAR CT, and KVCT were compared in both size of axis X, Y, and Z and volume based on the Autocontour Thresholds Raw Values from the computerized treatment planning equipment Pinnacle (Ver 9.10, Philips, Palo Alto, USA). The proton treatment plan (Ray station 5.1, RaySearch, USA) was set by fusing the contour of metal B (1×1×1 cm) obtained from the above experiment by each CT into KVCT in order to compare the difference of dose distribution.
Result : Referencing the actual sizes, it was appeared: Metal A (MVCT: 1.0 times, SMART-MAR CT: 1.84 times, and KVCT: 1.92 times), Metal B (MVCT: 1.02 times, SMART-MAR CT: 1.47 times, and KVCT: 1.82 times), and Metal C (MVCT: 1.0 times, SMART-MAR CT: 1.46 times, and KVCT: 1.66 times). MVCT was measured most similarly to the actual metal volume. As a result of measurement by applying the volume of metal B into proton treatment plan, the dose of D 99 % volume was measured as: MVCT: 3094 CcGE, SMART-MAR CT: 2902 CcGE, and KVCT:
2880 CcGE, against the reference 3082 CcGE
Conclusion : Overall volume and axes X and Z were most identical to the actual sizes in MVCT and axis Y, which is in the superior-Inferior direction, was regular in length without differences in CT. The best dose distribution was shown in MVCT having similar size, shape, and volume of metal when treating head and neck protons. Thus it is thought that it would be very useful if the contour of prosthetic appliance using MVCT is applied into KVCT for proton treatment plan.
▶ Key words: Dental Implant, Metal Artifact, SMART-MAR, MVCT, Proton