• 검색 결과가 없습니다.

Skin Dose Comparison of CyberKnife and Helical Tomotherapy for Head-and-Neck Stereotactic Body Radiotherapy

N/A
N/A
Protected

Academic year: 2021

Share "Skin Dose Comparison of CyberKnife and Helical Tomotherapy for Head-and-Neck Stereotactic Body Radiotherapy"

Copied!
6
0
0

로드 중.... (전체 텍스트 보기)

전체 글

(1)

Original Article

Skin Dose Comparison of CyberKnife and Helical Tomotherapy for Head-and-Neck Stereotactic Body Radiotherapy

Jeongmin Yoon 1 , Kwangwoo Park 2 , Jin Sung Kim 2 , Yong Bae Kim 2 , Ho Lee 3

1 Department of Radiation Oncology, Seoul National University Hospital, 2 Department of Radiation Oncology, Yonsei Cancer Center, Yonsei University College of Medicine, 3 Department of Radiation Oncology, Gangnam Severance Hospital, Yonsei University College of Medicine, Seoul, Korea

Received 3 December 2018 Revised 30 December 2018 Accepted 7 January 2019

Corresponding author Ho Lee

([email protected]) Tel: 82-2-2228-4363 Fax: 82-2-2227-7823

Purpose: This study conducts a comparative evaluation of the skin dose in CyberKnife (CK) and Helical Tomotherapy (HT) to predict the accurate dose of radiation and minimize skin burns in head- and-neck stereotactic body radiotherapy.

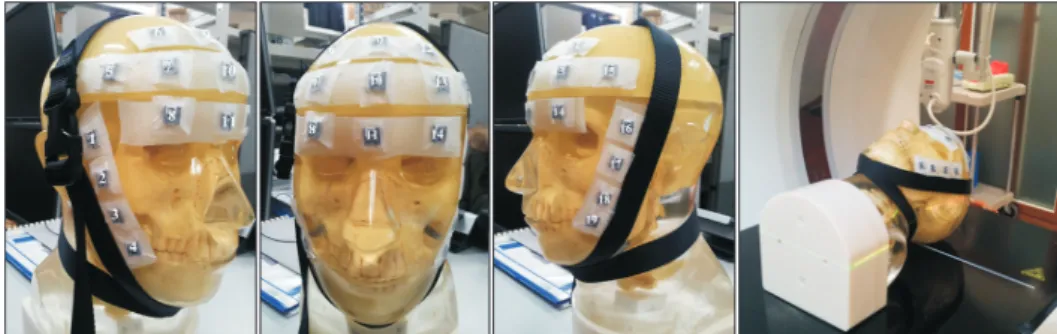
Materials and Methods: Arbitrarily-defined planning target volume (PTV) close to the skin was drawn on the planning computed tomography acquired from a head-and-neck phantom with 19 optically stimulated luminescent dosimeters (OSLDs) attached to the surface (3 OSLDs were positioned at the skin close to PTV and 16 OSLDs were near sideburns and forehead, away from PTV). The calculation doses were obtained from the MultiPlan 5.1.2 treatment planning system using raytracing (RT), finite size pencil beam (FSPB), and Monte Carlo (MC) algorithms for CK. For HT, the skin dose was estimated via convolution superposition (CS) algorithm from the Tomotherapy planning station 5.0.2.5. The prescribed dose was 8 Gy for 95% coverage of the PTV.

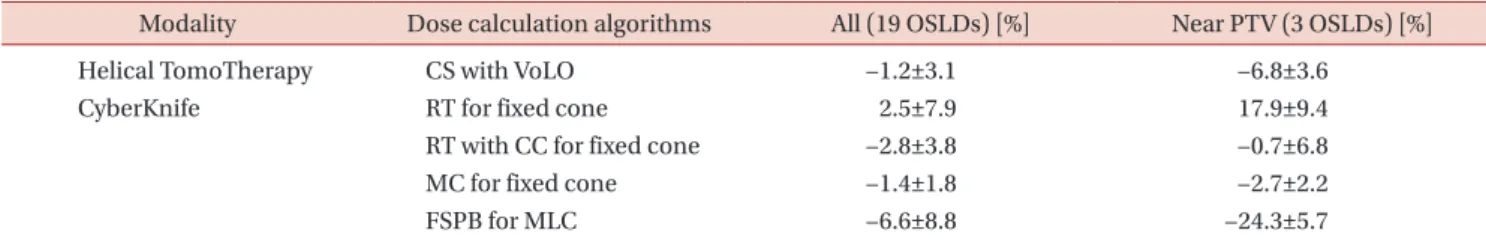
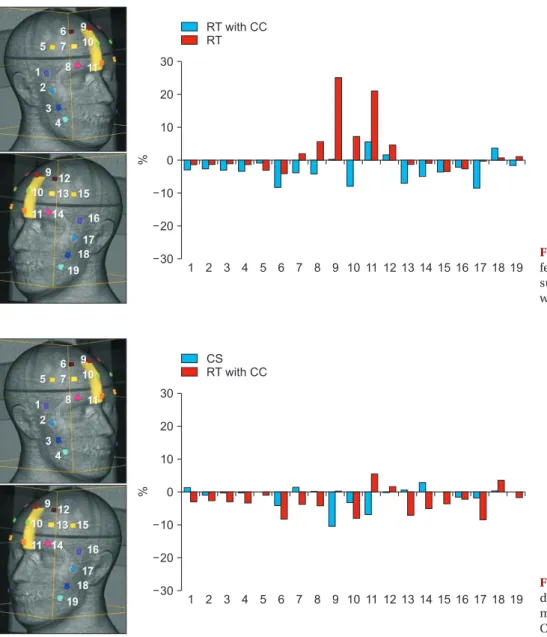
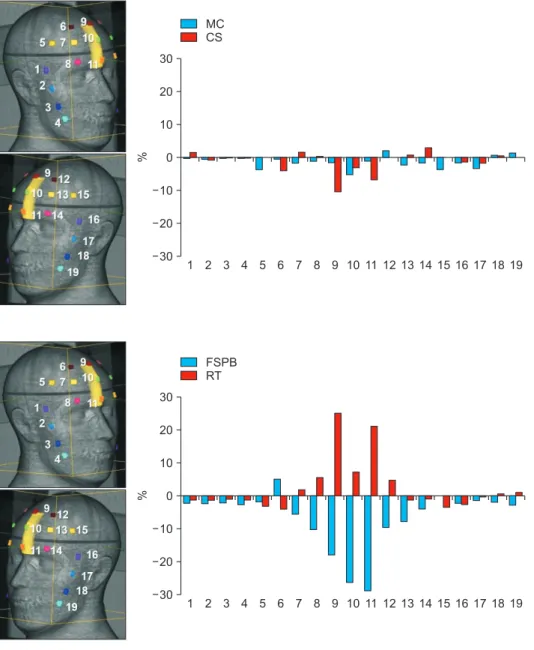
Results and Conclusions: The mean differences between calculation and measurement values were −1.2±3.1%, 2.5±7.9%, −2.8±3.8%, −6.6±8.8%, and −1.4±1.8% in CS, RT, RT with contour correction (CC), FSPB, and MC, respectively. FSPB showed a dose error comparable to RT. CS and RT with CC led to a small error as compared to FSPB and RT. Considering OSLDs close to PTV, MC minimized the uncertainty of skin dose as compared to other algorithms.

Keywords: CyberKnife, Skin dose, Helical TomoTherapy, SBRT

Copyright © 2019 Korean Society of Medical Physics

CC

This is an Open-Access article distributed under the terms of the Creative Commons Attribution Non-Commercial License (http://creativecommons.org/licenses/by- nc/4.0) which permits unrestricted non-commercial use, distribution, and reproduction in any medium, provided the original work is properly cited.

Introduction

The stereotactic body radiotherapy (SBRT) or stereotactic radiosurgery (SRS) has been considered for definitive reir- radiation of recurrent or second primary head-and-neck cancer. 1) For patients with head-and-neck cancer, scalp irradiation is often used to treat skin cancer cases such as lymphoma, Kaposi’s sarcoma, and angiosarcoma. 2,3)

Newer radiation delivery machines have been used for

scalp irradiation. Helical TomoTherapy (HT; Accuray Inc, Sunnyvale, CA) 4,5) is a megavoltage computed tomography (MVCT)-guided system that uses 6-MV beams modulated by a 64-leaf binary multileaf collimator (MLC). HT is well- matched because it can deliver a tangential beam to any point on the scalp without any problems in field-matching.

Another modality is CyberKnife (CK; Accuray Inc, Sunny- vale, CA), 6,7) comprising 6-MV flattening filter free treat- ment beam with noncoplanar beam geometry and high

Progress in Medical Physics 30(1), March 2019

https://doi.org/10.14316/pmp.2019.30.1.1

eISSN 2508-4453

(2)

dose rate. More recently, the use of MLC has made it pos- sible to generate dose distributions similar to the intensity modulated radiotherapy, by delivering many modulated fields with various source positions and angles. 8)

However, the dosimetric verification of scalp irradiation is necessary to minimize technical and dosimetric uncer- tainties. In this study, we focused on a comparative evalu- ation of the skin dose in HT and CK to predict an accurate dose and to minimize skin burns in head-and-neck SBRT.

We performed experiments using optically stimulated lu- minance dosimeters (OSLDs) 9,10) attached on the surface of a head-and-neck phantom 11) (Model RS-108T, Radiological Support Devices, Long Beach, CA, USA).

Materials and Methods

1. Measurement setup

The in-vivo measurements using the OSLDs were com- pared with the predicted dose in the treatment planning system (TPS). Nineteen OSLDs were attached on the sur- face of a head-and-neck phantom, especially near the side- whiskers, forehead, and planning target volume (PTV) as shown in Fig. 1. In order to ensure reproducibility of the measurements, OSLD chip boundaries were prepainted on the tape attached to the phantom surface to place the OSLD chips in the same location for each measurement.

Planning CT image was obtained by a fan-beam multide- tector CT scanner (Aquilion LB 16-detector row CT, Toshi- ba Medical Systems, Nasu, Japan) with a 1-mm scan size.

For dose calculations, we used two TPSs: TomoTherapy planning station 5.0.2.5 (Accuray Inc., CA, USA) and Multi- Plan 5.1.2 (Accuray Inc., CA, USA).

2. Treatment plans in CK and HT

The PTV and the 19 regions-of-interest (ROIs) containing OSLDs were manually contoured on the planning CT im- ages. Treatment plans for CK and HT were designed to de- liver a dose of 8 Gy to at least 95% of the PTV. TomoTherapy planning station supports convolution superposition (CS) 12) algorithm with voxel-less optimization TM (VoLO). In the CS algorithm, the prior beam attenuation is determined in each voxel, and then a dose kernel is applied to each voxel to model the scatter. Energy decomposition at and around the photon interaction sites is computed. For the HT plan, a treatment plan was created with dynamic jaws and plan- ning parameters such as a field width of 2.51 cm, pitch of 0.43, and modulation factor of 2.0. The calculation grid size used for the dose calculation was 0.195×0.195 cm 2 .

MultiPlan TPS for CK provides raytracing (RT) 13) for the fixed cone, Monte Carlo (MC) 13) for the fixed cone, and finite size pencil beam (FSPB) 14) for multileaf collimator (MLC). For all the plans in CK, the template path was set as the full path, and the tracking method was 6D Skull tracking. Dose calculation resolution was assigned to be high mode. For RT, we created two plans for the conditions with or without contour correction (CC). 15,16) The two plans consisted of 70 nodes and 92 beams. The RT algorithm was used to calculate the dose contributed to a target voxel for each beam in the treatment plan using look-up tables such as tissue-phantom ratio, off-center ratio, and output factor. It considers the effective path length along the cen- tral axis of a beam. To estimate the effective depth value for any point that is not on the central axis of a beam, the CC algorithm first precalculates the effective depth values along the lines located on the surface of a set of concen- tric cones, which have the same central axis as the beam.

Fig. 1. Nineteen OSLDs attached on

the surface of a head-and-neck phan-

tom.

(3)

Then, the algorithm finds the four lines surrounding the given point, and it performs a bilinear interpolation on the angle and radius to calculate the estimated effective depth using the depth look-ups on the surrounding lines. On the contrary, the MC dose calculation algorithm includes user inputs that increase or decrease the uncertainty of the dose calculation. Because the algorithm describes the heteroge- neity effect on the scattered dose, it is possible to make an ideal choice for areas with significant inhomogeneity. For the MC plan, 69 nodes and 91 beams were used with the uncertainty of 2%. The FSPB algorithm was used only for the MLC collimator. This algorithm discretizes any MLC beam into small rectangular finite pencil beams. The dose of a single pencil beam is modeled as the product of energy fluence and a dose deposition kernel. Energy fluence and kernel are determined from the commissioning data. The dose to a single point is the sum of all pencil beam doses at that point. In this study, the numbers of nodes, beams, and segments used for the MLC plan using FSPB were 61, 61, and 92, respectively. For each plan, a dose distribution was calculated by inverse optimization, and the mean dose within each ROI was assigned as the calculated dose.

3. OSLD measurements

The MicroStar system (Landauer Ltd.), which is a porta- ble reader, has been utilized for the single-point measure- ment of the OSLD nanoDot. The calibration of the OSLD was applied according to the MV energy level. To correctly evaluate the measurements, we ensured that the OSLD calibration curve represented the relationship between the converted value and the calculated dose, with exposures in the range 0 to 10 Gy using Farmer chamber and water- equivalent RW3 slab phantom including housing plates for Farmer chamber and OSLDs. The second polynomial

function was used as the calibration curve fitter. After each beam delivery, OSLD chips were read three times using the MicroStar reader in cGy unit. The values for every chip were averaged and determined to be the exposure dose.

For all measurements, the OSLD was read 1 hour after ir- radiation. The variations in the reader’s sensitivity prior to each OSLD reading were measured by quantifying three counts: dark signal, photomultiplier tube (PMT) counts from the carbon ( 14 C) source, and PMT counts with the shutter open and the LEDs on to specify beam intensity.

The beam delivery was performed more than twice to verify the reproducibility of the measurement for the same conditions.

Results and Discussion

Five treatment plans using different dose calculation algorithms in HT and CK were created and delivered using the head-and-neck phantom with OSLDs. The mean dif- ferences between the calculated and the measured values for 19 OSLDs, as well as three OSLDs close to the PTV, are summarized in Table 1.

Fig. 2 plots the dose difference between the calculated and the measured values at 19 OSLD positions attached to the surface of the head-and-neck phantom when RT with and without the CC were used. In particular, in the three OSLDs (#9, #10, and #11) close to the PTV, mean differ- ence between the calculation and the measurement values was −0.7±6.8% and 17.9±9.4% for RT with and without CC, respectively. Based on this result, it was observed that the RT without the CC overestimates the skin dose by an aver- age of 15% higher than the actual measurement value. The RT algorithm uses effective path length to account for the density variation when calculating dose. However, con- sidering only the primary path heterogeneity correction

Table 1. Comparison of dose calculated by five dose calculation algorithms and measured dose.

Modality Dose calculation algorithms All (19 OSLDs) [%] Near PTV (3 OSLDs) [%]

Helical TomoTherapy CS with VoLO −1.2±3.1 −6.8±3.6

CyberKnife RT for fixed cone 2.5±7.9 17.9±9.4

RT with CC for fixed cone −2.8±3.8 −0.7±6.8

MC for fixed cone −1.4±1.8 −2.7±2.2

FSPB for MLC −6.6±8.8 −24.3±5.7

(4)

may cause inaccuracies near the density interfaces. On the other hand, the inclusion of the CC produced distinct pat- terns of decreased differences between the calculated and the measured doses because the effective depth value for any point not on the central axis of a beam was considered when the RT dose calculation method was used.

Fig. 3 depicts the dose differences between the CS and the RT with CC at 19 OSLD positions. For the CS dose cal- culation algorithm, the mean difference between the cal- culation and the measurement was −6.8±3.6% in the area near the PTV. In contrast, considering all positions near the side-whiskers and forehead, a slightly lower mean dif- ference was achieved in the CS algorithm (−1.2±3.1%) than

in RT with CC (−2.8±3.8%). Overall, CS and RT with CC showed similar patterns.

Fig. 4 plots the dose difference between the calculated and the measured values at 19 OSLD positions using the MC and CS. In particular, in the MC dose calculation algo- rithm, a distinct reduced plot pattern was observed with the mean dose difference of −2.7±2.2% near the PTV and

−1.4±1.8% at all OSLD positions. This is because the MC algorithm considers the scatter from the entire phantom and accounts for the heterogeneity effect on the scattered dose. Therefore, there is an ideal choice for skin areas with significant inhomogeneity.

Fig. 5 shows the dose differences between RT and FSPB

RT with CC RT

1 30

20

10

0

10

20

30

%

2 3 4 5 6 7 8 9 10 11 12 13 14 15 16 17 18 19

Fig. 2. Comparison of the dose dif- ference between calculated and mea- sured values in 19 OSLDs using RT with and without CC.

Fig. 3. Comparison of the dose difference between calculated and measured values in 19 OSLDs using CS and RT with CC.

CS RT with CC

1 30

20

10

0

10

20

30

%

2 3 4 5 6 7 8 9 10 11 12 13 14 15 16 17 18 19

(5)

at 19 OSLD positions. In the area of the skin near the PTV, FSPB showed a large difference error of −24.3±5.7%. Over- all, FSPB showed a dose error similar to RT.

Conclusion

We verified the skin dose comparison based on five dose calculation algorithms used in CK and HT. FSPB showed a dose error similar to RT. CS and RT with CC led to a small error, compared to FSPB and RT. Considering OSLDs close to the PTV, MC was able to minimize the uncertainty of the skin dose compared to other algorithms.

Acknowledgements

This research was supported by a grant of the Radiation Technology R&D program through the National Research Foundation of Korea funded by the Ministry of Science, ICT & Future Planning (NRF-2017M2A2A6A01070330).

Conflicts of Interest

The authors have nothing to disclose.

Fig. 4. Comparison of the dose dif- ference between calculated and mea- sured values in 19 OSLDs using MC and CS.

MC CS

1 30

20

10

0

10

20

30

%

2 3 4 5 6 7 8 9 10 11 12 13 14 15 16 17 18 19

Fig. 5. Comparison of the dose dif- ference between calculated and mea- sured values in 19 OSLDs using FSPB and RT.

FSPB RT

1 30

20

10

0

10

20

30

%

2 3 4 5 6 7 8 9 10 11 12 13 14 15 16 17 18 19

(6)

Availability of Data and Materials

All relevant data are within the paper and its Supporting Information files.

References

1. Guadagnolo BA, Zagars GK, Araujo D, Ravi V, Shellenberg- er TD, Sturgis EM. Outcomes after definitive treatment for cutaneous angiosarcoma of the face and scalp. Head Neck. 2011;33(5):661-67.

2. Mellenberg DE, Schoeppel SL. Total scalp treatment of mycosis fungoides: the 4× 4 technique. Int J Radiat Oncol Biol Phys. 1993;27(4):953-58.

3. Stelzer KJ, Griffin TW. A randomized prospective trial of radiation therapy for AIDS-associated Kaposi’s sarcoma.

Int J Radiat Oncol Biol Phys. 1993;27(5):1057-61.

4. Katayama S, Haefner MF, Mohr A, et al. Accelerated tomo- therapy delivery with TomoEdge technique. J Appl Clin Med Phys. 2015;16(2):33-42.

5. Sterzing F, Uhl M, Hauswald H, et al. Dynamic jaws and dynamic couch in helical tomotherapy. Int J Radiat Oncol Biol Phys. 2010;76(4):1266-73.

6. Lee E, Park K, Kim JS, Kim YB, Lee H. Practical Implemen- tation of Patient-Specific Quality Assurance for Small and Multiple Brain Tumors in CyberKnife with Fixed Collima- tors. Prog Med Phys. 2018;29(2):53-8.

7. Dieterich S, Cavedon C, Chuang CF, et al. Report of AAPM TG 135: quality assurance for robotic radiosurgery. Med Phys. 2011;38(6):2914-36.

8. Yoon J, Park K, Kim JS, Kim YB, Lee H. Acceptance Test- ing and Commissioning of Robotic Intensity-Modulated Radiation Therapy M6 System Equipped with InCise TM 2

Multileaf Collimator. Prog Med Phys. 2018;29(1):8-15.

9. Jursinic PA. Changes in optically stimulated luminescent dosimeter (OSLD) dosimetric characteristics with accu- mulated dose. Med Phys. 2010;37(1):132-40.

10. Jursinic PA. Characterization of optically stimulated lumi- nescent dosimeters, OSLDs, for clinical dosimetric mea- surements. Med Phys. 2007;34(12):4594-604.

11. Kim J, Park K, Yoon J, et al. Feasibility Study of a Custom- made Film for End-to-End Quality Assurance Test of Ro- botic Intensity Modulated Radiation Therapy System. Prog Med Phys. 2016;27(4):189-95.

12. Sterpin E, Salvat F, Olivera G, Vynckier S. Monte Carlo evaluation of the convolution/superposition algorithm of Hi‐Art TM tomotherapy in heterogeneous phantoms and clinical cases. Med Phys. 2009;36(5):1566-75.

13. Okoye CC, Patel RB, Hasan S, et al. Comparison of ray tracing and Monte Carlo calculation algorithms for tho- racic spine lesions treated with CyberKnife-based stereo- tactic body radiation therapy. Technol Cancer Res Treat.

2016;15(1):196-202.

14. Yoon J, Lee E, Park K, Kim JS, Kim YB, Lee H. Patient-Spe- cific Quality Assurance in a Multileaf Collimator-Based CyberKnife System Using the Planar Ion Chamber Array.

Prog Med Phys. 2018;29(2):59-65.

15. Mcguinness C, Descovich M, Barani I. CyberKnife image- guided hypofractionated stereotactic radiotherapy. Image- Guided Hypofractionated Stereotactic Radiosurgery: A Practical Approach to Guide Treatment of Brain and Spine Tumors: CRC Press, Taylor and Francis Group 2016:49.

16. Kang KM, Jeong BK, Choi HS, et al. Combination effects

of tissue heterogeneity and geometric targeting error in

stereotactic body radiotherapy for lung cancer using Cy-

berKnife. J Appl Clin Med Phys. 2015;16(5):193-204.

수치

Fig. 1. Nineteen OSLDs attached on  the surface of a head-and-neck  phan-tom.
Fig. 2 plots the dose difference between the calculated  and the measured values at 19 OSLD positions attached to  the surface of the head-and-neck phantom when RT with  and without the CC were used
Fig. 3 depicts the dose differences between the CS and  the RT with CC at 19 OSLD positions
Fig. 4. Comparison of the dose dif- dif-ference between calculated and  mea-sured values in 19 OSLDs using MC  and CS.MCCS13020100102030%23456789 10 11 12 13 14 15 16 17 18 19

참조

관련 문서