• 검색 결과가 없습니다.

Dosimetric Evaluation of Plans Converted with the DVH-Based Plan Converter

N/A
N/A
Protected

Academic year: 2021

Share "Dosimetric Evaluation of Plans Converted with the DVH-Based Plan Converter"

Copied!
7
0
0

로드 중.... (전체 텍스트 보기)

전체 글

(1)

Original Article

Dosimetric Evaluation of Plans Converted with the DVH-Based Plan Converter

Minsoo Chun* ,†,‡ , Chang Heon Choi* ,†,‡ , Jung-in Kim* ,†,‡ , Jeongmin Yoon* ,†,‡ , Sung Young Lee* ,† , Ohyun Kwon* ,† , Jaeman Son* ,† , Hyun Joon An* ,† , Seong-Hee Kang ΙΙ , Jong Min Park* ,†,‡,§

*Department of Radiation Oncology, Seoul National University Hospital, Biomedical Research Institute, Seoul National University Hospital, Institute of Radiation Medicine, Seoul National University Medical Research Center, Seoul, § Center for Convergence Research on Robotics, Advanced Institutes of Convergence Technology, Suwon, ΙΙ Department of Radiation Oncology, Seoul National University Bundang Hospital, Seongnam, Korea

Received 28 November 2018 Revised 14 December 2018 Accepted 14 December 2018

Corresponding author Jong Min Park ([email protected]) Tel: 82-2-2072-2527 Fax: 82-2-2072-2527

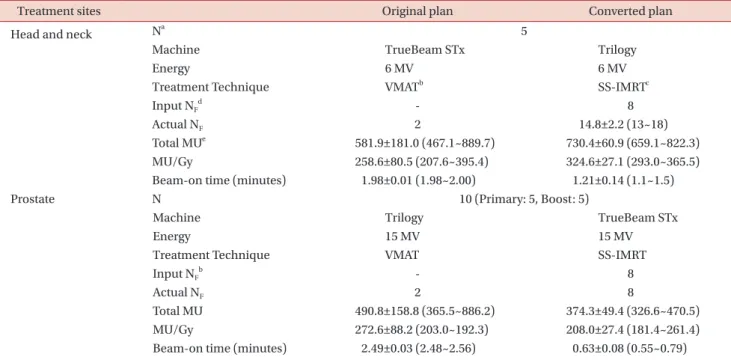
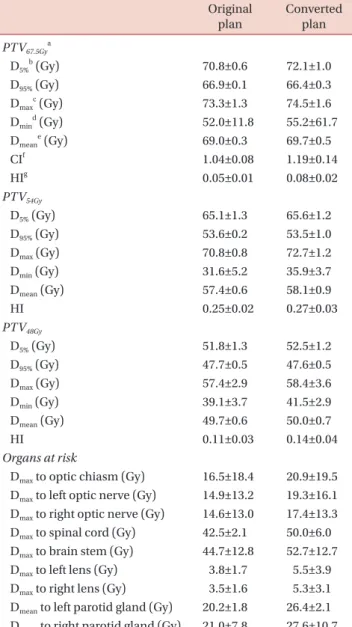
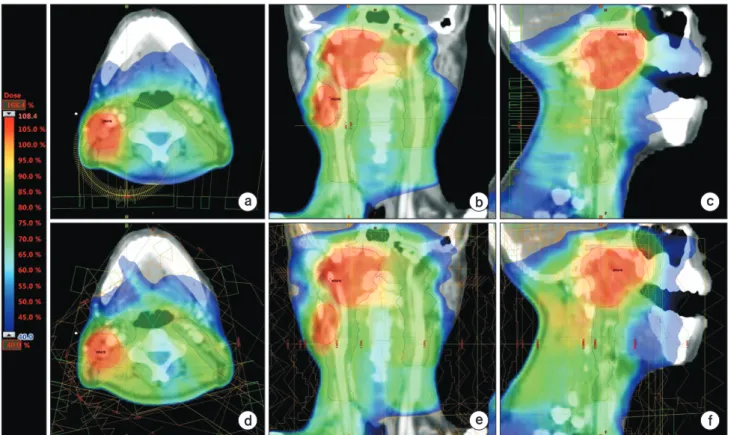
Plans converted using dose-volume-histogram-based plan conversion (DPC) were evaluated by comparing them to the original plans. Changes in the dose volumetric (DV) parameters of five volumetric modulated arc therapy (VMAT) plans for head and neck (HN) cancer and five VMAT plans for prostate cancer were analyzed. For the HN plans, the homogeneity indices (HIs) of the three planning target volumes (PTV) increased by 0.03, 0.02, and 0.03, respectively, after DPC.

The maximum doses to the PTVs increased by 1.20, 1.87, and 0.92 Gy, respectively, after DPC.

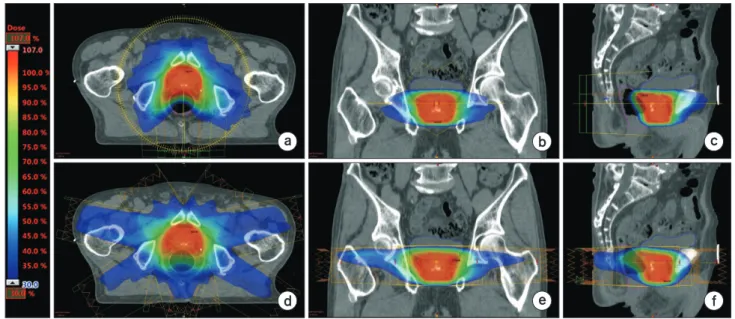
The maximum doses to the optic chiasm, optic nerves, spinal cord, brain stem, lenses, and parotid glands increased after DPC by approximately 4.39, 3.62, 7.55, 7.96, 1.77, and 6.40 Gy, respectively. For the prostate plans after DPC, the HIs for the primary and boost PTVs increased by 0.05 and 0.03, respectively, and the maximum doses to each PTV increased by 1.84 and 0.19 Gy, respectively. After DPC, the mean doses to the rectum and femoral heads increased by approximately 6.19 and 2.79 Gy, respectively, and those to the bladder decreased by 0.20 Gy when summing the primary and boost plans. Because clinically unacceptable changes were sometimes observed after DPC, plans converted by DPC should be carefully reviewed before actual patient treatment.

Keywords: DVH-based plan converter, Volumetric modulated arc therapy, Step-and-shoot IMRT, Dose-volumetric parameters, Plan quality

Copyright © 2018 Korean Society of Medical Physics

CC

This is an Open-Access article distributed under the terms of the Creative Commons Attribution Non-Commercial License (http://creativecommons.org/licenses/by- nc/4.0) which permits unrestricted non-commercial use, distribution, and reproduction in any medium, provided the original work is properly cited.

Introduction

Dose-volume histogram (DVH) based plan converter be- came available in a new version of the Eclipse TM treatment planning system (ver. 13, Varian Medical System, Palo Alto, CA). DVH-based plan conversion (DPC) can convert plans in case of emergency such as a situation of the machine break down. DPC can alter the original plan to one with either an identical type machine or a non-dosimetrically

equivalent machine. The plan conversion types of the DPC are as follows: volumetric modulated arc therapy (VMAT) to step-and-shoot intensity-modulated radiation therapy (SS-IMRT), sliding window IMRT (SW-IMRT) to SS-IMRT, and three-dimensional conformal radiation therapy (3D CRT) to 3D CRT. To utilize the DPC function safely in the clinic, the dosimetric equivalence between the original and the converted plans should be verified, however, no studies on this have been performed yet. Although a single study

Progress in Medical Physics 29(4), December 2018

https://doi.org/10.14316/pmp.2018.29.4.157

eISSN 2508-4453

(2)

introduced the DPC along with features of the new plan- ning system, the function of the DPC was only briefly in- troduced. 1) Therefore, in this study, we evaluated the DPC by utilizing five head and neck, and five prostate cases.

Plan qualities before and after the DPC were dosimetrically compared to each other.

Materials and Methods

1. Patient selection and treatment planning

A total of 10 patients previously treated in our institute were analyzed in this study (five head and neck (HN) can- cer patients and five prostate cancer patients). For every patient, VMAT plans were generated in the Eclipse system with an optimization algorithm of progressive resolution optimizer 3 (PRO3, ver. 13.0, Varian Medical System, Palo Alto, CA) and a dose calculation algorithm of anisotropic analytical algorithm (AAA, ver. 13.0, Varian Medical Sys- tem, Palo Alto, CA).

For HN cases, three target volumes were prescribed by 67.5 Gy (2.25 Gy/fraction), 54 Gy (1.8 Gy/fraction), and

48 Gy (1.6 Gy/fraction), respectively. The HN plans were generated by using two full arcs with 6 MV photon beams of the TrueBeam STx TM (Varian Medical System, Palo Alto, CA).

In the prostate cases, the primary plan was generated with a prescription dose of 50.4 Gy (1.8 Gy/fraction) to prostate and seminal vesicles, and the boost plan was cre- ated with a prescription dose of 30.6 Gy (1.8 Gy/fraction) to prostate alone. Both the primary and boost plans were generated by using two full arcs with 15 MV photon beams of the Trilogy TM (Varian Medical System, Palo Alto, CA). All the plans in this study were normalized for 100% of the pre- scription doses to cover 90% of the planning target volume (PTV).

2. DVH-based plan conversion

If the energy used in the original plan is not supported in the target machine, the DPC automatically selects the en- ergy of the converted plan closest to the one in the original plan. In cases of SW-IMRT to SS-IMRT and 3D CRT to 3D CRT conversion, the number of fields of the converted plan

Table 1. Treatment plan parameters before and after DPC.

Treatment sites Original plan Converted plan

Head and neck N a 5

Machine TrueBeam STx Trilogy

Energy 6 MV 6 MV

Treatment Technique VMAT b SS-IMRT c

Input N F d - 8

Actual N F 2 14.8±2.2 (13~18)

Total MU e 581.9±181.0 (467.1~889.7) 730.4±60.9 (659.1~822.3)

MU/Gy 258.6±80.5 (207.6~395.4) 324.6±27.1 (293.0~365.5)

Beam-on time (minutes) 1.98±0.01 (1.98~2.00) 1.21±0.14 (1.1~1.5)

Prostate N 10 (Primary: 5, Boost: 5)

Machine Trilogy TrueBeam STx

Energy 15 MV 15 MV

Treatment Technique VMAT SS-IMRT

Input N F b - 8

Actual N F 2 8

Total MU 490.8±158.8 (365.5~886.2) 374.3±49.4 (326.6~470.5)

MU/Gy 272.6±88.2 (203.0~192.3) 208.0±27.4 (181.4~261.4)

Beam-on time (minutes) 2.49±0.03 (2.48~2.56) 0.63±0.08 (0.55~0.79)

a N, number of patients; b VMAT, volumetric modulated arc therapy; c SS-IMRT, step-and-shoot intensity modulated radiation therapy; d N F , number of fields; e MU, monitor unit.

Numerical values are presented by mean ± standard deviation, as well as minimum and maximum values are within parenthesis. 

(3)

remains same as that of the original plan. However, in the case of VMAT to SS-IMRT conversion, the number of fields should be defined manually. In this study, we compared the original VMAT plans and the SS-IMRT plans with eight fields after applying the DPC. For fair comparison, the number of fractions as well as daily doses of the converted plans kept same with those of the original plan. The DPC parameters in this study are summarized in Table 1.

3. Dose-volumetric parameter analysis

For the target volume, the dose received by at least 95%

of the PTV (D 95% ), D 5% , the minimum dose (D min ), and the maximum dose (D max ) were calculated. Additionally, the conformity index (CI), and homogeneity index (HI) were acquired as follows.

Conformity intdex (CI)= V 100% of PTV Volume of PTV (1)

Homogeneity intdex (HI)= D 5% − D 95% (2) Mean dose of PTV

where, V 100% is the volume receiving 100% of the prescrip- tion dose. The DV parameters of the PTV were calculated for each target volume.

For the HN VMAT plans, the D max values to the spinal cord, brain stem, left/right lenses, left/right optic nerves, and optic chiasm were acquired. The mean doses (D mean ) to the left/right parotid glands were also obtained. 2,3) For the prostate VMAT plans, the DV parameters for the OARs were evaluated in the summation of primary and boost plans. The D 60% , D 20% , D mean , and the percent volume receiv- ing 70 Gy (V 70Gy ) of the rectum; D 50% , D 20% , D mean , and V 70Gy of the bladder; and D max , D mean , D 50% , and D 10% of the femoral heads were calculated. 4-6)

Results

1. DPC for the HN plans

The average DV parameters for the HN plans before and after DPC are shown in Table 2. The average target homo- geneities for the PTVs with a prescription dose of 67.5 Gy

(PTV 67.5Gy ), PTV 54Gy , and PTV 48Gy became slightly poor after DPC (HI=0.05 vs. 0.08, 0.25 vs. 0.27, 0.11 vs. 0.14). Because HN VMAT plans were optimized with the simultaneous integrated boost (SIB) technique, the target conformity was evaluated only for the PTV 67.5Gy . The average CI of the PTV 67.5Gy was shown by 1.04 and 1.19 before and after DPC, respectively.

For OARs, all the DV parameters after DPC were higher

Table 2. The DV parameters before and after DPC for the HN VMAT plans.

Original plan

Converted plan PTV 67.5Gy a

D 5% b (Gy) 70.8±0.6 72.1±1.0

D 95% (Gy) 66.9±0.1 66.4±0.3

D max

c (Gy) 73.3±1.3 74.5±1.6

D min d (Gy) 52.0±11.8 55.2±61.7

D mean e (Gy) 69.0±0.3 69.7±0.5

CI f 1.04±0.08 1.19±0.14

HI g 0.05±0.01 0.08±0.02

PTV 54Gy

D 5% (Gy) 65.1±1.3 65.6±1.2

D 95% (Gy) 53.6±0.2 53.5±1.0

D max (Gy) 70.8±0.8 72.7±1.2

D min (Gy) 31.6±5.2 35.9±3.7

D mean (Gy) 57.4±0.6 58.1±0.9

HI 0.25±0.02 0.27±0.03

PTV 48Gy

D 5% (Gy) 51.8±1.3 52.5±1.2

D 95% (Gy) 47.7±0.5 47.6±0.5

D max (Gy) 57.4±2.9 58.4±3.6

D min (Gy) 39.1±3.7 41.5±2.9

D mean (Gy) 49.7±0.6 50.0±0.7

HI 0.11±0.03 0.14±0.04

Organs at risk

D max to optic chiasm (Gy) 16.5±18.4 20.9±19.5 D max to left optic nerve (Gy) 14.9±13.2 19.3±16.1 D max to right optic nerve (Gy) 14.6±13.0 17.4±13.3 D max to spinal cord (Gy) 42.5±2.1 50.0±6.0 D max to brain stem (Gy) 44.7±12.8 52.7±12.7 D max to left lens (Gy) 3.8±1.7 5.5±3.9 D max to right lens (Gy) 3.5±1.6 5.3±3.1 D mean to left parotid gland (Gy) 20.2±1.8 26.4±2.1 D mean to right parotid gland (Gy) 21.0±7.8 27.6±10.7

a PTV nGy , planning target volume prescribed by n Gy; b D n% , dose

received by at least n% volume of a structure; c D max , maximum

dose; d D min , minimum dose; e D mean , Mean dose; f CI, Conformity

index; g HI, Homogeneity index.

(4)

than those before DPC. For an extreme case, the D max to the spinal cord and the brain stem were 45.99 Gy, and 55.56 Gy, respectively, which slightly exceeded the normal tissue tolerance guidance. 7) A representative patient’s dose dis- tributions before and after DPC are shown in Fig. 1. In this case, low dose regions remarkably increased after DPC.

The DVHs of a representative HN case are presented in Fig.

2, showing considerable increases in the doses to OARs, especially for optic chiasm, spinal cord, both lenses, and both parotid glands.

The average monitor unit (MU) efficiency after DPC became poorer showing 32.0% higher MU/Gy compared to that of the original plan. The average beam-on times of the converted plans decreased by 0.8 minutes although it did not mean the reduction of the total treatment time compared to that of original plan since the original plans were VMAT plans which delivers prescription doses more rapidly than did the SS-IMRT plans.

2. DPC for the prostate plans

The average DV parameters for the prostate plans before

a b c

d e f

Fig. 1. A representative patient’s dose distributions for the head and neck case are presented before (upper row) and after (lower row) dose volume histogram based plan conversion. Doses are shown in color wash from 40% of the prescription dose to the maximum dose.

Axial (a and d), coronal (b and e), and sagittal (c and f) planes are shown.

0 20 40 60

80

60

40

20

V olume (%)

Dose (Gy) 0

80

100 PTV67.5

PTV54 PTV48 Optic nerve (lt) Optic nerve (rt) Optic chiasm Spinal cord Brain stem Lens (rt) Lens (lt) Parotid gland (lt) Parotid gland (rt)

10 30 50 70

Fig. 2. A representative patient’s dose volume histograms (DVHs)

for the head and neck case are shown. DVHs from the original

plan are plotted with solid lines, while those from the converted

plan using the dose volume histogram based plan conversion are

plotted with dashed lines.

(5)

and after DPC are shown in Table 3. The average target ho- mogeneity after DPC became poor, showing higher values of D 5% , D max , and HI than those before DPC for both the primary and boost PTVs. The plans after DPC showed bet- ter target conformities than those before DPC for both the primary and boost plans.

For OARs, all DV parameters of the converted plans be- came poorer than those of the original plans except the

mean bladder doses. A representative patient’s dose distri- butions and DVHs before and after DPC are shown in Fig.

3 and 4, respectively. Doses to rectum extremely increased after DPC which can potentially induce acute and long- term side effects. 8,9)

The average MU efficiency after DPC improved show- ing about 19.6% decreases in MU/Gy. The average beam- on times decreased by 1.9 minutes after DPC although this cannot guarantee the reduction of the total treatment time.

Discussion

The clinical appropriateness of the DPC was demonstrat- ed in this study. Although DPC was intended to be used only for a single or a small number of fractions in the case of emergency, the dosimetric equivalence should be vali- dated before the clinical use. We found clinically relevant differences in the DV parameters for both HN and prostate cases after DPC when the converted plans were delivered during whole fractions. For the HN cases, although the DV parameters of the PTVs were still clinically acceptable after DPC, those of OARs mostly exceeded the normal tissue constraints. For the prostate cases, all DV parameters after DPC became poorer than those before DPC.

Although the user determined the number of fields when creating the converted plan, there are differences between the user input and the actual number of fields in HN cases.

The relatively large target volumes cannot be fully covered with a single collimator position in the designated gantry angle, thereby the actual number of fields has increased from the user input.

One thing that should be checked when summing two plans, i.e., sequential deliveries of the primary and boost plans, is that the gantry angles of the boost plan could be overlapped with those of the primary plans, which is not desirable in terms of spreading doses over a patient body to avoid irradiations of high or intermediate doses to normal tissue. Although a single fraction in this study could influ- ence about 3.3% and 2.2% to the entire dose distribution for the HN (30 fractions) and the prostate (45 fractions) plans, respectively, the final plan should be dosimetrically verified when applying the patient’s treatment.

There exist several constraints in the use of DPC. When Table 3. The DV parameters before and after DPC for the prostate

VMAT plans. Note that the DV parameters for the OARs were evaluated in the sum plan.

Original plan Converted plan Primary PTV a

D 5% b (Gy) 52.2±0.2 54.2±1.0

D 95% (Gy) 49.9±0.1 49.5±0.1

D max

c (Gy) 53.9±0.6 55.8±1.3

D min d (Gy) 40.0±10.2 42.7±1.3 D mean e (Gy) 51.2±0.1 52.6±0.5

CI f 0.92±0.01 1.01±0.04

HI g 0.04±0.01 0.09±0.02

Boost PTV

D 5% (Gy) 31.7±0.1 32.3±0.5

D 95% (Gy) 30.3±0.0 30.1±0.1

D max (Gy) 32.5±0.2 32.7±0.5

D min (Gy) 27.8±0.4 27.2±0.6

D mean (Gy) 31.1±0.1 31.5±0.3

CI 0.91±0.00 0.94±0.03

HI 0.04±0.00 0.07±0.02

Organs at risk Rectum

D 60% (Gy) 32.1±2.3 42.0±4.7

D 20% (Gy) 63.4±2.0 66.4±1.8

D mean (Gy) 41.7±2.2 47.8±3.5

V 70Gy h (cc) 11.0±6.3 12.1±7.3 Bladder

D 50% (Gy) 20.0±11.6 20.2±11.3

D 20% (Gy) 49.2±9.6 49.4±10.4

D mean (Gy) 28.8±9.4 28.6±9.1

V 70Gy (cc) 17.4±3.7 18.2±4.1

Femur head

D max (Gy) 31.3±4.4 39.3±4.6

D mean (Gy) 14.0±4.4 16.8±5.3

D 50% (Gy) 13.4±5.5 16.8±7.1

D 10% (Gy) 21.9±3.2 27.6±3.7

a PTV, planning target volume; b D n% , dose received by at least n%

volume of a structure; c D max, maximum dose; d D min , Minimum

dose; e D mean , mean dose; f CI, conformity index; g HI, homogeneity

index; h V nGy , the percent volume receiving n Gy.

(6)

the original plan is arranged with flattening filter free (FFF) beams, selection of FFF beams in the converted plan is not available although the target machine has the FFF beam mode. Furthermore, DPC does not support the plans cal- culated with the Acuros ® XB advanced dose calculation (Varian Medical Systems, Palo Alto, CA), allowing only plans calculated with the AAA algorithm. Because there ex- ist several limitations and clinically unacceptable changes may occur in the dose distributions when applying DPC, it

is necessary to use DPC only for the small number of frac- tions with careful review.

Conclusion

The converted plans with the DPC might show degraded plan qualities compared to those of the original plans.

Therefore, when applying the DPC, careful review on the converted plans is required.

Acknowledgements

This work was supported by the National Research Foundation of Korea (NRF) grant funded by the Korea government (MSIP) (No.2017M2A2A7A02020641 and 2017M2A2A7A02020643).

Conflicts of Interest

The authors have nothing to disclose.

Availability of Data and Materials

All relevant data are within the paper and its Supporting Information files.

a b c

d e f

Fig. 3. A representative patient’s dose distributions for the prostate case is presented before (upper row) and after (lower row) dose volume histogram based plan conversion. Doses are shown in color wash from 30% of the prescription dose to the maximum dose. Axial (a and d), coronal (b and e), and sagittal (c and f) planes are shown.

0 20 40 60

80

60

40

20

V olume (%)

Dose (Gy) 0

80

100 PTV_primary

PTV_boost Rectum Bladder Femur head

10 30 50 70 90

Fig. 4. A representative patient’s dose volume histograms (DVHs)

for the prostate case are shown. DVHs from the original plan are

plotted with solid lines, while those from the converted plan using

the dose volume histogram based plan conversion are plotted

with dashed lines.

(7)

References

1. Krishna GS, Srinivas V, Ayyangar K, Reddy PY. Compara- tive study of old and new versions of treatment planning system using dose volume histogram indices of clinical plans. J Med Phys. 2016;41(3):192.

2. Hirata T, Kishi N, Imai Y, et al. Dose Volume Parameters as Predictors for Radiation-Induced Hypothyroidism After IMRT or VMAT for Head and Neck Squamous Cell Carci- noma: Comparison of the Availability Between Mean Thy- roid Dose and Median Thyroid Dose. Int J Radiat Oncol Biol Phys. 2016;96(2):E365.

3. Kim MY, Yu T, Wu H-G. Dose-volumetric parameters for predicting hypothyroidism after radiotherapy for head and neck cancer. Jpn J Clin Oncol. 2014;44(4):331-37.

4. Park JM, Park S-Y, Choi CH, Chun M, Kim JH, Kim J-I.

Treatment plan comparison between Tri-Co-60 magnetic- resonance image-guided radiation therapy and volumet- ric modulated arc therapy for prostate cancer. Oncotarget.

2017;8(53):91174.

5. Treutwein M, Hipp M, Koelbl O, Dobler B. Searching stan- dard parameters for volumetric modulated arc therapy (VMAT) of prostate cancer. Radiat Oncol. 2012;7(1):108.

6. Zulkafal H, Khan M, Ahmad M, Akram M, Buzdar S, Iqbal K. Volumetric modulated arc therapy treatment planning assessment for low-risk prostate cancer in radiotherapy.

Clin Cancer Investig J. 2017;6(4):179-83.

7. Emami B, Lyman J, Brown A, et al. Tolerance of normal tis- sue to therapeutic irradiation. Int J Radiat Oncol Biol Phys.

1991;21(1):109-22.

8. Lesperance RN, Kjorstadt RJ, Halligan JB, Steele SR.

Colorectal complications of external beam radiation versus brachytherapy for prostate cancer. Am J Surg.

2008;195(5):616-20.

9. Lawton CA, Michalski J, El-Naqa I, et al. RTOG GU Radia-

tion oncology specialists reach consensus on pelvic lymph

node volumes for high-risk prostate cancer. Int J Radiat

Oncol Biol Phys. 2009;74(2):383-87.

수치

Table 1. Treatment plan parameters before and after DPC.
Table 2. The DV parameters before and after DPC for the HN  VMAT plans. Original   plan Converted plan PTV 67.5Gy a    D 5% b  (Gy) 70.8±0.6 72.1±1.0    D 95%  (Gy) 66.9±0.1 66.4±0.3    D max c  (Gy) 73.3±1.3 74.5±1.6    D min d  (Gy) 52.0±11.8 55.2±61.7
Fig. 2. A representative patient’s dose volume histograms (DVHs)  for the head and neck case are shown
Fig. 3. A representative patient’s dose distributions for the prostate case is presented before (upper row) and after (lower row) dose  volume histogram based plan conversion

참조

관련 문서

To review the distinctive features and potential problems of Korean government plans this report analyzes the case of Power Development Plan and Housing Development Plan. In

As part of this tender, the tenderer are required to make an similar boat available for a user evaluation test in connection with the evaluation of the tenderers best and

하악지의 내면 한가운데 있으며, 하치조신경과 혈관이

이하선의 실질 속에서 하악경의 후내측에서 나와 하악지의 내측면을 따라 앞으로 간다. (귀밑샘 부위에서 갈라져 나와

Dependence of the chemical potentials of solid, liquid and gas phases on temperature at constant pressure.. The dashed lines are for

• Since time is required in building up or depleting a charge distribution, the stored charge must inevitably lag behind the current in a time-dependent problem.. This is

SigmaNEST 펀칭 파워팩 제품 관리, 자동 다이나믹™ 배 열 및 펀칭 툴 관리를 갖춘 터렛 펀칭 프로그래밍을 위한 가장 완벽하고 최적화된

1 John Owen, Justification by Faith Alone, in The Works of John Owen, ed. John Bolt, trans. Scott Clark, "Do This and Live: Christ's Active Obedience as the