Continuous three dimensional displacements monitoring for assessment of the slope stability: A case study of limestone quarry
K. Hirabayashi, K. Nakaya & N. Shimizu (Yamaguchi University, Japan) S. Matsubara & T. Matsumoto (Shyuho Mining Co., LTD., Japan)
1. INTRODUCTION
Slope failures and landslides often bring large damage to public and private property. Development of methods for monitoring and assessing the slope stability is, therefore, a crucial issue in the rock engineering field.
The third author and his colleagues have developed a displacement monitoring system using the Global Positioning System (GPS) to settle the above problems1-3. The system can continuously monitor three-dimensional displacements at many points over an extensive area with high accuracy and it can display the results on a monitor screen in real time. The system is easy to use in practice and it can reduce the costs related to long-term monitoring.
Most of limestone quarries in Japan are open mines and large rock slopes are built after mining. The authors have studied the monitoring of slope stability by using the GPS in Shyuho Mining since 1995.
This paper describes the results of three dimensional displacement measurements for last 5 years, and assesses the stability of slopes coupling with measurement and analysis results.
2.
LONG-TERM MEASUREMENTS AT SHYUHO LIMESTONE QUARRY
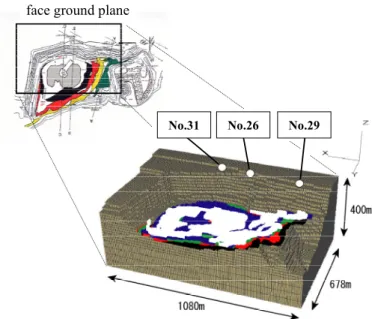
The area of the quarry is approximately 2,000 m in length by 600 m in width (see Fig. 1). The quarry contains 4 billion tons of limestone reserves. The height of the slope at present is above 150 m, but the final height will be 300 m. The height of each bench is 15 m and the average angle of the slope is 60 degree. One bench is excavated every year and a half.
The online monitoring system described in Fig. 2 is used here, and the displacements are measured and plotted on the monitor screen of a PC every hour in real time. Small antennas (sensors) are set on the measurement points No.26, No.29 and No.31 located around the crest of the slope (see Fig. 3). Another sensor, No.28, is set at the bench mark point. All sensors receive the data transmitted from the GPS satellites, and transfer them through a cable to a personal computer in the control office. The cable also provides power to the receivers. The computer has automatically control over the entire system and analyzes the data in order to obtain displacements at all the measurement points.
Fig. 4 shows a portion of the continuous monitoring results at measurement point No.26 from June 2003 to December 2007. The red lines show the results of the data smoothed by the trend model. The small displacement toward east and upward has been detected in this period.
한국암반공학회 국제학술회의
2008 / 2008.10.21 - 10.23
Fig. 1 Shyuho limestone quarry in Yamaguchi, Japan
data data transfer
power supply
GPS satellite receiver
Fig. 2 GPS displacement monitoring system
No.31 No.26 No.29 No.28
PC monitor in the control office
Fig. 3 Location of GPS sensors No.26 (Measurement point) No.29 (Measurement point)
No.31 (Measurement point) No.28 (Reference point)
latitude [mm]
k=1 τ=0.04mm σ=3.9mm
k=1 τ=0.01mm σ=4.3mm
k=1 τ=0.02mm σ=5.1mm
2/6/2003 6/5/2005
22/11/2005 31/12/2007
8/11/2005 1/5/2005
2/9/2003 3/12/2003 4/3/2003 4/6/2004 4/9/2004 5/12/2004 6/8/2005
22/2/2006 25/5/2006 25/8/2006 25/11/2006 25/2/2007 28/5/2007 28/8/2007
(a) displacement in the direction of latitude
longitude [mm]
k=1 τ=0.04mm σ=3.5mm
k=1 τ=0.03mm σ=4.4mm
k=1 τ=0.05mm σ=4.8mm
2/6/2003 6/5/2005
22/11/2005 31/12/2007
8/11/2005 1/5/2005
2/9/2003 3/12/2003 4/3/2003 4/6/2004 4/9/2004 5/12/2004 6/8/2005
22/2/2006 25/5/2006 25/8/2006 25/11/2006 25/2/2007 28/5/2007 28/8/2007
(b) displacement in the direction of longitude
height [mm]
k=1 τ=0.04mm σ=11.2mm k=1
τ=0.10mm σ=8.4mm
k=1 τ=0.03mm σ=10.5mm
2/6/2003 6/5/2005
22/11/2005 31/12/2007
8/11/2005 1/5/2005
2/9/2003 3/12/2003 4/3/2003 4/6/2004 4/9/2004 5/12/2004 6/8/2005
22/2/2006 25/5/2006 25/8/2006 25/11/2006 25/2/2007 28/5/2007 28/8/2007
(c) vertical displacement
Fig. 4 Measurement results by GPS displacement monitoring system (No.26, June 2003- Dec. 2007)
3. COMPARISON OF MEASURED DISPLACEMENTS AND ANALYTICAL ONES
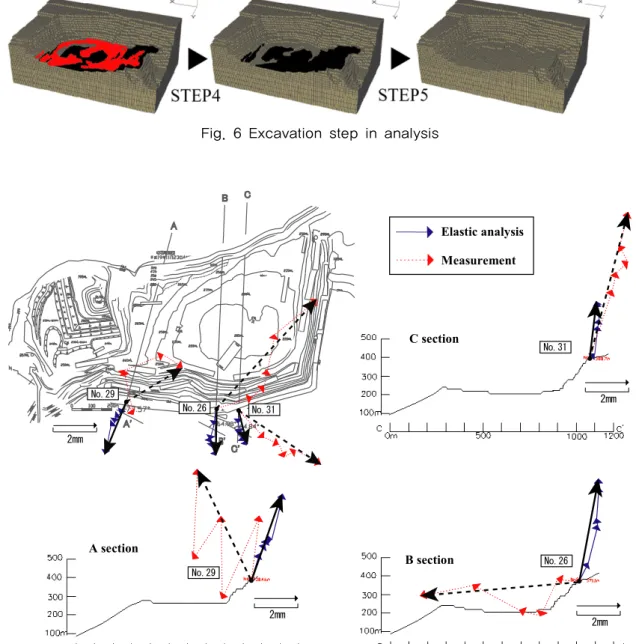
In order to interpret the measurement results for assessing the stability of the slope, three-dimensional elastic analysis is conducted. Measured displacements are compared with analytical results. A model for analysis is shown in Fig. 5. The area of the model is 678×1080×400m. FLAC3D4 is used for the analysis. Input parameters are shown in Table 1. The excavation process of analysis is divided into five
A-C, respectively. Elastic displacements tend to direct upward and backward to the slope. The direction of measured displacement at No.31 almost coincides with the direction obtained from elastic analysis. It means that slope around No.31 behaves elastic and then it is stable.
On the other hand, the displacement measured at No. 26 behaves inelastic. The direction of measured displacement differs from the direction obtained by elastic analysis. The real displacement goes downward although elastic one goes upward. The measured displacement at No.29 repeats elastic and inelastic behavior.
Since the total amount of those displacements is small, the slope is stable at present. It should be, however, carefully monitored whether such a behavior causes the instability of the slope.
No.29 face ground plane
No.31 No.26
Fig. 5 Model for three-dimensional elastic analysis
Table 1. Input parameters for elastic analysis
Modulus of elasticity [GPa] 10
Poisson’s Ratio 0.25
Density [kg/ m3] 2700
Table 2. Excavation step and period
STEP1 6/2003-5/2004 STEP2 6/2004-5/2005 STEP3 6/2005-11/2005 STEP4 12/2005-9/2006 STEP5 10/2006-11/2007
No.31 No.26 No.29
Fig. 6 Excavation step in analysis
2mm No.29
No.26 No.31
No.31
2mm
No.26
2mm No.29
2mm
Elastic analysis Measurement
A section
B section C section
Fig. 7 Comparison of measured and analytical displacements
4. ASSESSMENT OF THE SLOPE STABILITY
4.1 Outline of the methodThe purpose of the method5-6 applied to measured displacements here is to detect a potential failure mode, namely, plane sliding, wedge sliding and toppling, and a potential failure area. The method uses geometrical data on the slope and its rock discontinuities (the strike, the dip, etc.), because geometrical data are easy to obtain compared with stress, force, and mechanical parameters.
Fig. 8 shows the distribution of the poles of the discontinuities located in a rock slope. The slope face is represented as a great circle in this figure. The poles, which are plotted within the crescent-shaped region formed by the friction circle and the daylight envelope, indicate kinematically feasible sliding planes.
When a displacement is measured on the slope, the pole corresponding to the direction of the measured displacement can be plotted on a stereonet. The feasible sliding planes can then be detected around the pole representing the direction of the displacement.
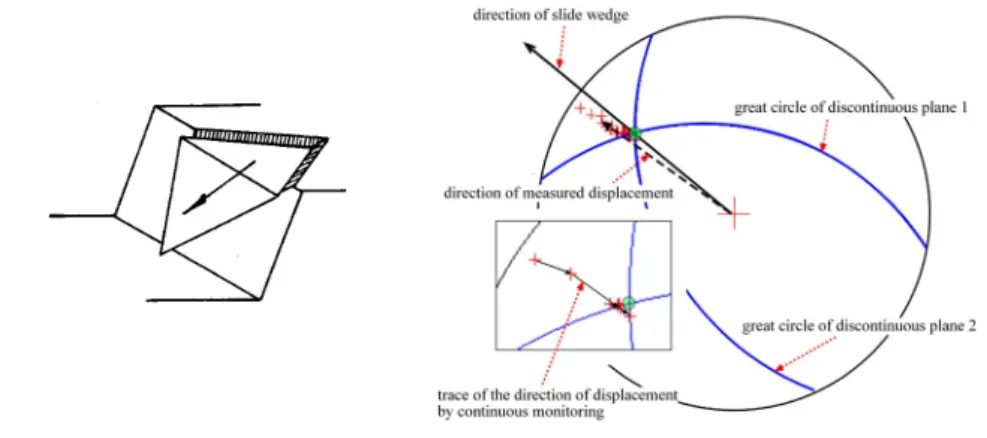
On the other hand, if the direction of measured displacement coincides with the direction of the intersection line of a rock wedge, wedge failure may be occurring. Plotting the direction of the displacements obtained by continuous monitoring on the stereonet leads to the discovery of which rock wedge has the potential to slide, as shown in Fig. 9.
(a) plane failure (b) measured displacement on a stereonet
Fig. 8 Graphic representation of discontinuities together with a displacement vector on a stereonet (plane failure)
(a) wedge failure (b) measured displacement on a stereonet
Fig. 9 Identification of a sliding wedge from the direction of the measured displacement (wedge failure)
4.2 Application of the method to measured displacements
Since the measured displacement at No. 26 differs from elastic one as shown in Fig. 7, the method outlined in 4.1 is applied to investigate whether it indicates plane failure mode or not. The poles of incremental measured displacements and the total measured displacements are plotted in Fig. 10(a) and Fig. 10(b), respectively. The number of each pole represents displacement measured during (1) June 2003- May 2004, (2) June 2004- May 2005, (3) June 2005-Nov. 2005, (4) Nov. 2005-Sept. 2006 and (5) Oct. 2006-Nov. 2007.
The pole of measurement displacement does not concentrate in an unstable region (the crescent-shaped region), and since the amount of displacement is small enough, it is found that a plane slide doesn’t occur and the slope around No. 26 is stable. The similar result is obtained at No.29.
2mm 2mm
2mm 2mm
①
② ③
④
⑤
①
②
③
⑤ ④
①②③
④
⑤
①
②
③
⑤ ④
①
④ ③
② ⑤ ③ ①
④
②
⑤
B section B section
(a) poles of incremental displacements (b) poles of total displacements Fig. 10 Poles of displacement vectors on stereonet for detecting plane failure mode from
measurement results (No.26)
5. CONCLUSIONS
This paper described the measurement results of a limestone quarry by using GPS displacement monitoring system and interpreted them to assess the stability of the slope. The conclusions are summarized as follows;
- Three dimensional displacements were measured continuously for last 5 years with high accuracy.
The GPS displacement monitoring system is quite useful and reliable for continuously long-term monitoring large slopes.
- It was found that measured displacements exhibited elastic behavior at one measurement point and inelastic behavior at other measurement points after comparing with three-dimensional elastic analysis. Since the total amount of displacement was several mm for last 5years, it could be interpreted that the slope is stable at present.
- In order to investigate whether inelastic behavior indicates a failure mode, the proposed method was applied to measured displacements. The direction of measurement displacement didn’t concentrate in an unstable region on stereonet representing rock discontinuities existing in the slope, and there were no signs which became unstable.
REFERENCE
1. Kondo, H., M. Cannon, N. Shimizu and K. Nakagawa, 1996, Developments of a ground displacement monitoring system by using the Global Positioning System. Journal of Construction Management and Engineering, Japan Society of Civil Engineering, 546/6-32, 157-168.
2. Shimizu, N., 1999, Displacement monitoring by using Global Positioning System for assessment of rock slope stability. Proc. of the 9th Int. Congress on Rock Mechanic, 1435-1438.
3. Masunari, T., K. Tanaka , N. Okubo, H. Oikawa , K. Takechi , T. Iwasaki and N. Shimizu, 2003, GPS Continuous Displacement Monitoring System, Int. Sympo. Field Measurements in Geomechanics, FMGM03, 537-543.
4. Itasca, 2005, FLAC3D ver3.0, Minnesota.
5. Shimizu, N. and H. Matsuda, 2002, Practical applications of the Global Positioning System for the assessment of slope stability based on the Displacement Monitoring Approach, Keynote Lecture, ISRM Regional Symposium, KJ-Rock2002: 57-70.
6. Matsuda, H. and N. Shimizu, 2004, Assessment of rock slope stability based on the three- dimensional continuous displacement monitoring by GPS, proceedings of ISRM Int. Sym. 3rd ARMS, Kyoto, 273-278.