≫ 연구논문 ≪
희유금속 비축 적정성 평가체계 수립
김유정*·김대형*·김진수**·§김주한**
*한국지질자원연구원, **한양대학교 자원환경공학과
Development of The Criticality Evaluation System for Rare Metals Stockpiling
Yu-Jeong Kim*, Dae-Hyung Kim*, Jinsoo Kim** and §Juhan Kim**
*Korea Institute of Geoscience and Mineral Resources
**Department of Earth Resources and Environmental Engineering, Hanyang University
요 약
우리나라의 희유금속 수입액은 6,034 백만불에 달하나 국내 희유금속 자급률은 1% 수준에 불과하여 효율적인 비축제도의 운영 이 필요하다. 이에 본 연구에서는 효율적인 비축전략 수립을 위해 비축 대상이 되는 희유금속의 유·무형 위험 요인을 정량화하여 비축 적정성을 평가할 수 있는 체계를 수립하였다. 본 연구에서 개발한 모형은 중장기적인 관점에서 기술변화와 시장변화에 맞추어 우선 비축이 요구되는 희유금속을 선별하고 비축정책의 방향성을 제시하는데 그 목적이 있다. 모형을 통해 도출된 평가결과는 위험 상태 행렬(criticality matrix)로 표현되어 희유금속의 안보수준을 정량적으로 측정할 수 있으며 상대비교를 가능케 한다. 따라서 향 후 정책수립에 있어 본 논문에서 제안한 모형이 활용된다면 보다 효율적인 비축정책 수립이 가능할 것으로 기대된다.
주제어 : 희유금속, 비축, 평가체계, 적정성
Abstract
The import amount of rare metal in Korea is about 6,034 million USD, but the self-sufficiency of rare metals is about only 1%. In order to secure the stable supply of rare metals, it is necessary to operate an efficient stockpile system. In this study, we established a system to assess the adequacy of stockpiles by quantifying the risk factors of tangible and intangible risks in order to establish an efficient stockpile strategy. The model developed in this study aims to select the rare metals that need to be stock- piled first and to suggest the direction of the stockpiling policy in accordance with technological change and market change from the mid and long term viewpoint. The evaluation results derived from the model can quantitatively measure the security level of each rare metal and enable relative comparison between the rare metals using criticality matrix. Therefore, it is expected that more efficient stockpile policy will be possible if the proposed model is utilized in the future policy making.
Key words : rare metals, stockpiling, evaluation system, criticality
· Received : April 16, 2018 · Revised : May 17, 2018 · Accepted : May 24, 2018
§Corresponding Author : Juhan Kim (E-mail: [email protected])
Department Earth Resources and Environmental Engineering, Hanyang University, 222 Wangsimni-ro, Seongdong-gu, Seoul 04763, Korea
ⓒThe Korean Institute of Resources Recycling. All rights reserved. This is an open-access article distributed under the terms of the Creative Commons Attribution Non-Commercial License (http://creativecommons.org/licenses/by-nc/3.0/), which permits unrestricted non-commercial use, distribution and reproduction in any medium, provided the original work is properly cited.
1. 서 론
희유금속(rare metal)은 철·동·알루미늄 등과 같이 산업적으로 대량 생산되는 보통금속(common metal)에 대응되는 개념이다. 희유금속의 분류는 각국의 산업특 성에 따라 차이가 있으며 우리나라의 경우 총 35종의 금속을 희유금속으로 분류하고 있다1). 희유금속은 우리 나라의 주력산업인 반도체, 자동차, 디스플레이, 휴대전 화, 철강 분야의 필수 원료로 널리 사용되고 있다2).
첨단 산업부문의 발전과 기술의 확산은 희유금속의 수요 증가를 이끌어 소비되는 광종의 다양성 또한 증가 시켰다. 그러나 우리나라는 희유금속 수요 전량을 수입 에 의존하고 있는 실정이다. 이러한 상황을 고려할 때 희유금속의 비축제도를 분석하고 비축대상 광물의 위험 수준과 비축의 우선순위를 선별할 수 있는 평가체계가 필요하다. 이에 본 연구에서는 희유금속의 시장특성과 우리나라의 비축제도를 고려하여 위험상태 행렬 (criticality matrix) 기반의 희유금속 비축 적정성 평가 체계를 개발하였다.
2. 우리나라의 광물자원 비축제도
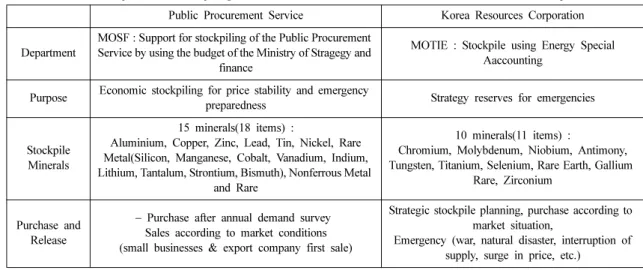
우리나라는 1967년 조달 기금법을 제정한 이래 현재 까지 비축제도를 운영하고 있으며 원유를 제외한 비축 업무는 조달청(Public Procurement Service)이 담당하고 있다. 광물분야의 경우는 2007년부터 이원화 되어 한국 광물자원공사(Korea Resources Corporation)가 희유금
속 10개 광종의 장기 전략 비축을, 조달청이 희소금속 9개 광종을 포함한 총 15개 광종(18 품목)의 상시 비축 을 담당하고 있다. 조달청과 한국광물자원공사는 각각의 상위기관인 기획재정부(Ministry of Strategy and Finance, MOSF)와 산업통상자원부(Ministry of Trade, Industry and Energy, MOTIE)와 협의하여 비축목표 수립, 비축 품목의 수, 비축품목의 구매 및 방출을 시행하고 있다.
다음 Table 1은 조달청과 광물자원공사의 비축품목, 비 축목표, 구매 및 방출 계획을 비교·분석한 표이다.
비축의 대상품목과 비축량은 경제 및 산업 발전에 따 라 지속적으로 변화하였다. 초기에는 철근, 면사 등 불 화재고물자를 중심으로 단기 물가안정을 위한 비축을 진행하였으나 최근에는 중장기적 물가안정 및 국내 산 업지원을 위해 비철금속과 희유금속을 중점적으로 비축 하고 있다. 현재 조달청은 2017년 기준(기획재정부 고 시 제2014-6호) 18개 품목을 비축하고 있으며 공급차질 가능성, 국내기업(특히 중소기업)의 수요 등에 따라 목 표 비축량을 품목별로 차등화하고 있다. 조달청의 2016 년 주요 금속 비축현황을 보면 2015년 기준 국내 수입 수요의 약 50일분에 달하는 비축재고를 보유하고 있다.
한국광물자원공사는 한국광물자원공사법 제10조 1항 3호(광산물의 비축) 및 제16조를 근거로 광물비축을 수 행하고 있다. 한국광물자원공사의 비축은 국가 비상시 를 대비한 장기, 전략 비축사업으로 2007년 비축을 시 작한 이후 현재까지 방출 사례가 없다. 현재 광물자원 공사는 희유금속 10광종, 국내 수요량의 64.5일 분량을 비축하고 있다3).
Table 1. Comparison of stockpiling between Public Procurement Service and Korea Resources Corporation Public Procurement Service Korea Resources Corporation
Department
MOSF : Support for stockpiling of the Public Procurement Service by using the budget of the Ministry of Stragegy and
finance
MOTIE : Stockpile using Energy Special Aaccounting
Purpose Economic stockpiling for price stability and emergency
preparedness Strategy reserves for emergencies
Stockpile Minerals
15 minerals(18 items) :
Aluminium, Copper, Zinc, Lead, Tin, Nickel, Rare Metal(Silicon, Manganese, Cobalt, Vanadium, Indium, Lithium, Tantalum, Strontium, Bismuth), Nonferrous Metal
and Rare
10 minerals(11 items) :
Chromium, Molybdenum, Niobium, Antimony, Tungsten, Titanium, Selenium, Rare Earth, Gallium
Rare, Zirconium
Purchase and Release
− Purchase after annual demand survey Sales according to market conditions (small businesses & export company first sale)
Strategic stockpile planning, purchase according to market situation,
Emergency (war, natural disaster, interruption of supply, surge in price, etc.)
3. 희유금속 비축 적정성 평가체계 3.1. 희유금속 비축평가체계의 기본 구조
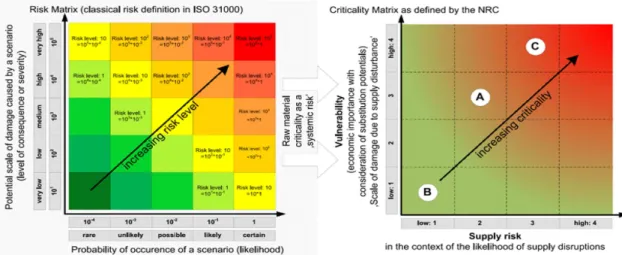
미국의 Natural Resource Commission은 환경공학 분야에서 활용되는 general risk matrix를 이용하여 광 물 자원의 위험 수준을 평가할 수 있는 위험상태 행렬 를 제안하였다4). 해당 방식은 이차원 평면상에 광물별 로 측정된 값을 도식하는 방식으로 각 축은 광물자원의 공급 및 수요 등과 관련된 위험 요소들로 정의된다. 다 음 Fig. 1은 general risk matrix와 위험도 매트릭스를 나타낸다5).
다음 Fig. 2는 위험상태 행렬를 활용한 희유금속 비 축평가 체계의 평가과정을 나타낸다. 평가 과정은 다음 과 같다. 첫째, 분석 대상이 되는 광물의 후보군을 선정 한다. 본 연구에서는 조달청의 비축품목을 대상 광물로 선정하였다. 둘째, 위험(risk) 요인을 식별하고 이를 통 해 위험수준을 측정할 수 있는 지표들을 선정한다. 본 연구에서는 위험 요인을 크게 공급위험(supply risk), 취 약성(vulnerability), 경제적 중요성(economic importance) 으로 분류하였다. 각각의 지표들은 3개의 위험요인으로 구성되어 모형은 총 9개의 하위지표를 갖는다. 해당 지 표들을 통해 정량화 된 값은 위험상태 행렬에 도시된다.
다음은 matrix 상에 평가기준을 설정한다. 이후 도시된 결과와 평가기준을 통해 광물의 위험수준과 비축 우선 순위를 결정한다. 해당 방식을 활용할 경우 광물의 위 험수준에 대한 정량적 평가가 가능하다. 위험상태 행렬 평가에 대한 자세한 논의는 김주한 외(2016)에서 확인
Fig. 1. Criticality matrix for security evaluation of mineral resources.
Fig. 2. The framework for evaluation system for rare metals stockpiling.
Fig. 3. Structure of the indicators for the evaluation system.
할 수 있다.6)
다음 Fig. 3은 희유금속 비축 적정성 평가를 위해 본 연구에서 설정한 지표 및 지표의 구조를 나타낸다.
비축평가체계의 평가 지표는 공급 위험, 취약성, 경제적 중요성에 관한 세부지표로 구성된다. 각 지표는 국내 시 장과 세계 광물시장 상황을 포괄적으로 고려하여 비축 적정성을 정량적으로 평가하기 위해 특수성과 범용성을 고려하여 설정되었다. 다음 절에서는 해당 지표들에 대 한 상세 설명을 다룬다.
3.2. 희유금속 비축평가체계의 지표구성
3.2.1. 공급 위험(supply risk) 구성
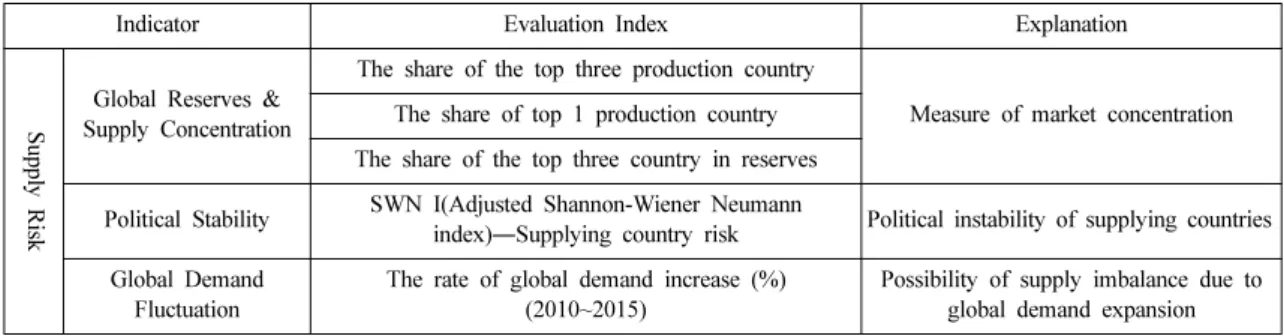
공급 위험(supply risk)은 공급과 관련한 위험 요인으 로 구성된다. 공급 위험은 광종의 매장 및 공급 독과점 성(global reserves & supply concentration), 생산국가 의 불안정성(political stability), 세계 수요 변동성 (global demand fluctuation) 등을 중심으로 평가된다.
공급 위험은 광물의 매장과 생산이 특정 국가에 편중되 어 있을수록, 공급국가의 정치적 위험이 높을수록, 세계 수요가 확대되고 수요의 변동성이 높을수록 높이 평가 된다. 다음 Table 2는 본 연구에서 설정한 공급 위험을 구성하는 평가 지표 및 내용을 나타낸다. 본 연구에서 설정한 모든 지표는 5점 척도로 구성되었다.
3.2.1.1. 매장량 및 공급의 독과점성(Global Reserves
& Supply Concentration)
매장량 및 공급의 독과점성은 생산 및 부존의 독과점 정도를 측정하는 지표이다. 해당 지표는 공급 측정의 주 요 요소이다. 이는 특정국가에 생산 및 광물의 부존이 집중되어 있을 경우 공급 구조 변화 또는 중단이 발생
했을 때 그 영향이 보다 크게 나타나기 때문이다. 본 연구에서는 공급독과점성을 생산 상위 3개국의 점유율, 생산 상위 1개국의 점유율, 매장량 상위 3개국의 점유 율 값을 적용하여 평가하였다.
3.2.1.2. 공급국가의 불안정성(Political Stability) 공급국가의 불안정성은 공급국가의 다양성과 해당 국 가들의 정치적 불안정성을 반영한 지표이다. 생산 국가 의 정치적 불안정성은 공급의 불안정으로 직결된다. 본 연구에서는 SWN1 (Adjusted Shannon-Wiener-Neumann1 Index)을 활용하여 공급국가의 정치적 불안정성을 평가 하였다7). 정치적 불안정성을 평가하는 세부 지표로는 세계은행(World Bank)에서 발표하는 Worldwide Governance Indicators (WGI)를 활용하였다. WGI는 국가의 정치적 안정성을 수치화 한 지표이다. SWN1 모형에 WGI 지표값을 적용하면 공급국가의 불안정성 에 대한 정량화가 가능하다. 다음은 SWN1의 산출 방 식을 나타낸다.
WGIi : i 국가의 WGI
xi,j: i 국가로부터 수입하는 광종(품목) j의 수입량
3.2.1.3. 세계수요 변동성(Global Demand Fluctuation) 수요가 큰 폭으로 변할 경우 수급의 불균형이 발생할 가능성이 존재한다. 이에 본 연구에서는 세계 광물 수 요의 연평균 증가율을 활용하여 수요의 변동성을 평가 하였다. 해당 지표의 경우 연평균 증가율이 높아질수록 비축에 대한 수요 또는 광종의 위험수준이 증가하는 것 으로 해석할 수 있다.
SWN1 =
∑i j,
– WGIi×xj i,× xln j i,
Table 2. Evaluation indicator for supply risk
Indicator Evaluation Index Explanation
Supply Risk
Global Reserves &
Supply Concentration
The share of the top three production country
Measure of market concentration The share of top 1 production country
The share of the top three country in reserves
Political Stability SWN I(Adjusted Shannon-Wiener Neumann
index)―Supplying country risk Political instability of supplying countries Global Demand
Fluctuation
The rate of global demand increase (%) (2010~2015)
Possibility of supply imbalance due to global demand expansion
3.2.2. 취약성(vulnerability)
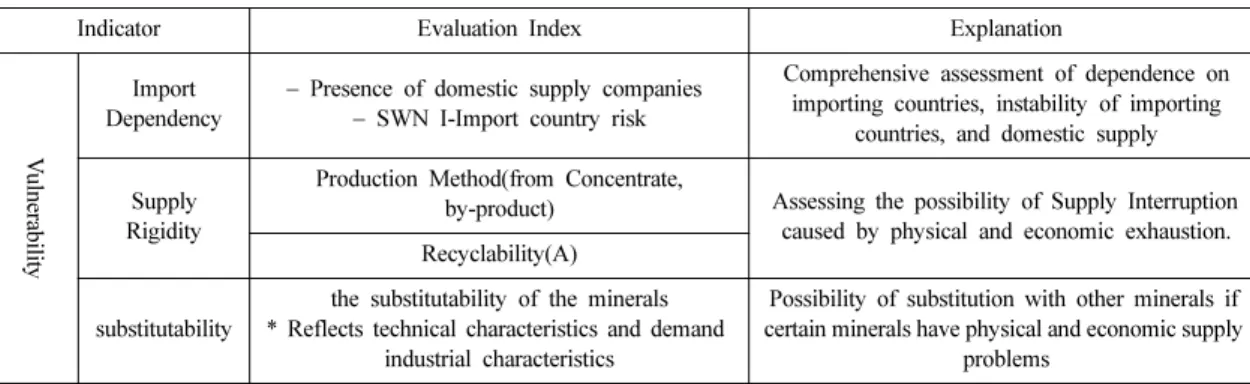
취약성은 공급 중단과 같은 물리적 중단이 발생했을 경우의 대응능력을 평가하는 지표이다. 본 연구에서는 취약성과 관련한 요소를 수입의존도(import dependency), 공급의 경직성(supply rigidity), 대체 가능성(sub- stitutability)으로 구분하여 측정하였다. 취약성은 수입 의존도가 높을수록, 대체가능성이 낮을수록, 재활용률이 낮고 생산 방식으로 인한 공급 탄력성이 낮을수록 취약 성이 높은 것으로 평가하였다. 다음 Table 3은 취약성 지표를 구성하는 평가지표 및 평가 내용을 나타낸다.
3.2.2.1. 수입 의존도(Import Dependency)
수입의 의존도는 자원 확보의 취약성을 측정하는 지 표로 자급률을 통해 측정된다. 해당 지표는 국내공급기 업의 유무와 수입국가 의존성, 수입국가 불안정성을 종 합하여 평가된다. 국내에 광물을 공급하는 기업이 존재 하는 경우는 공급 기업이 없는 경우와 비교하여 상대적 으로 수입의 불안정성이 낮다. 따라서 본 연구에서는 이 를 분리하여 평가에 반영하였다.
3.2.2.2. 공급 경직성(Supply Rigidity)
해당 지표는 공급의 경직 정도를 평가한 지표이다.
지표의 평가는 광물의 생산방법, 재활용률을 종합적으 로 고려하여 평가된다. 생산방법 평가는 다음과 같다.
생산방법은 생산 형태에 따른 차이를 활용하여 평가된 다. 생산형태를 크게 정광(concentrate), 부산물(by- product), 혼합(concentrate + by-product) 등으로 구분 하여 공급의 경직성을 평가한다. 부산물 형태로 생산되 는 경우 공급의 가격탄력성이 낮아, 공급을 즉각적으로 늘리는 것에 한계가 있다. 따라서 부산물 형태로만 생 산되는 경우는 높은 경직성을 갖는다. 이에 반해 정광 및 부산물의 혼합으로 생산되는 경우는 부산물로만 생 산되는 광물보다는 상대적으로 경직성이 낮은 것으로 평가하였다. 다음 Table 4는 희유금속의 생산방식 분류 및 대상광종을 나타낸다.
재활용률의 경우 재활용률이 높을수록 자원에 대한 생산 가능성이 증가한다. 금속 또는 광물을 물질흐름 측 면에서 살펴보면 과거에는 채굴 외에는 주요 공급원이 없었으나 최근에는 자원순환이 활성화 되어 2차 자원 역시 주요 자원의 공급원 중 하나이다. 여기서 2차 자 원은 제조공정에서 발생된 가공스크랩 및 내구년수가 끝나 사용 후 배출된 폐제품으로부터 회수한 재생 자원 을 뜻한다. 본 연구에서는 재활용률이 높을수록 낮은 경 직성을 갖는 것으로 평가하였다. 재활용률은 UNEP에서 평가한 광종별 재활용률을 사용하여 평가된다8).
3.2.2.3. 대체 가능성(Substitutability)
대체가능성 평가는 (EC, 2017)의 광종별 대체가능성 Table 3. Evaluation indicator for vulnerability
Indicator Evaluation Index Explanation
Vulnerability
Import Dependency
− Presence of domestic supply companies
− SWN I-Import country risk
Comprehensive assessment of dependence on importing countries, instability of importing
countries, and domestic supply
Supply Rigidity
Production Method(from Concentrate,
by-product) Assessing the possibility of Supply Interruption caused by physical and economic exhaustion.
Recyclability(A)
substitutability
the substitutability of the minerals
* Reflects technical characteristics and demand industrial characteristics
Possibility of substitution with other minerals if certain minerals have physical and economic supply
problems
Table 4. Production method of rare metals
Production Method of Rare Metals Rare Metals
① Concentrate W, Ree, Ni, Cr, Mn, Sr, Sb, Zr, Li, B, Ba, Cs
② By product of Copper & Zinc Smelting Co, Ge, Re, Ga, Se, Te, Bi, In, Tl, Hf
① + ② Mo, V, Nb, Ta, PGM, Ti, Be
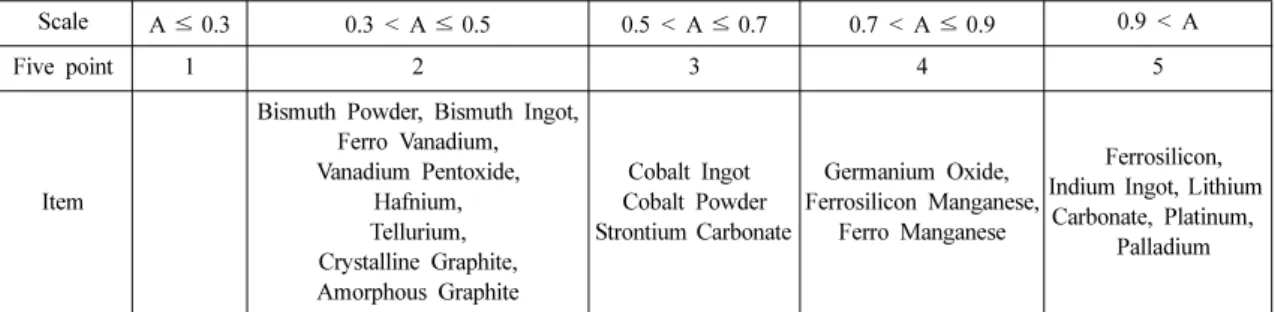
지수를 토대로 산정하였다9). 대체 가능성은 현 산업구 조에서 대체 가능 광종의 수가 적고 대체 효율이 낮을 수록 낮게 평가된다. 다음은 분석 대상 광종의 대체가 능지수를 나타낸다. 해당 방식은 전문가의 평가가 개입 된다.
3.2.3. 경제적중요성(Economic Importance)
경제적 중요성은 해당 광종이 국내 경제에서 차지하 는 중요도를 측정하는 지표이다. 경제적 중요성은 수입 규모(import volume), 국내 수요 확장성(domestic demand fluctuation), 수요산업의 적합성(suitability of demand industry)을 통합하여 산정한다. 다음 Table 6 은 경제적 중요성을 산정하는 평가항목 및 내용을 나타 낸다.
3.2.3.1. 수입규모(Import Volume)
특정 광물의 수입규모가 클수록 해당 광물이 경제에 서 차지하는 중요성은 증대된다. 희유금속의 경우, 수요 가 한정적이고 기술변화에 민감하게 반응한다. 즉, 수요 산업의 기술이 변화하였거나, 수요 업체가 해외로 이전
할 경우에는 수요 변동률이 상대적으로 높다. 이를 고 려치 않고 수입 중량만을 활용할 경우 수요구조가 왜곡 될 가능성이 높다. 따라서 본 연구에서는 이러한 시장 적 특성을 반영하기 위해 수입 중량과 수입 금액을 종 합하여 위험성을 평가하였다.
3.2.3.2. 국내 수요 확장성(Domestic Demand Fluctua- tion)
국내 수요 확장성은 광물의 수요 가능성을 평가하는 지표이다. 해당 지표는 수요자료를 이용하여 시장규모 가 축소되거나 확대되는 정도를 평가하며 연평균 성장 률(compound annual growth rate)을 통해 평가된다.
연평균 성장률이 높을 경우 해당 광물의 향후 경제적 중요성은 증가한다.
3.2.3.3. 수요산업의 적합성(Suitability of demand industry)
수요산업의 적합성은 비축의 대상이 되는 광종을 주 로 수요하는 기업의 유형과 산업의 규모를 종합적으로 고려하여 평가된다. 우선 기업의 유형은 수요기업을 대 Table 5. Substitutability index
Scale A≤ 0.3 0.3 < A≤ 0.5 0.5 < A≤ 0.7 0.7 < A≤ 0.9 0.9 < A
Five point 1 2 3 4 5
Item
Bismuth Powder, Bismuth Ingot, Ferro Vanadium, Vanadium Pentoxide,
Hafnium, Tellurium, Crystalline Graphite, Amorphous Graphite
Cobalt Ingot Cobalt Powder Strontium Carbonate
Germanium Oxide, Ferrosilicon Manganese,
Ferro Manganese
Ferrosilicon, Indium Ingot, Lithium Carbonate, Platinum,
Palladium
Table 6. Evaluation indicator for economic importance
Indicator Evaluation Index Explanation
Economic Importance
Import Volume
Amount of annual import (thousand dollar)
Measuring market size Annual import weight (tonne)
Domestic Demand
Fluctuation Domestic import increase rate (%) The extent to which the domestic market is enlarged or reduced
Suitability of Demand Industry
− Type of enterprise
− Economic importance of the demand
industry The economic impact of the industry type and demand industry on the domestic industrial
structure Ij =
∑
i --- × 100GDPGDPi기업과 중소기업으로 구분하였다. 대기업보다 중소기업 의 수요가 많을 경우 비축물자에 대한 중소기업 지원효
과가 증가하여 비축의 필요성이 증가하는 것으로 평가 하였다. 다음 Table 7은 기업 유형에 따른 평가척도를
Table 7. Rating scale for importance of industry Criterion Major Company
A≤ 70
Major Company 70 < A
Small Company A≤ 50
Small Company 50 < A≤ 70
Small Company 70 < A
Five point scale 1 2 3 4 5
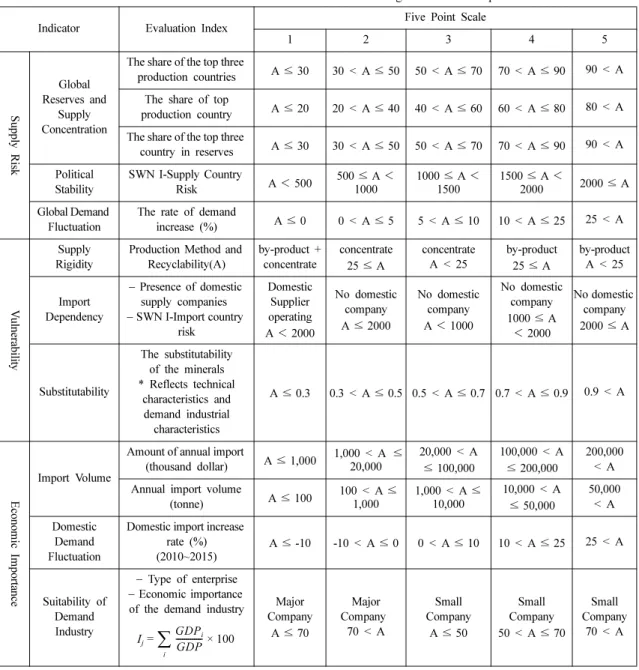
Table 8. Evaluation indicators and scales for selecting rare metal stockpiles
Indicator Evaluation Index Five Point Scale
1 2 3 4 5
Supply Risk
Global Reserves and
Supply Concentration
The share of the top three
production countries A≤ 30 30 < A≤ 50 50 < A ≤ 70 70 < A≤ 90 90 < A The share of top
production country A≤ 20 20 < A≤ 40 40 < A ≤ 60 60 < A≤ 80 80 < A The share of the top three
country in reserves A≤ 30 30 < A≤ 50 50 < A ≤ 70 70 < A≤ 90 90 < A Political
Stability
SWN I-Supply Country
Risk A< 500 500≤ A <
1000
1000≤ A < 1500
1500≤ A <
2000 2000≤ A Global Demand
Fluctuation
The rate of demand
increase (%) A≤ 0 0 < A≤ 5 5 < A≤ 10 10 < A≤ 25 25 < A
Vulnerability
Supply Rigidity
Production Method and Recyclability(A)
by-product + concentrate
concentrate 25≤ A
concentrate A < 25
by-product 25≤ A
by-product A < 25
Import Dependency
− Presence of domestic supply companies
− SWN I-Import country risk
Domestic Supplier operating A< 2000
No domestic company A≤ 2000
No domestic company A< 1000
No domestic company 1000≤ A
< 2000
No domestic company 2000≤ A
Substitutability
The substitutability of the minerals
* Reflects technical characteristics and demand industrial
characteristics
A≤ 0.3 0.3 < A≤ 0.5 0.5 < A ≤ 0.7 0.7 < A ≤ 0.9 0.9 < A
Economic Importance
Import Volume
Amount of annual import
(thousand dollar) A≤ 1,000 1,000 < A ≤ 20,000
20,000 < A
≤ 100,000
100,000 < A
≤ 200,000
200,000
< A Annual import volume
(tonne) A≤ 100 100 < A≤ 1,000
1,000 < A≤ 10,000
10,000 < A
≤ 50,000
50,000
< A Domestic
Demand Fluctuation
Domestic import increase rate (%) (2010~2015)
A≤ -10 -10 < A≤ 0 0 < A≤ 10 10 < A≤ 25 25 < A
Suitability of Demand Industry
− Type of enterprise
− Economic importance
of the demand industry Major Company
A≤ 70
Major Company
70 < A
Small Company
A≤ 50
Small Company 50 < A≤ 70
Small Company
70 < A Ij =
∑
i GDP--- × 100GDPi나타낸다. 아래 Table에서 A는 산업의 중요도(importance of industry)를 나타낸다.
다음은 산업의 규모 즉, 산업의 중요도에 대한 고려 이다. 산업의 중요도는 아래 식과 같이 전체 제조업 GDP대비 광물 i가 투입되는 산업의 GDP 비중을 통해 산정된다. 다음은 수요산업의 중요도의 산정식을 나타 낸다.
Importance of Idustry(A) =
i : 수요산업, j : 광종, GDP : 제조업 GDP, GDP : 해당산업의 GDP
3.2.4. 종합 지표 구성
다음 Table 8은 희소 금속 비축적정성 평가 체계를
위해 본 장에서 논의한 지표와 지표의 평가 기준을 나 타낸다. 아래 Table 8과 같이 해당 평가체계는 총 9개 의 지표로 구성되며 각 지표는 5점 척도로 구성된다.
∑
i GDP--- × 100GDPiFig. 4. Criticality matrix for critical material selection.
Table 9. Results of supply risk assessment Supply Concentration
Political Stability
Global Demand Fluctuation
Overall Overall Risk
The share of the top three production country
The share of top production
country
The share of the top three country
in reserves
Bismuth Powder 3.3 3 3 4 3 3 3.1
Bismuth Ingot 3.3 3 3 4 3 3 3.1
Cobalt Ingot 3.3 3 3 4 5 3 3.7
Cobalt Powder 3.3 3 3 4 5 3 3.7
Germanium Oxide 4.0 4 4 - 4 3 3.7
Platinum 4.7 5 4 5 4 1 3.4
Ferrosilicon 4.0 4 4 0 4 2 3.4
Ferro Vanadium 4.3 5 3 5 4 3 3.8
4.3 5 3 5 4 3 3.8
Vanadium Pentoxide
3.3 4 2 4 3 2 2.8
Hafnium
3.5 4 3 - 4 2 3.2
Indium Ingot
4.0 4 3 5 3 2 3.1
Lithium Carbonate
2.7 3 2 3 3 3 2.9
Ferrosilicon Manganese
2.7 3 2 3 3 3 2.9
Ferro Manganese
3.7 4 2 5 3 2 3.0
Palladium
2.0 - - 2 3 1 2.0
Tellurium
4.3 4 4 5 4 3 3.8
Crystalline Graphite
4.3 4 4 5 4 3 3.8
Amorphous Graphite
4.0 5 3 - 4 1 3.1
Strontium Carbonate
3.3. 희유금속 비축 적정성 평가를 위한 위험상태 행렬
품목별 비축 적정성은 다음의 과정을 통해 도출된다.
우선 지표를 통해 산정된 공급 위험과 취약성 각각의 값을 기하평균 하여 위험(R)로 정의한다. 다음 위험(R) 과 국내 경제적 중요성(I)을 “위험상태 행렬”화 하여 비 축 적정성을 평가한다. 비축이 적정하다고 판단하는 기 준은 위험(R)과 경제적 중요성(I)을 곱한 수치가 9이상 인 영역으로 설정하였다. 해당 영역은 아래 Fig. 4의 회색 부분에 해당한다. 이 영역에 속한 희유금속은 우 선적으로 비축이 필요한 희유금속으로 평가할 수 있다.
영역에 속하지 않아도 원점과의 거리가 먼 희유금속일 수록 높은 위험 수준을 보이는 것으로 평가할 수 있다.
4. 희유금속 비축 적정성 평가 결과
본 장에서는 비축대상이 되는 희유금속의 비축 적정 성을 3장에서 설정한 모형을 통해 측정하였다.
4.1. 글로벌 위험 평가 결과
다음 Table 9는 공급 위험 평가결과를 나타낸다. 평 가결과 코발트, 게르마늄, 바나듐, 흑연 등의 위험이 높 게 평가되었다.
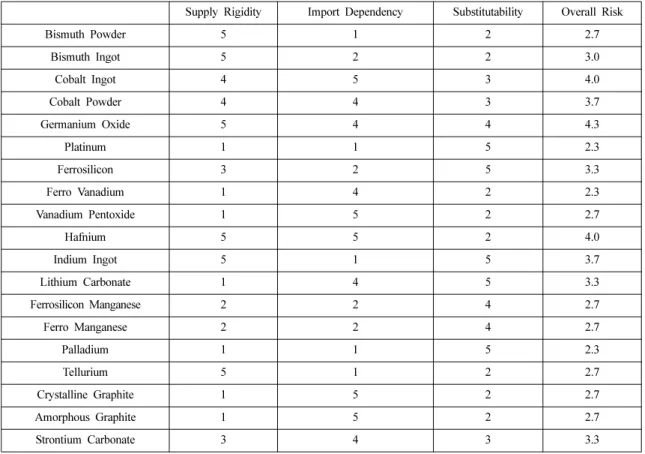
4.2. 취약성 평가결과
Table 10은 취약성 평가결과를 나타낸다. 평가결과 코 발트 괴, 코발트 분, 산화게르마늄, 인듐, 하프늄, 텔루 르 등의 취약성이 높게 평가되었다.
4.3. 경제적 중요성 평가결과
Table 11은 경제적 중요성 평가결과를 나타낸다. 평 가결과 탄산리튬, 페로실리콘, 오산화바나듐 등의 경제 적 중요성이 높게 평가되었다.
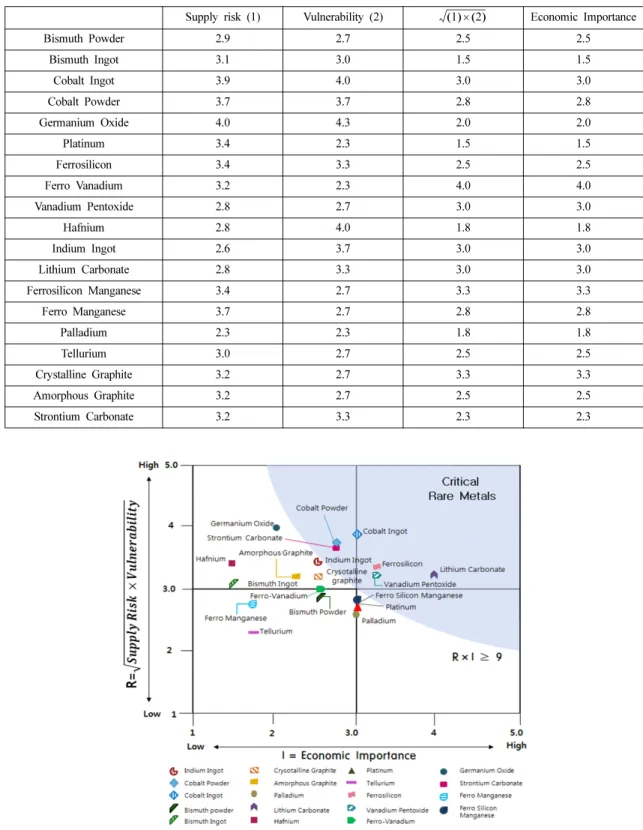
4.4. 종합결과
다음 Table 12는 5점 척도 지표를 토대로 산출된 위 험상태 평가 결과를 나타낸다. 이를 위험상태 행렬 체
Table 10. Results of vulnerability assessment
Supply Rigidity Import Dependency Substitutability Overall Risk
Bismuth Powder 5 1 2 2.7
Bismuth Ingot 5 2 2 3.0
Cobalt Ingot 4 5 3 4.0
Cobalt Powder 4 4 3 3.7
Germanium Oxide 5 4 4 4.3
Platinum 1 1 5 2.3
Ferrosilicon 3 2 5 3.3
Ferro Vanadium 1 4 2 2.3
Vanadium Pentoxide 1 5 2 2.7
Hafnium 5 5 2 4.0
Indium Ingot 5 1 5 3.7
Lithium Carbonate 1 4 5 3.3
Ferrosilicon Manganese 2 2 4 2.7
Ferro Manganese 2 2 4 2.7
Palladium 1 1 5 2.3
Tellurium 5 1 2 2.7
Crystalline Graphite 1 5 2 2.7
Amorphous Graphite 1 5 2 2.7
Strontium Carbonate 3 4 3 3.3
계 안에 도시하면 아래 Fig. 5와 같은 평가 결과가 나 타난다.
Fig. 5와 같은 위험도평가 행렬을 이용한 평가 결과 코발트 분, 코발트 괴, 페로실리콘, 탄산리튬, 탄산스트 론튬, 오산화바나듐이 우선적으로 비축되어야 할 품목 으로 나타났다. 이 외에도 상대적으로 비축 중요도는 낮 지만 인듐 괴, 백금, 페로실리콘망간, 팔라듐, 인상흑연, 산회게르마늄 등은 설정한 위험상태(criticality) 영역 근 처에 위치하여 우선 비축대상에서는 제외하였다. 그러 나 이들의 경우 지표 값 중 일부만 변동되어도 비축우 선광종으로 재분류 될 수 있다.
5. 결 론
본 연구에서 개발한 희유금속 비축적정성 평가 체계 를 활용할 경우 희유금속의 비축 우선순위와 적정성을 정량적으로 평가할 수 있다. 분석결과 이차전지의 재료
가 되는 코발트 분, 코발트 괴, 탄산리튬, 탄산스트론튬, 오산화바나듐코발트와 규소강 제조 등에 공급되는 페로 실리콘이 우선적으로 비축되어야 하는 품목임을 확인하 였다. 이 외에도 인듐 괴, 백금, 팔라듐의 위험성이 높 게 평가되어 전체적으로 신산업에서 수요가 증가하는 품목에 대한 우선 비축이 시행되어야 함을 파악할 수 있다.
본 연구의 분석체계는 분석 주체에 따라 지표 구성 등을 유연하게 변경할 수 있으므로 다음과 같은 활용 가능성과 파급효과를 기대할 수 있다.
① 모형을 통해 각 비축 대상 광종의 상대적 위험도 를 정량적으로 측정할 수 있기 때문에 비축의 우선순위 도출, 취약 부문의 파악이 보다 용이해질 것으로 기대 된다.
② 해당 평가결과는 향후 비축기본계획, 해외자원개 발기본계획, 해저광물자원개발기본개획 등 정책 수립의 기초자료로 활용 가능하다.
Table 11. Results of economic importance assessment Import Volume Domestic Demand
Fluctuation
Importance
of Industry Overall Risk Amount Weight
Bismuth Powder 2 2 3 3 2.5
Bismuth Ingot 1 1 1 3 1.5
Cobalt Ingot 2 2 4 4 3.0
Cobalt Powder 3 2 2 4 2.8
Germanium Oxide 2 1 2 3 2.0
Platinum 1 1 1 3 1.5
Ferrosilicon 3 2 3 2 2.5
Ferro Vanadium 3 4 4 5 4.0
Vanadium Pentoxide 3 5 3 1 3.0
Hafnium 2 3 1 1 1.8
Indium Ingot 5 1 2 4 3.0
Lithium Carbonate 4 1 3 4 3.0
Ferrosilicon Manganese 5 5 2 1 3.3
Ferro Manganese 1 1 2 3 1.8
Palladium 3 3 3 1 2.5
Tellurium 3 3 3 4 3.3
Crystalline Graphite 2 4 2 3 2.8
Amorphous Graphite 2 4 1 3 2.5
Strontium Carbonate 2 3 1 3 2.3
Table 12. Results of overall risk assessment
Supply risk (1) Vulnerability (2) Economic Importance
Bismuth Powder 2.9 2.7 2.5 2.5
Bismuth Ingot 3.1 3.0 1.5 1.5
Cobalt Ingot 3.9 4.0 3.0 3.0
Cobalt Powder 3.7 3.7 2.8 2.8
Germanium Oxide 4.0 4.3 2.0 2.0
Platinum 3.4 2.3 1.5 1.5
Ferrosilicon 3.4 3.3 2.5 2.5
Ferro Vanadium 3.2 2.3 4.0 4.0
Vanadium Pentoxide 2.8 2.7 3.0 3.0
Hafnium 2.8 4.0 1.8 1.8
Indium Ingot 2.6 3.7 3.0 3.0
Lithium Carbonate 2.8 3.3 3.0 3.0
Ferrosilicon Manganese 3.4 2.7 3.3 3.3
Ferro Manganese 3.7 2.7 2.8 2.8
Palladium 2.3 2.3 1.8 1.8
Tellurium 3.0 2.7 2.5 2.5
Crystalline Graphite 3.2 2.7 3.3 3.3
Amorphous Graphite 3.2 2.7 2.5 2.5
Strontium Carbonate 3.2 3.3 2.3 2.3
( ) 21 ×( )
Fig. 5. Results of critical rare metals assessment using criticality matrix.
③ 분석 대상을 특정 산업으로 제한함으로써 특정 산 업 또는 기업에서 사용되는 비축 물자의 우선순위와 안 보수준을 정량적으로 평가할 수 있다. 이는 본 연구결 과가 산업 또는 기업의 의사결정 과정에서 활용될 수 있음을 시사한다.
감사의 글
본 연구는 산업통상자원부(MOTIE) 자원개발사업
“국내 비금속광산에 대한 국제적인 매장량 평가기준 개 발과 이를 이용한 경제성 평가 표준화 기법 개발(17- 4803)”과 산업통상자원부(MOTIE)의 재원으로 한국에 너지기술평가원(KETEP)에서 지원한 연구과제(No.
20165020101200)의 지원으로 수행되었습니다.
References
1. Kim, Y. J. and Kim, D. H., 2012 : Development of target management indicators for national resource security, Journal of the Korean Society for Geosystem Engineering, 49(1), pp.59-67.
2. KIGAM, 2015 : Mineral commodity supply and demand,
Korea Institute of Geoscience and Mineral Resources, Daejeon, Korea.
3. Stockpilie of Korea Resources Corporation, https://
www.kores.or.kr/views/cms/hkor/bi/bi04/bi0402.jsp, (connected date : 2017.11.24.).
4. NRC, 2008 : Minerals, Critical Minerals, and the U.S.
Economy, US National Research Council, Washington DC., USA.
5. Glöser, S., et al., 2015 : Raw material criticality in the context of classical risk assessment, Resources Policy, 44, pp.35-46.
6. Kim, J. H., et al., 2016 : Development of the Evaluation System for Mineral Resources Security, J of the Korean Society of Mineral and Energy Resources Engineers, 53(3), pp.246-262.
7. Hafner, M., 2008 : A Quantification of the Diversification of European Coal Supplies, SECURE-Security of Energy Considering its Uncertainty, Risk and Economic Implications, Brussels, Belgium.
8. Graedel, T. E., et al. 2011 : Recycling Rates of Metals-A Status Report, A Report of the Working Group on the Global Metal Flows to the International Resource Panel, United Nations Environment Programme. Nairobi, Kenya.
9. EC, 2017 : Study on The Review of The List of Critical Raw Materials, European Commission, Brussels, Belgium.
김 유 정
• 2000년 서울대학교 지구환경시스템공학부 공학사
• 2002년 서울대학교 지구환경시스템공학부 공학석사
• 2008년 서울대학교 지구환경시스템공학부 공학박사
• 현재 한국지질자원연구원 자원전략연구실 실장
김 대 형
• 1983년 2월 인하대학교 공과대학 자원공학과 공학사
• 1990년 2월 인하대학교 대학원 자원공학과 공학석사
• 1998년 4월 러시아 국립자원경제연구원 경제학 박사
• 현재 한국지질자원연구원 자원전략연구실 책임연구원
김 진 수
• 2003년 서울대학교 지구환경시스템공학부 공학사
• 2005년 서울대학교 지구환경시스템공학부 공학석사
• 2010년 서울대학교 지구환경시스템공학부 공학박사
• 현재 한양대학교 자원환경공학과 부교수
김 주 한
• 2013년 한양대학교 자원환경공학과 공학사
• 2016년 한양대학교 자원환경공학과 박사수료
• 현재 한양대학교 자원환경공학과 박사과정