Abstract
Purpose – The purpose of this research is to provide insights that can be used for deliberate decision making around chal- lenging big data investments by measuring the economic value of such big data implementations.
Research design, data, and methodology – We perform em- pirical research through an event study. To this end, we meas- ure actual abnormal returns of companies that are triggered by their investment announcements in big data, or firm size in- formation, during the three-year research period. The research period targets a timeframe after the introduction of big data at Korean firms listed on the Korea stock markets.
Results – Our empirical findings discover that on the event day and the day after, the abnormal returns are significantly positive. In addition, our further examination of firm size impacts on the abnormal returns does not show any evidence of an effect.
Conclusions – Our research suggests that an event study can be useful as an alternative means to measure the return on in- vestment (ROI) for big data in order to lessen the difficulties or decision making around big data investments.
Keywords: Big Data, Event Study, Return on Investment (ROI).
JEL Classifications: C82, G14.
1. Introduction
"Big Data" means structured or unstructured data with high volume, high velocity, and high variety, where high volume means the need for scalable models, high velocity implies open
* This work was supported by research fund of 2014 Chungnam National University.
** First Author. Assistant Professor of Marketing, Ph.D. College of Business Administration, Myongji University, Seoul, Korea, E-mail:
*** Corresponding Author, Assistant Professor of Marketing, Ph.D.
College of Economics and Management, Chungnam National Universtity, Daejeon, Korea, E-mail: [email protected]
opportunities for (virtually) real-time decision making, and high variety represents various research methods requiring integration approaches (Marketing Science Institute, 2013). Big data is gen- erated from various sources including Internet click streams, mo- bile transactions, user-generated contents (UGC), and so on (George, Martine, and Pentland, 2014). With the advent of these various sources, big data has quickly become a popular way of management revolution. As big data allows for more precise measures, better predictions, and smarter decisions(McAfee &
Brynjolfsson, 2012), the big data can be widely utilized for im- provements in various management areas, including marketing, finance, logistics, distribution, security, research and development (R&D), etc.
In spite of the advantages of big data in the whole manage- ment areas including scientific distribution systems, investments in big data is not easy decisions for the company. One of the obstacles to the big data investment is that measuring the re- turn on investment (ROI) is not aneasy task. As Webster (1981) indicates, marketing managers have a tendency to concentrate on marketing figures such as sales volume and market share objectives rather than financial measures such as profitability and ROI. Due to the difficulty of translating the efficiency of marketing to the financial measure, managers have concerns about the potential return of investing big data. According to McAfee and Brynjolfsson (2014), there exist two sceptical ques- tions for big data implementation for managers"What’s new com- pared to the current analytics?" and "Where’s the evidence of improving business performance?" Providing satisfactory answers to these questions are also challenges to managers making in- vestment decisions on big data.
In an effort to provide insights for deliberate decision making of the challenging big data investments, this study aims to measure the economic value of big data implementation by em- ploying the event study methodology. Specifically, we analyse the impacts of the event of big data investments on the stock price of the firm, within the event window. In case we find the existence of abnormal return of the stock triggered by the event, we can additionally investigate whether the size of the firm influ- ences the abnormal return. This research would help managers to understand better their investors’expectation about the big da- ta investments and their evaluation of the company’s capability in terms of size, which would optimize their investment decisions.
Print ISSN: 1738-3110 / Online ISSN 2093-7717 http://dx.doi.org/10.15722/jds.13.9.201509.5
The Impact of Big Data Investment on Firm Value*
1)
Ji-Hong Min**, Jung-Ho Bae***
Received: August 23, 2015. Revised: September 2, 2015. Accepted: September 15, 2015.
In what follows, we briefly discuss the related literatures and construct our hypotheses. Next, we describe our data, specify the event study model, and demonstrate our empirical findings.
Finally, we conclude with discussions of the managerial im- plications, limitations, and future research suggestions.
2. Literatures and Hypotheses
2.1. Event Study Methodology & Big DataAs mentioned above, the purpose of this study is to examine the effects of investing big data on the market value of the firm.
There exist various measures related to the market value of a firm, such as future cash flow of a firm (Gruca & Rego, 2005), Tobin’sq(Anderson et al. 2004; Tobin 1969), Economic Value Added (EVA) (Yi and Lee, 2006), the rate of change in stock value of the firm (Aksoy et al., 2008; Fornell et al., 2006;
Jacobson & Mizik, 2009), etc. This research selects the ap- proach of the rate of change in stock value of the firm as the measure in our event study.
The event study methodology is the approach used to exam- ine the effect of a specific event on the market value of a firm.
The event study, widely used in finance literature, is based on the efficient market hypothesis (EMH), assuming that econom- ically valuable information is instantly reflected on the stock price when the information is revealed (Fama et al., 1969).
Under the EMH, if a specific event contains an economic value to change the future cash flows of a firm and the market is effi- cient, the revelation of the information about the specific event would trigger the related transactions of stocks. Therefore, we can determine the influence of the specific event on the stock price based on whether the stock price of the related company shows abnormal returns or not.
In the marketing literature, the event study has been also widely used to measure the change of market value of firms re- lated to marketing events. For instance, there exist a streamline of marketing researches utilizing the event study methodology to investigate the influence of change of a company name on the market value of the company (Horsky & Swyngedouw, 1987), the effects of new product introductions on the firm’s market value (Chaney et al., 1991), the economic worth of celebrity en- dorsers on the firm value (Agrawal & Kamakura, 1995), the ef- fect of brand attitude and familiarity on the stock market re- actions (Lane & Jacobson, 1995), and the effect of negative consumer voices on the stock returns (Luo, 2007), etc.
While there exist myriads of academic researches utilizing the event study, there is little academic documentation on the big data analytics, due to the relatively short period of the business practice. In order to improve the practice of marketing under the data-rich environment, marketing researchers are encouraged to address the topic of big data (Marketing Science Institute, 2013). A few researches on the big data in academic literature address various marketing topics such as big data analysis of digital loyalty card in small business marketing (Donnelly et al.,
2013), brand analysis of big data utilizing latent Dirichlet alloca- tion (Tirunillai & Tellis, 2014), and precision marketing of e-com- merce utilizing big data(Zhang & Zhu, 2014), etc. While these topics of big data are insightful for marketing analytics, the eco- nomic value of the big data for companies - a major concern for managers deliberating on investment decision of big data - has not been addressed in the academic literature. In order to providing managers insights about the economic value of the big data investments, we construct hypotheses such as follows.
2.2. Constructing Hypotheses
There exist a similarity between customer relationship man- agement (CRM) and big data analytics, in that both of these business solutions are introduced in management processes to improve management efficiency based on data-driven analytics.
In the case of CRM, it is applied widely even if the size of busi- ness is very small(Kim, 2010). As previous researches (Kim et al., 2004 Ahn et al., 2003) find the existence of positive effects of investments with economic value on the market value of a firm, we can reasonably expect that big data investment would also positively affect the market value of the firm, assuming that stock investors appreciate the management improvements, by da- ta-driven analytics. This assertion implies the existence of pos- itive abnormal return within the event window in our event study.
Therefore, we construct our 1st hypothesis such as;
<Hypothesis 1> The event of big data investment leads to positive abnormal return.
In case the abnormal return at the event day exists, we can examine further whether the size of the company affects the ab- normal return or not. If stock investors evaluate the capability of performing successful big data implementation by merely the size of the firm, it might influence the expectation of investors about the future cash flows of the investing company, thereby significantly affecting the abnormal returns. If stock investors un- dervalue (or overvalue) future cash flows from the big data im- plementation of the small (or large) company, this assertion would be plausible. Thus, we construct our next hypothesis as following;
<Hypothesis 2> The size of the firm influences on the abnor- mal return at the event day.
3. Empirical Research
3.1. Event Study AnalysisIn order to measure the above mentioned change of the firm value triggered by the event of big data investment, we esti- mate the normal rate of returns by following the approach of Brown and Warner (1985), such as;
(1)
(2)
(3)
where is the stock return of firm on day , is the stock price of firm on day , is the stock return of mar- ket portfolio on day , is the stock market price index on day , and are the related coefficients, and is the er- ror term assumed to be independently and identically distributed (i.i.d.) following . Here, , , and stand for the estimates of , , and , respectively. The actual rate of re- turn, , and the market portfolio rate of return, , are measured by Equation 1. As the relevant stock market price in- dex in this research, we utilize "Korea composite stock price in- dex"(KOSPI) for firms enlisted in Korea Stock Exchange (KSE) market, and "Korea securities dealers’ automated quotation"
(KOSDAQ) index for firms enlisted in KOSDAQ market. Then, we regress on in Equation 2, in order to derive in Equation 3 by calculating estimates of Equation 2. We regard
as the normal rate of return of firm on day . Abnormal rate of return is derived as following.
(4)
In order to estimate the related parameters to calculate , we utilize stock price data observations during the period from 260 to 10 business days before the events. In order to mini- mize possible impacts of the event on the estimates, we ex- clude observations from 9 to 1 business days before events, consistent with Kim et al. (2004). In addition, we set the event window, the period during which the impacts of events possibly exist, from 5 business days before event date to 5 business days after the event date. The subscript stands for the elapsed days starting from the event day, which means on the event day, and and , on a day before and after the event date, respectively. Thus, we can express
∈ ⋯ for Equation 1 and 2, and ∈ ⋯
for Equation 3 and 4.
In order to examine whether the overall abnormal return in each day within the event window ∈ ⋯ is sig- nificantly different from zero, we calculate average abnormal re- turns (AAR) and T-statistics (TS) such as follows;
, for ∈ ⋯ (5)
, for ∈ ⋯ (6)
where represents the number of observations. In addition, we calculate cumulative average abnormal returns (CAAR) to see the cumulative effects from the beginning of the event win- dow to the specified day , derived by;
∑ , for ∈ ⋯ (7)
3.2. Data Description - Big Data Investments in Korean Firms
Since the business solutions of big data were initially in- troduced in Korea in 2011, the number of firms investing big data has been continuously increasing. Table 1 demonstrates the annual number of Korean firms investing big data, appeared in news articles we collected in our research period, from July 2011 to June 2014. The articles including the word "Big data"
were gathered and the authors used the events related with the corporate business performances. As we can see in Table 1, the number of big data investments performed by Korean firms are rapidly increasing, which shows a very steep upward trend.
In our research, we define the event day as the day when the information related to the firm’s big data investments is announced. We derive events by searching news articles related to big data investments performed by Korean firms, from a search engine in Korea. When there exist multiple investment events for a firm, we treat each case as a different event for a separate firm.
In order to rigorously measure the abnormal return triggered by the big data investment, we exclude observations based on the following criteria. First, we exclude observations if the com- pany's stock price data matching our specified estimation period (∈ ⋯ ) is not available, in order to maintain the same estimation period across various firms and events.
Second, we also exclude observations when the beta estimates derived from the estimation period (∈ ⋯ ) are not significant, as we cannot derive the normal return by assuming the linearity between normal return and market return. Lastly, we exclude observations when a major event other than big da- ta investment happens during the event window (∈ ⋯ ), to secure that our observation is mainly af- fected by our specified event, big data investment.
<Table 1> Annual Numbers of Korean Firms Investing Big Data
Year Number of Firms
the 2nd Half, 2011 1
2012 10
2013 28
the 1st Half, 2014 45
<Table 2> Industries of Investments for Big Data
Industries Telecom Electronics Finance Service Transportation Information Technology Others Number of
Observations 30 13 12 9 5 4 11
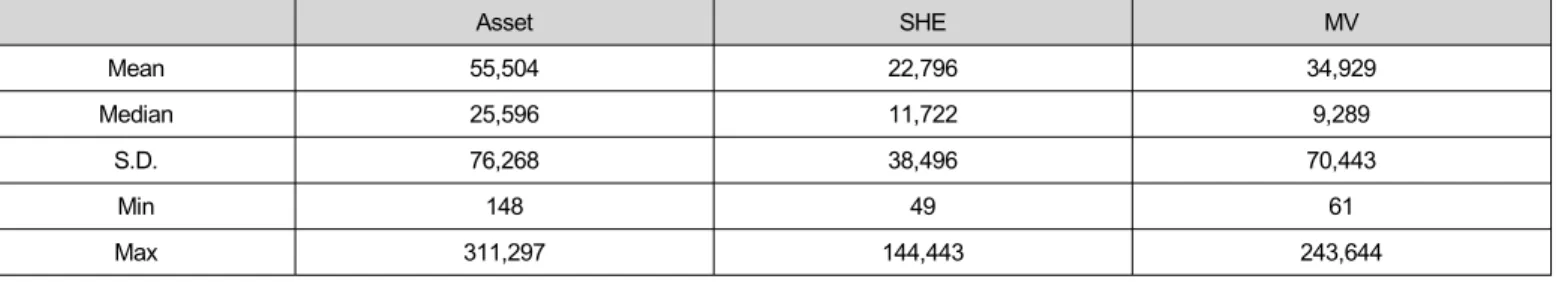
<Table 3> Descriptive Statistics for Firms Investing Big Data (Unit: billion KRW)
Asset SHE MV
Mean 55,504 22,796 34,929
Median 25,596 11,722 9,289
S.D. 76,268 38,496 70,443
Min 148 49 61
Max 311,297 144,443 243,644
Notes: 1. Number of observations is 84.
2. Asset and Stock Holders’ Equity are based on Financial Statements, and Market Value is based on FnGuide at the end of prior year of each event.
3. According to exchange rate as of Jan, 2015, 1 billion KRW is approximately 0.9 million USD.
There exist various industries of firms investing big data.
Table 2 shows the distribution of the big data investments be- longing to various industries. We observe that companies in tel- ecom industry are investing big data aggressively, followed by electronics and finance industries. There exist also various types of big data investment, such as incorporating big data systems, establishing big data analysis departments, launching new mar- keting campaigns based on big data analysis, new product de- velopments based on big data application, and developing new logistic systems utilizing big data, etc. Table 3 shows the de- scriptive statistics for the firms investigated in our research, in terms of various size measures such as asset, shareholder’s equity (SHE), and market value (MV) of firms. In Table 3, we can find the gaps between the minimum size and maximum size of companies are enormous. In addition, the company sizes are sparsely distributed, which show standard deviations larger than means or medians of size measures.
3.3. Empirical Findings of the Event Study
Generally, the change of stock price triggered by the event happens on the event day or within a few days since the event, depending on the efficiency of the stock market (Bond and Cummins 2000; Danniel and Titman 2006). Table 4demonstrates average abnormal returns (AAR), T-statistics (TS), and cumulative average abnormal returns (CAAR). As we can see in Table 4, and are significantly positive, which support our Hypothesis 1. While fluctuates between neg- ative and positive signs across date , the -statistics are not significant except for =0 and =+1. From this observation, we can infer that the event affects significantly only on the date and a day after the event date, neither prior to the event date, nor two or more days after the event date. We can interpret this result as stock investors have a tendency to expect positive
incremental future cash flows from the big data investment of the company, and this positive expectation is reflected on the abnormal return on the stock price of the company.
<Table 4> Average Abnormal Returns (AAR), T-Statistics (TS), and Cumulative Average Abnormal Returns (CAAR)
AAR TS CAAR
-5 0.0018 0.756 0.0018
-4 0.0002 0.066 0.0019
-3 - 0.0006 - 0.272 0.0013
-2 0.0014 0.613 0.0027
-1 - 0.0020 - 0.862 0.0007
0 0.0047 2.024** 0.0054
1 0.0045 1.916* 0.0099
2 - 0.0031 - 1.323 0.0068
3 0.0018 0.780 0.0086
4 - 0.0015 - 0.645 0.0071
5 - 0.0006 - 0.253 0.0065
Note: *, **- significant at the 10% and 5% level, respectively.
Figure 1.1 and 1.2 shows the histogram of abnormal returns on the event day (=0) and a day after the event day (=+1), respectively. As we can see the shape, both of distributions of Figure 1.1 and 1.2 are right-skewed, which demonstrate positive skewness of 0.933 and 3.318, respectively. This long-tail shape of abnormal return skewed to the right implies that there exist some companies which investors have strongly positive expect- ations for their big data investments.
<Figure 1.1> Histogram of (Abnormal Returns on the event day; =0)
<Figure 1.2> Histogram of (Abnormal Returns on a day after the event day; =+1)
<Figure 2> Trend of Cumulative Average Abnormal Returns () Table 4 also demonstrates that is always positive within the event window, which means cumulative increase of average market value of firms during the event window. Figure 2 depicts this increasing trend of market value more intuitively, showing dramatic increase on =0 and =+1, with fluctuating states on other days. Based on the at the end of event window (=+5), we can infer that the market value of firms, triggered by big data investment events, is increased by
0.65%. If we assume all the impacts of big data investment on the market value of firms are reflected within the event window, the 0.65% increase implies approximately 227 billion KRW in- crease of average market value of firms. Following Table 4, this figure is calculated based on the mean value of market value of the firms (34,929 billion KRW). If we use median value (9,289billion KRW) instead, the 0.65% increase implies 60billion KRW.
3.4. The Influence of Firm Size on the Abnormal Return As a further step of our event study, we examine the influ- ence of firm size on the abnormal return. Specifically, we re- gress the abnormal returns at the event days on asset, SHE, and MV of firms, separately, in order to avoid possible multi- collinearity problems. Model specification is such as;
∙ (8)
where is a measure for the size of the company, and
, are related parameters. Table 5 demonstrates the empirical results under various size measures including asset, SHE, and MV. As we can see in Table 5, for all the size measures, the intercept coefficients, , are significantly positive, but the co- efficients for size variables, , are not significantly different from zero. Therefore, our hypothesis 2 is not supported.
<Table 5> The Influence of Firm Size on the Abnormal Return at Event Day
measureSIZE
Asset (Unit: thousand
KRW)
(Unit: thousandSHE KRW)
(Unit: millionMV KRW)
Coefficient
Mean(s.d.) 0.004*
(0.002) 0.000
(0.000) 0.005**
(0.002) 0.000
(0.000) 0.005**
(0.002) 0.000 (0.000)
t-value 1.97 0.21 2.52 -0.57 2.61 -0.65
p-value 0.05 0.84 0.01 0.57 0.01 0.52
Note: *,**- significant at the 10% and 5% level, respectively.
This result suggests that stock investors evaluate the future cash flows from big data investments not only by the size of the company, but also by other various information sources – for example, the infrastructure of data management process, hu- man resources in data analytic departments, and the intention of chief executive officer (CEO) to incorporate the big data sys- tems, etc. Therefore, managers of small-sized company consid- ering big data investments need not worry about being under- valued just because of the small size. Rather, the result sug- gests that investors evaluate the capability of performing suc- cessful big data investments with overview of total infra-
structures, composed of hardware, software, and human re- sources related to the big data implementations.
4. Conclusion
There exist difficulties in measuring the sales or profitability improved by the investment of big data, which lowers the pre- dictability for ROI of big data in the real economy. Aside from the actual performance of big data implementation in the real economy, this study suggests managers to consider the ROI of big data measured in the financial economy. As the investors’
expectations about the performance of big data are reflected on the stock market, the change of stock market value related to the announcement of big data investment provides useful in- formation for managers considering big data investments.
Managers in charge of consumer data analysis can also gain the investment from the decision makers in the company, who have doubt about new technique. Moreover, enhancing the mar- ket value of the firm is the ultimate goal for managers and stockholders, which highlights the importance of this research.
By employing the event study methodologies, we measure the actual abnormal returns of companies triggered by the an- nouncement of investing big data during the 3 years research period since the introduction of big data in Korea. Our major empirical findings include such as follows. First, investors in Korea stock markets expect that big data investment would pos- itively affect future cash flows of the firms. Our empirical results demonstrate that the event of investing big data has the eco- nomic value of information for investors. Therefore, we suggest managers to consider the instant impacts of the big data invest- ment on the stock market, as well as the long term cash flows.
Second, our further investigation about the influence of the firm size on the abnormal return finds no evidence for the existence of the effect. This analysis implies that investors’ expectation about the successful implementation of big data does not mainly depend on the size of the company.
We discuss several limitations of this study and related sug- gestions for possible future research. First, the empirical results showed in this study might be different especially in stock mar- kets of other countries, where the characteristics of firms, invest- ors, and infrastructures of information technology (IT) are quite different from Korea. To overcome this limitation, researchers can cross-validate the impact of big data investment across vari- ous stock markets in different countries. Second, this research does not utilize the amount of investment due to the limited ac- cess to the information, which can be meaningful for making de- cisions of optimal investment level. If an additional source of in- formation is available, an analytical research for optimal level for the investment amount would be a good extension of this research. Third, given the relatively short research period since the introduction of big data in Korea, the exactness of stock in- vestors’ evaluation about the big data investment is not yet aca- demically confirmed. Therefore, we suggest investigation about the long term effects of the big data investment on the value of
the firm by applying another research methodology such as cal- endar portfolio method as a further research direction.
As Lohr (2014) argues, big data management means a sig- nificant shift in decision making, from experience and intuition to data and analysis. Without appropriate data analysis in the rele- vant business processes, big data investment alone does not guarantee successful management improvements. Ross et al.
(2013) indicates that most failures of companies investing big data are due to the lack of capabilities of analysing given data adequately or making relevant changes utilizing insights derived from the analysis. Therefore, we suggest managers not only to consider the figures of ROI, but also to equip companies with adequate capabilities of data analysis, in making decisions of in- vesting big data.
Acknowledgments
We have benefited from assistance of Jun-Hyuk Song, In-Young Lee, and Sang-Cheol Park in search and from com- ments of Yun-Kyung Oh.
References
Agrawal, Jagdish, & and Kamakura, Wagner (1995). The Economic Worth of Celebrity Endorsers: An Event Study Analysis.Journal of Marketing, 59(3), 56-62.
Aksoy, Lerzan, Cooil, Bruce, Groening, Christopher, Keiningham, Timothy L., & Yalcin, Atakan (2008). The Long-Term Stock Market Valuation of Customer Satisfaction. Journal of Marketing, 72(July), 105-122.
Allenby, Greg (2012). Keynote Speech at the Fall 2012 KMA Conference : Big Data 2.0. Asia Marketing Journal, 14(3), 1-5.
Anderson, Eugene W., Fornell, Claes, & Mazvancheryl, Sanal K.
(2004). Customer satisfaction and shareholder value.
Journal of Marketing, 68(4) 172-85.
An, Kwangho, Lim, Byoung-Hun, & Kim, Young-Gi (2003). The Empirical Study of the effect of Sports Sponsorship Marketing on the Value of Firm. Korean Management Review, 32(4), 1089-1102.
Bond, Stephen R., & Cummins, Jason G. (2000). The Stock Market and Investment in the New Economy: Some Tangible Facts and Intangible Fictions. Brookings Papers on Economic Activity, 1, 61-124.
Brown, Stephen J., & Warner, Jerold B. (1985). Using daily stock returns: The case of event studies. Journal of fi- nancial economics, 14(1), 3-31.
Chaney, Paul K., Devinney, Timothy M., & Winer, Russell S.
(1991). The Impact of New Product Introductions on the Market Value of Firms. Journal of Business, 65(5), 320-335.
Daniel, Kent, & Titman, Sheridan (2006). Market Reactions to Tangible and Intangible Information. The Journal of
Finance, 61(4), 1605-1643.
Donnelly, Christina, Simmons, Geoff, Armstrong, Gillian, &
Fearne, Andrew (2013). Digital loyalty card ‘big data’and small business marketing: Formal versus informal or complementary? International Small Business Journal, Retrieved Oct. 1, 2013. from doi: 10.1177/026624261350 2691: 0266242613502691.
Fama, Eugene F., Fisher, Lawrence, Jensen, Michael C., & Roll, Richard (1969). The Adjustment of Stock Prices to New Information. International Economic Review, 10(1), 1-21.
Fornell, Claes, Mithas, Sunil, Morgeson III, Forrest V., &
Krishnan, M.S. (2006). Customer satisfaction and stock prices: High returns, low risk. Journal of Marketing, 70(1) 3-14.
George, Gerard, Haas, Martine R., & Alex Pentland (2014).
From the Editors: Big Data and Management. Academy of Management Journal, 57(2), 321-26.
Gruca, Thomas S., & Rego, Lopo L. (2005). Customer sat- isfaction, cash flow, and shareholder value. Journal of Marketing, 69(3) 115-130.
Horsky, Dan, & Swyngedouw, Patrick (1987). Does it Pay to change your Company’s name? A Stock market Perspective. Marketing Science, 6(4), 320-335.
Jacobson, Robert, & Mizik, Natalie (2009). The financial markets and customer satisfaction: reexamining possible financial market mispricing of customer satisfaction. Marketing Science, 28(5) 810-9.
Kim, Byungdo, Kim, JiKyung, & Woo, Sangjin (2004). CRM Investment and the Value of the Firm. Korean Management Review, 33(4), 1185-99.
Kim, Gi-pyong (2010). A study on the CRM strategy for medium and small industry of distribution. Journal of Distribution Science, 8(3), 37-47
Lane, Vicki, & Jacobson, Robert (1995). Stock Market Reactions to Brand Extension Announcements: The Effect of Brand
Attitude and Familiarity. Journal of Marketing, 59(1), 63-77.
Luo, Xueming (2007). Consumer Negative Voices and Firm Idiosyncratic Stock Returns. Journal of Marketing, 71(July), 75-88.
Lohr, Steve (2014). Making Big Data Think Bigger. The New York Times, Retrieved Feb 1, 2015, from http://bits.blogs.
nytimes.com/2014/09/20/making-big-data-think-bigger/
Marketing Science Institute (2013). Call for Papers-Marketing Science Special Issue on Big Data: Integrating Marketing, Statistics, and Computer Science. Marketing Science, 32(4), 678.http://dx.doi.org/10.1287/mksc.2013.0794 McAfee, Andrew, & Brynjolfsson, Erik (2012). Big Data. manage-
ment revolution. Harvard Business Review, 90(10), 61-67.
Ross, Jeanne W., Beath. Cynthia M., & Quaadgras, Anne (2013). You May Not Need Big Data After All. Harvard Business Review, 91(12), 90-98.
Tirunillai, Seshadri, & Tellis, Gerard J. (2014). Mining Marketing Meaning from Online Chatter: Strategic Brand Analysis of Big Data Using Latent Dirichlet Allocation. Journal of Marketing Research, 51(4) 463-79.
Tobin, James (1969). A general equilibrium approach to mone- tary theory. Journal of money, credit and banking, 1(1), 15-29.
Webster Jr, Frederick E. (1981). Top Management's Concerns about Marketing: Issues for the 1980's. Journal of Marketing, 45(3). 9-16.
Yi, Youjae, & Lee, Cheonglim (2006). The Effects of Customer Satisfaction on Firm’s Profitability and Value. Journal of Korean Marketing Association, 21(2), 85-113.
Zhang, Jianhui, and Zhu, Junxuan (2014). Research Intelligent Precision Marketing of E-commerce Based on the Big Data. Journal of Management and Strategy 5(1) 33-38.