http://e-nrp.org
Dietary factors associated with high serum ferritin levels in postmenopausal women with the Fifth Korea National Health and Nutrition Examination Survey (KNHANES V), 2010-2012
Se Young Ju and Ae Wha Ha§
Department of Food Science and Nutrition, Natural Nutraceuticals Industrization Research Center, DanKook University, 152 Jukjeon-Ro, Suji-Gu, Yongin-Si, Gyeonggi 16890, Korea
BACKGROUND/OBJECTIVES: Serum ferritin levels are significantly increased after menopause and greatly affect women’s health.
The aim of this study was to investigate the dietary and non-dietary factors associated with high ferritin levels in postmenopausal women.
SUBJECTS/METHODS: Among adult women in 2010-2012, qualified postmenopausal women (n = 3880) were separated into quartiles of serum ferritin. The variable differences among the quartiles of ferritin were determined using either procsurvey chi-square test (χ2-test) among categorical variables, or GLM (Generalized Linear Model) among continuous variables. The odds ratio for high ferritin in relation to dietary factors was also determined using procsurvery logistic analysis.
RESULTS: Age, obesity, drinking habit, and blood glucose levels were found to be significant indicators of high serum ferritin level after adjusting for all confounding factors. Among the food groups, grain, milk, vegetable, and seaweed intakes were significantly associated with high ferritin levels, but after adjusting for all confounding factors, only grains and vegetables remained significant factors. Among the nutrient groups, calcium, vitamin A, and vitamin C intake were significant factors, but after adjustment, none of the nutrient groups analyzed were associated with a high risk of ferritin.
CONCLUSION: Age, obesity, drinking habit, and glucose levels, as well as inadequate intakes of grains and vegetables, were found to be significantly associated with high serum ferritin levels in postmenopausal Korean women.
Nutrition Research and Practice 2016;10(1):81-88; doi:10.4162/nrp.2016.10.1.81; pISSN 1976-1457 eISSN 2005-6168 Keywords: Menopause, ferritin, BMI, diet, vegetable
INTRODUCTION11)
Iron is stored in our body as a form of ferritin, and thus ferritin serves as a convenient and accurate indicator of iron status in humans [1]. It has been suggested that a high level of serum ferritin acts as a potent oxidant, increasing oxidative stress and leading to various diseases [2-4].
Studies have tried to identify factors, besides iron intake. That affect serum ferritin levels. The result of studies have shown that drinking, smoking, educational level, and regular exercise are possible factors associated with serum ferritin levels [5-7].
Dietary iron intake, such as the amount of iron intake and the type of iron consumed, is also one of the determinants of serum ferritin level [8].
There are two types of iron in food: heme and nonheme iron.
Heme iron, mainly found in animal based foods, has high bioavailability in the body while non-heme iron is obtained from grains, legumes, vegetables, or fruits and is considered to have low bioavailability [9]. Interestingly, recent studies have shown
that a plant-based diet was beneficial in reducing serum ferritin level in either diabetes or anemia patients with high ferritin [10,11]. A study reported that vegetarian females had lower metabolic syndrome incidence, which was related with lower serum ferritin level compared to non-vegetarians [12].
High ferritin level in postmenopausal women has been implicated in the pathogenesis of many diseases, such as cardiovascular diseases, diabetes, and metabolic syndrome [13-16]. Furthermore, although increased iron resulting from menopause may be considered within normal physiologic range, it may also lead to potential health problems [17]. If the associations between high ferritin and diseases are truly causal, monitoring factors associated with the high risk of serum ferritin in this population will have substantial implications for public health.
While several studies have assessed the relation between serum ferritin and various chronic diseases [12-16] or dietary influences in subjects at risk of anemia [18-20], limited study has focused on the relationship between dietary factors and
This study was conducted by the research fund of Dankook University (R201500482)
§Corresponding Author: Ae Wha Ha, Tel. 82-31-8005-3177, Fax. 82-31-8005-3170, Email. [email protected] Received: June 29, 2015, Revised: November 5, 2015, Accepted: November 9, 2015
This is an Open Access article distributed under the terms of the Creative Commons Attribution Non-Commercial License (http://creativecommons.org/licenses/by-nc/3.0/) which permits unrestricted non-commercial use, distribution, and reproduction in any medium, provided the original work is properly cited.
the high ferritin risk in postmenopausal women [21,22]. Therefore, the purpose of this study is to determine the association between serum ferritin levels and various factors including dietary intake in postmenopausal women by analyzing 3 years of KNHANES data (2010-2012).
SUBJECTS AND METHODS Study population
The Korean National Health and Nutrition Examination Survey (KNHANES) is an ongoing series of cross-sectional surveys. It is conducted by the Korea Centers for Disease Control (KCDC) and is designed to assess health and nutritional information from a representative sample of Koreans. This study analyzed the fifth Korean National Health and Nutrition Examination Survey (KNHANES V, 2010-2012), which included a total number of 17,218 participants, 7,170 males and 10,048 females. Only postmenopausal women (n = 4,667) who answered “yes” to the question about menopausal status were included. The subjects for this study were selected based on the following criteria. First of all, individuals who did not respond to the food intake survey or lacked information on serum ferritin level were excluded.
Those who had chronic liver or renal diseases, known diagnoses of malignancies, or probable hemochromatosis, based on abnormal values of serum ferritin (≥ 500 ng/mL), were also excluded. Thus, the postmenopausal women who met the above criteria (n = 3880) were selected, and the subjects were divided into quartiles, based on serum ferritin concentrations:
Q1, ≤ 35.4 ng/mL (median; 24. 5 ng/mL); Q2, 35.5-56.1 ng/mL (median; 45.3 ng/mL); Q3, 56.2-86.6 ng/mL (median; 69.1 ng/mL); and Q4, > 86.7 ng/mL (median; 114.9 ng/mL).
General characteristics
The subjects in this study were grouped according to the general characteristics of the subjects: survey year (2011, 2012, 2013), age (less than 50, 50-59, 60-69 and over 70 years), current smoking status (yes or no to ‘current smoking’), regular exercise (‘yes’ and ‘no’, based on self-reported regular physical exercise), education (less than middle school graduate, high school graduate, and college graduate or higher), drinking habit (none- drinker, drinking frequency ≤ 1-2 times/year; occasional drinker, drinking frequency ≤ 2-4 times/month; heavy drinker, drinking frequency alcohol ≥ 2 times/week), living area (large city, mid-sized or small city, rural area), and monthly income (divided into 4 groups - Low, Mid-low, Mid-high, and High groups by mean values based on the income of the participant’s age group).
Physical and hematological measurements
Body mass index (BMI) was calculated by dividing the weight (kilograms) by the height squared (square meters). Since subjects who were underweight (BMI < less than 18.5) comprised only 2.1%, BMI was separated into 3 categories: less than 22.9 as normal, 23 < BMI < 24.9 as overweight, and more than 25.0 kg/m2 as obese. Blood pressure was measured in the sitting position with a mercury sphygmomanometer on the right arm and averaged for a final blood pressure reading.
Blood samples were obtained in the morning following an overnight fast. The serum concentrations of glucose, cholesterol,
high- density lipoprotein (HDL) cholesterol, and triglyceride (TG) were measured using a Hitachi automatic analyzer 7600 (Tokyo, Japan). Serum ferritin and iron were measured by immunora- diometric assays using a 1470 Wizard gamma-counter (Perkin- Elmer, Turku, Finland). Total blood heavy metals were measured by a cold-vapor atomic absorption spectrometric method using a dedicated mercury analyzer (M-6000A, CETAC Technologies).
All clinical analyses were performed by the Neodin Medical Institute, a laboratory certified by the Korea Ministry of Health and Welfare.
Food groups and nutrient intakes
The consumptions of major food groups and nutrient intakes were estimated based on 24-hour dietary recalls interviews.
Nutrient intakes and the ratios of energy intake from each macronutrient to total energy (percentage (%) of energy intake from carbohydrate, fat, and protein) were determined. To estimate the intake of food groups by the participants, the secondary food code for 24 hour recall data was used. The KNHENES applied 18 food group classifications based on the Rural Development Administration (RDA) food ingredient tables:
16 general food groups, one cooking processed food group, and one other group [23]. Briefly, 5000 different food codes were used to code the intake of adult respondents and these individual KNHANES food codes were collapsed into 144 food items. In addition to the 144 food item codes, the foods were further collapsed into 18 food groups.
Statistical analysis
To make valid inferences accounting for the KNHANES 2010- 2012 complex multistage sampling design, sampling weights were incorporated to produce population estimates using SAS software (version 9.2; SAS Institute, Cary, NC, USA). The survey sample weights were calculated taking into consideration the sampling rate, response rate, and proportion of the reference population. The data results were reported as weighted %, mean values, and standard errors.
Chi-square test (χ2-test) was performed to identify significant differences among categorical variables, and significant differences among continuous variables were verified by GLM (Generalized Linear Model) through the proc surveyreg procedure. To analyze nutrient and food intake, descriptive statistics were generated for mean values and standard errors of nutrient intake, using ferritin quartiles as the independent variable and the nutrient and food group intake as the dependent variable.
Significance testing was conducted for P for trends using the proc surveyreg procedure.
Odds ratios (ORs) were used as a measure of association. For OR calculation, the subjects were categorized into two classes based on the value of ferritin: a high-risk group (4Q, serum ferritin level > 86.7 ng/mL) and a control group (1Q-3Q, serum ferritin level ≤ 86.7 ng/mL). In comparing the effect of the selected variable, the remaining covariates were adjusted. For example, to determine the effect of age on high ferritin risk, variables other than age were adjusted: drinking habit, educational level, BMI, Blood glucose, SBP, HDL, TG, serum iron, and energy intake. Significance level was set at the 95%
Confidence Interval (CI).
Q1 (N = 970) Q2 (N = 970) Q3 (N = 971) Q4 (N = 969)1) P-value3)
N %2) N % N % N %
Survey year
2010 294 31.5 333 33.5 295 29.2 312 31.2 0.571
2011 326 34.6 339 35.5 328 33.4 361 36.3
2012 350 33.9 298 30.9 348 37.3 296 32.4
Age
less than 50 135 20.1 68 10.5 60 9.6 50 8.9 0.017
50-59 260 29.8 330 38.8 318 38.7 272 32.2
60-69 290 25.2 320 27.9 317 26.9 296 26.7
70 or higher 285 24.9 252 22.7 276 24.8 351 32.2
Current smoking status
No 931 95.9 937 95.3 945 96.5 929 94.3 0.304
Yes 38 4.1 33 4.7 26 3.5 40 5.7
Regular exercise
No 565 68.7 557 66.0 529 62.6 562 66.5 0.296
Yes 265 31.3 279 34.0 317 37.4 283 33.5
Education level
Middle school or less 581 67.2 641 75.6 624 75.7 643 72.7 < 0.001
High school 150 18.7 149 18.5 h 155 17.4 134 18.3
≥ College 101 14.0 47 6.0 66 6.8 67 9.0
Drinking
no drinking 202 35.6 177 29.8 148 24.6 157 26.3 < 0.001
1-4/month 327 58.7 349 61.4 371 66.1 360 63.4
≥ 2-4/weeks 33 5.6 38 8.8 47 9.4 47 10.3
Living area
Large city 372 40.3 404 43.0 405 41.8 384 40.1 0.437
Middle & Small city 320 31.0 326 31.7 308 31.7 276 29.6
Rural area 278 28.7 240 25.4 258 26.5 309 30.3
Income
Low 302 33.7 292 30.5 287 31.0 299 33.2 0.063
Middle-low 214 27.4 228 28.4 219 25.4 219 26.2
Middle-high 152 20.3 169 22.0 164 22.3 165 22.3
High 153 18.6 141 19.1 172 21.3 157 18.4
1)Quartiles based on serum ferritin concentrations: Q1, ≤ 35.4 ng/mL (median; 24. 5 ng/mL); Q2, 35.5-56.1 ng/mL (median; 45.3 ng/mL); Q3, 56.2-86.6 ng/mL (median;
69.1 ng/mL); and Q4, > 86.7 ng/mL (median; 114.9 ng/mL).
2)Weighted %
3)P-value by chi-square (χ2) test by proc survey frequency procedure Table 1. Descriptive characteristics of subjects in postmenopausal women
RESULTS
Descriptive characteristics of subjects by ferritin quartiles The baseline characteristics of the subjects by ferritin quartiles are presented in Table 1. Age, education levels, and drinking habits were significantly associated with ferritin levels. Subjects aged 70 or higher constituted the highest weighted percentage (32.2%) in the 4th quartile of ferritin levels, whereas those aged 50-59 years had higher proportions in the 2nd and 3rd quartiles.
In terms of education, the proportion of individuals with low education level (middle school or less) significantly increased as the quartile of serum ferritin increased. The percentage of subjects who drank more than 2-4 times/week significantly increased as the quartile of serum ferritin increased (1st quartile 5.4%, 2nd quartile 6.1%, 3rd quartile 9.3%, 4th quartile 10.7%. P
= 0.0003). Other variables such as survey year, smoking status, exercise habit, living area, or monthly income, were not associated with ferritin level in postmenopausal women.
Physical and hematological parameters of subjects by ferritin quartiles
Subjects with higher ferritin levels tended to have higher mean BMI (Table 2). Systolic blood pressure (SBP) and blood glucose levels also showed a positive association with serum ferritin levels. The high density lipoprotein (HDL) cholesterol had a negative correlation with serum ferritin levels, while TG showed a positive association. Serum Fe level was positively correlated with serum ferritin level, whereas heavy metals such as Pb and Cd were not significantly associated with ferritin level.
Q1 (N = 970) Q2 (N = 970) Q3 (N = 970) Q4 (N = 969)1) P for trend2)
Mean SE Mean SE Mean SE Mean SE
Height (cm) 153.9 0.2 153.7 0.3 153.8 0.3 153.3 0.3 0.086
Weight (kg) 57.3 0.4 57.5 0.4 57.7 0.4 58.3 0.4 0.001
BMI (kg/m2)3) 24.2 0.1 24.3 0.1 24.4 0.2 24.8 0.2 < 0.0001
Sbp (mmHg) 125.0 0.9 125.6 0.7 127.5 0.8 127.5 0.8 0.006
Dbp (mmHg) 75.4 0.5 75.8 0.4 77.4 0.4 76.5 0.5 0.071
Glucose (mg/dL) 97.4 0.8 98.5 0.7 98.9 0.7 102.7 0.9 < 0.0001 Cholesterol (mg/dL) 201.6 1.6 201.9 1.5 204.5 1.6 202.5 1.5 0.88
HDL (mg/dL) 53.7 0.6 51.9 0.6 51.9 0.6 49.5 0.6 < 0.0001
TG (mg/dL) 138.8 2.9 137.7 2.9 141.3 2.9 149.7 3.1 0.009
Ferritin(ng/mL) 22.2 0.4 45.4 0.3 69.7 0.4 136.0 2.5 < 0.0001
Fe (umol/L) 94.0 1.5 102.5 1.4 102.4 1.4 106.8 1.4 < 0.0001
Pb (ug/dL) 2.1 0.1 2.4 0.1 2.4 0.1 2.3 0.1 0.113
Cd (ug/dL) 1.3 0.1 1.5 0.1 1.5 0.1 1.4 0.1 0.133
1)Quartiles based on serum ferritin concentrations: Q1, ≤ 35.4 ng/mL (median; 24. 5 ng/mL); Q2, 35.5-56.1 ng/mL (median; 45.3 ng/mL); Q3, 56.2-86.6 ng/mL (median;
69.1 ng/mL); and Q4, > 86.7 ng/mL (median; 114.9 ng/mL).
2)P for trend (crude P) obtained by proc survey regression procedure.
3)BMI: Body mass index, HDL: high density lipoprotein, LDL: low density lipoprotein, TG: triglyceride, Sbp: Systolic blood pressure, Dbp: Diastolic blood pressure, Pb: plumbum (lead), Cd: cadminum
Table 2. Physical and hematological parameters in postmenopausal women
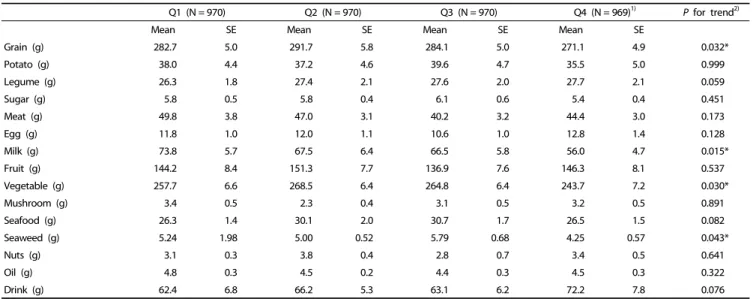
Q1 (N = 970) Q2 (N = 970) Q3 (N = 970) Q4 (N = 969)1) P for trend2)
Mean SE Mean SE Mean SE Mean SE
Grain (g) 282.7 5.0 291.7 5.8 284.1 5.0 271.1 4.9 0.032*
Potato (g) 38.0 4.4 37.2 4.6 39.6 4.7 35.5 5.0 0.999
Legume (g) 26.3 1.8 27.4 2.1 27.6 2.0 27.7 2.1 0.059
Sugar (g) 5.8 0.5 5.8 0.4 6.1 0.6 5.4 0.4 0.451
Meat (g) 49.8 3.8 47.0 3.1 40.2 3.2 44.4 3.0 0.173
Egg (g) 11.8 1.0 12.0 1.1 10.6 1.0 12.8 1.4 0.128
Milk (g) 73.8 5.7 67.5 6.4 66.5 5.8 56.0 4.7 0.015*
Fruit (g) 144.2 8.4 151.3 7.7 136.9 7.6 146.3 8.1 0.537
Vegetable (g) 257.7 6.6 268.5 6.4 264.8 6.4 243.7 7.2 0.030*
Mushroom (g) 3.4 0.5 2.3 0.4 3.1 0.5 3.2 0.5 0.891
Seafood (g) 26.3 1.4 30.1 2.0 30.7 1.7 26.5 1.5 0.082
Seaweed (g) 5.24 1.98 5.00 0.52 5.79 0.68 4.25 0.57 0.043*
Nuts (g) 3.1 0.3 3.8 0.4 2.8 0.7 3.4 0.5 0.641
Oil (g) 4.8 0.3 4.5 0.2 4.4 0.3 4.5 0.3 0.322
Drink (g) 62.4 6.8 66.2 5.3 63.1 6.2 72.2 7.8 0.076
1)Quartiles based on serum ferritin concentrations: Q1, ≤ 35.4 ng/mL (median; 24. 5 ng/mL); Q2, 35.5-56.1 ng/mL (median; 45.3 ng/mL); Q3, 56.2-86.6 ng/mL (median;
69.1 ng/mL); and Q4, > 86.7 ng/mL (median; 114.9 ng/mL).
2)P for trend (crude P) obtained by proc survey regression
Table 3 Daily consumption of food groups in postmenopausal women
Major food intakes by serum ferritin quartile
Grain consumption was found to negatively relate with serum ferritin levels in postmenopausal women (Table 3). Furthermore, milk intake was also found to have a negative association among the groups. Vegetable intake also showed a negative correlation with serum ferritin levels. There were no significant associations between the intakes of potatoes, legume, sugar, meat, egg, fruit, mushroom, seafood, nuts, oil, or eggs and ferritin quartiles.
Major nutrient intakes by serum ferritin quartile
The daily intakes of energy, carbohydrate, protein, and fat showed a significantly negative association with increasing ferritin
quartiles (Table 4). However, when calculating the percent ratio of these energy nutrients to the total daily intake, no significant relationship between ferritin levels and the energy nutrients was found. Serum ferritin levels were also found to have a signifi- cantly negative association with calcium, vitamin A, and vitamin C intakes.
Odds Ratios of potential factors associated with serum ferritin level In comparing the effect of the selected variable, the remain- ing covariates were adjusted (Table 5). ORs greater than 1 indicated an increased likelihood of having high ferritin among postmenopausal women after adjustment of covariates.
Postmenopausal women aged 50-59 were significantly less likely
Q1 (N = 970) Q2 (N = 970) Q3 (N = 970) Q4 (N = 969)1) P for trend2)
Mean SE Mean SE Mean SE Mean SE
Energy (Kcal)3) 1,540.0 25.4 1,570.9 23.0 1,512.3 21.3 1,477.4 21.9 0.0002
Carbohydrate (g) 281.4 4.1 288.9 4.4 280.9 3.9 272.1 3.9 0.014
Protein (g) 50.6 1.1 51.0 1.0 49.6 0.9 48.2 0.9 0.043
Fat (g) 24.9 0.9 23.7 0.7 22.3 0.7 22.3 0.8 0.007
Fiber (g) 6.3 0.2 6.3 0.2 6.4 0.2 6.3 0.2 0.704
Calcium (mg) 405.9 10.2 402.2 11.3 403.7 10.4 385.7 11.9 0.050 Phosphorus (mg) 909.2 15.6 923.2 15.3 902.2 14.0 877.7 15.6 0.119
Iron (mg) 12.0 0.3 12.3 0.4 12.2 0.4 12.2 0.5 0.231
Sodium (mg) 3,654.2 104.6 3,657.0 104.4 3,705.9 110.2 3,715.2 85.8 0.071 Vitamin A (ug RE) 598.6 20.7 655.3 31.0 630.2 27.5 583.1 27.9 0.050 Carotene (ug) 3,215.8 123.4 3,490.9 175.6 3,391.1 156.4 3,044.3 155.3 0.536
Retinol (ug) 56.4 3.3 60.8 5.3 56.3 6.1 55.9 4.6 0.202
vitamin B1 (mg) 1.0 0.0 1.0 0.0 0.9 0.0 0.9 0.0 0.061
Vitamin B2 (mg) 0.9 0.0 0.9 0.0 0.9 0.0 0.8 0.0 0.071
Niacin (mg) 11.9 0.2 12.4 0.2 11.8 0.2 11.6 0.2 0.226
Vitamin C (mg) 93.1 4.9 88.6 3.1 87.8 2.9 81.4 3.1 0.02
Protein (%)4) 13.0 0.1 12.9 0.1 13.0 0.1 13.0 0.2 0.685
Fat (%)4) 13.7 0.4 13.1 0.3 12.8 0.3 13.0 0.3 0.193
CHO (%)4) 73.3 0.4 74.0 0.4 74.1 0.4 74.0 0.4 0.251
1)Quartiles based on serum ferritin concentrations: Q1, ≤ 35.4 ng/mL (median; 24. 5 ng/mL); Q2, 35.5-56.1 ng/mL (median; 45.3 ng/mL); Q3, 56.2-86.6 ng/mL (median;
69.1 ng/mL); and Q4, > 86.7 ng/mL (median; 114.9 ng/mL).
2)P for trend (crude P) obtained by proc survey regression.
3)Excluded groups with < 500 kcal or > 5,000 kcal of total daily caloric intake.
4)(%) Percent of usual energy intake from energy nutrient = 100 × {usual intake of energy nutrient (kcal)} /{usual intake of energy (kcal)}
Table 4. Daily dietary energy and nutrient intakes in postmenopausal women
to have high ferritin levels than women of age 70 or more.
Drinking habit (no drinking vs. 2-4 times /week) was significantly associated with high ferritin levels even after adjustment of covariates. Subjects with normal weight (BMI less than 23) were significantly less likely than obese subjects to have high ferritin levels, both with crude or adjusted covariates. The significant associations between high ferritin levels and SBP, HDL, or TG levels disappeared after the adjustment of covariates. Subjects with high fasting blood glucose levels were significantly more likely to have high ferritin levels, even after adjustment of covariates. The OR for high ferritin in relation to serum iron levels was statistically significant in postmenopausal women after adjustments.
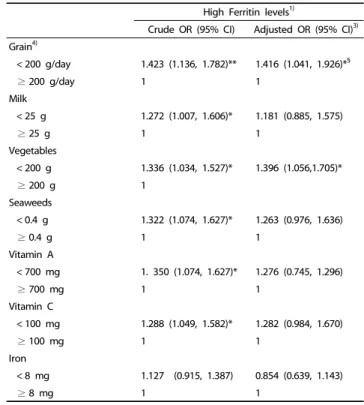
Odds Ratios (ORs) for potential food groups and nutrients associated with high serum ferritin levels
The ORs and confidence interval (CI) for the risk of high ferritin levels in relation to the intakes of foods and nutrients are presented in Table 6. Subjects with low grain intake were significantly more likely than those with high grain intake to have high ferritin levels, for either crude or adjusted confoun- ding cofactors. The significant negative association between milk intake and ferritin levels disappeared after adjustment. The significant negative association between vegetable intake and ferritin levels remained after the adjustment of confounding cofactors. The significant negative association between seaweed intake and ferritin levels also disappeared after adjustment. The significant association between ferritin risk and vitamin A or vitamin C and iron intakes was attenuated after adjustment.
DISCUSSION
In light of the dearth of reports on health problems caused by high ferritin in women in recent years, it is important to assess which factors, besides hormonal changes, are related to high ferritin levels. Thus, we selected postmenopausal women to minimize the effects of hormonal changes, and to evaluate the dietary and lifestyle factors related to high ferritin levels.
We applied logistic regression models to determine the independent effect of those factors on the risk of serum ferritin.
A previous study reported that moderately elevated iron levels (median level of 75-85 ng/mL in postmenopausal women) were associated with an increased prevalence of metabolic syndrome and diabetes [24]. Based on the above study, we compared the high-risk group (4Q, serum median ferritin level > 86.7 ng/mL) to the control group (1Q-3Q, serum median ferritin level ≤ 86.7 ng/mL). Odds ratios (ORs) and 95% confidence intervals (95%
CIs) for high ferritin risk were calculated using multivariate logistic regression analyses after adjusting for confounding variables
In this study, upon fully adjusting for covariates, age, BMI, and blood glucose still remained as significant factors for high risk of ferritin in postmenopausal women. Age seems to be an important factor for high ferritin risk in postmenopausal women. Our study showed that women over 70 comprised the highest percentage of the high-risk ferritin group (Q4). This result is consistent with a previous study that reported that plasma ferritin concentrations increased with age in postme- nopausal women [8]. We believe that older women, especially
High Ferritin1)
Crude OR (95% CI) Adjusted OR (95% CI)2) Age (yrs)
less than 50 0.723 (0.457, 1.078) 0.673 (0.417, 1.087) 50-59 0.661 (0.539, 0.810)*** 0.641 (0.485, 0.846)**
60-69 0.681 (0.551, 0.842)** 0.654 (0.494, 0.867)**
≥ 70 1 1
Drinking
no drinking 0.649 (0.431, 0.963)* 0.631 (0.417, 0.956)*
1-4/month 0.721 (0.491, 1.059) 0.847 (0.501, 1.112)
≥ 2-4/ weeks 1 1
Education
Middle school or less 1.071 (0.753,1.524) 0.652 (0.413, 1.028) High school 1.090 (0.731, 1.625) 0.675 (0.408, 1.116)
≥ College 1 1
BMI (Obesity)
Normal 0.673 (0.588, 0.884)** 0.539 (0.42, 0.724)**
Overweight 0.843 (0.654, 1.086) 0.800 (0.589,1.087)
Obese 1 1
SBP3)
< 130 mmHg 0.955 (0.770, 1.186) 0.997 (0.740, 1.344)
≥ 130 mmHg 1 1
Fasting blood glucose3)
< 100 mg/dL 0.597 (0.467, 0.764)*** 0.676 (0.492, 0.930)**
≥ 100 mg/dL 1 1
Blood HDL3)
≥ 50 mg/dL 0.752 (0.500, 0.959)* 0.776 (0.576, 1.044)
< 50 mg/dL 1 1
Blood TG3)
< 150 mg/dL 0.703 (0.580, 0.853)*** 0.803 (0.625, 1.032)
≥ 150 mg/dL 1 1
Serum iron4)
< 100 ug/dL 0.616 (1.011, 1.568)*** 0.662 (0.516, 0.752)**
≥ 100 ug/dL 1 1
Total energy intake4)
< 1,500 kcal 1.321 (1.089, 1.604)** 1.310 (1.020, 1.684)*
≥ 1,500 kcal 1 1
*P< 0.05, **P< 0.01, ***P< 0.001
1)The high ferritin levels (Q4, > 86.7 ng/mL, median; 114.9 ng/mL).
2)In comparing the effect of the selected variable, the remaining variables listed above were adjusted. For example, to determine the effect of age on high ferritin risk, variables other than age were adjusted: drinking habit, educational level, BMI, SBP, Blood glucose, HDL, TG, glucose, serum iron, and energy intake.
3)Subjects were separated into two groups in accordance with the 2005 revised National Cholesterol Education Program Adult Treatment Panel III criteria.
4)Subjects were separated into two groups based on their mean intake.
Table 5. Odds Ratios (ORs) and 95% Confidence Intervals (CI) for factors associated with high serum ferritin levels in postmenopausal women
High Ferritin levels1)
Crude OR (95% CI) Adjusted OR (95% CI)3) Grain4)
< 200 g/day 1.423 (1.136, 1.782)** 1.416 (1.041, 1.926)*§
≥ 200 g/day 1 1
Milk
< 25 g 1.272 (1.007, 1.606)* 1.181 (0.885, 1.575)
≥ 25 g 1 1
Vegetables
< 200 g 1.336 (1.034, 1.527)* 1.396 (1.056,1.705)*
≥ 200 g 1
Seaweeds
< 0.4 g 1.322 (1.074, 1.627)* 1.263 (0.976, 1.636)
≥ 0.4 g 1 1
Vitamin A
< 700 mg 1. 350 (1.074, 1.627)* 1.276 (0.745, 1.296)
≥ 700 mg 1 1
Vitamin C
< 100 mg 1.288 (1.049, 1.582)* 1.282 (0.984, 1.670)
≥ 100 mg 1 1
Iron
< 8 mg 1.127 (0.915, 1.387) 0.854 (0.639, 1.143)
≥ 8 mg 1 1
*P< 0.05, **P< 0.01, ***P< 0.001
1)The high ferritin levels (Q4, > 86.7 ng/mL, median; 114.9 ng/mL).
2)Adjusted for age, drinking habit, education levels, BMI, TG, Blood glucose, energy intake
3)Food group intakes such as grain, legume, milk, seaweed were divided into two groups based on mean intake values of the subjects. For nutrient intakes such as vitamin A, vitamin C, and iron intake, the groups were separated in accordance with KDRI recommendation.
Table 6. Odds Ratios (ORs) and 95% Confidence Intervals (CI) for food intakes associated with high serum ferritin levels (Q4, > 86.5 ng/mL) in postmenopausal women
those older than 70, face greater health risk from various external factors as well as hormonal decline, which may have triggered an increase in ferritin levels [17].
Besides age, other important cofactors of ferritin risk in postmenopausal women were BMI and blood glucose level. This result is consistent with studies showing that BMI and glucose were positively associated with serum ferritin [24-26]. These two factors are also indicators of metabolic syndromes, which arise
as a combination of medical disorders closely linked to insulin resistance and increased risk of cardiovascular diseases [3,4].
Several studies have revealed that increased iron stores in postmenopausal women are associated with such diseases.
Recent meta-analysis also indicated that elevated levels of ferritin (individuals in the top fifth of ferritin levels) have about a 70% higher risk of T2DM events compared with those in the bottom fifth [25]. Possible mechanisms underlying how high ferritin levels affect metabolic syndromes or diabetes have been suggested: high levels of serum ferritin acts as a potent oxidant, which may cause cell damage in the body and lead to the development of various diseases [2]. Based on these studies, it may be that high glucose, high BMI, and high serum ferritin act synergistically, contributing to these diseases. However, this is only a cross sectional study, and thus the results of this study do not explain the causal effect relationship; longitudinal studies are needed to clarify this relationship.
Several studies have reported that socio- economical and lifestyle factors such as smoking, drinking, exercise, monthly income and educational level were associated with high ferritin [5,8,17]. However, in this study only drinking habit was associated with high ferritin levels. This discrepancy may have resulted from the selection of the study subjects and their
gender. Previous studies have reported smoking as an especially important factor associated with ferritin risk, but the subjects of this study had less than a 5% smoking population (possibly due to cultural and gender norms), which may have affected the results of our study.
This study found that the intake of grains and vegetables are important dietary factors negatively associated with serum ferritin level. It was reported that the subjects who consumed whole grains had a 77% lower risk of high iron stores than did the subjects who did not consume grains [8]. Another study also reported negative associations with serum ferritin and bread intake, independent of other potential confounders [21].
The intake of vegetables has been linked to anti-inflammatory effects, which may have caused the negative association with high serum ferritin level in women [12]. The negative influence of grain and vegetable consumption on serum ferritin may be related to various components in these plant based foods, most importantly fiber, phytate, and phytochemicals including polyphenols [11,12,26,27].
Interestingly, the total iron intake was not significantly associated with serum ferritin levels, in contrast to some previous studies [8,20]. Yet, this result is consistent with previous studies showing no significant correlation between serum ferritin and total iron intake in both young and adult women [28-30]. However, Fleming DJ et al. [31] reported that exclusion of supplemental iron from total iron intake may be the reason for the lack of association between total iron intake and serum ferritin. Since the information on vitamin or mineral supplements that contain iron is not available in KNHANES data at present, we did not include iron supplements in the total amount of iron intake. Therefore, further study of iron intake from supplements or health functional foods which may affect ferritin levels in postmenopausal women is needed.
There are also other limitations in this study. First, this is a cross sectional study and thus only shows statistical associations, rather than any cause-and-effect relationships. Second, because of the nature of the survey questionnaires, we could not exclude the effects of information bias. Third, the estimated amounts of food consumption were based on one 24 hour dietary recall, which is known to have high within-person variability. Despite these limitations, the present study has several strengths. First, we used data from a reliable nationally representative database, collected for 3 years from 2010-2012. Second, strict quality controls were applied to the study procedures within KNHANES.
In dietary intake data using 24 hour recall, despite within-person variability, the average intake level of the population drawn from a large, representative sample is believed to be unaffected by day-to-day variation [32]. Thus the result of this diet study is unlikely to be distorted due to a single day of 24 hour recall [33]. Overall, this study is meaningful because we think this is the first study showing that intakes of grains and vegetables are associated with high ferritin risk in postmenopausal women.
Prospective studies are needed to further identify the causal relationship between dietary intake and reduction of blood ferritin concentration in postmenopausal women.
In conclusion, we have demonstrated that age, obesity, drinking habit, and blood glucose were the most influential factors for elevated serum ferritin levels in postmenopausal
women. To reduce the risk of high ferritin in postmenopausal women, proper intake of plant based foods, especially whole grains and vegetables may be helpful.
REFERENCES
1. Cook JD, Lipschitz DA, Miles LE, Finch CA. Serum ferritin as a measure of iron stores in normal subjects. Am J Clin Nutr 1974;27:681-7.
2. Gudjoncik A, Guenancia C, Zeller M, Cottin Y, Vergely C, Rochette L. Iron, oxidative stress, and redox signaling in the cardiovascular system. Mol Nutr Food Res 2014;58:1721-38.
3. Lee BK, Kim Y, Kim YI. Association of serum ferritin with metabolic syndrome and diabetes mellitus in the South Korean general population according to the Korean National Health and Nutrition Examination Survey 2008. Metabolism 2001;60:1416-24.
4. Vari IS, Balkau B, Kettaneh A, Andre P, Tichet J, Fumeron F, Caces E, Marre M, Grandchamp B, Ducimetiere P; DESIR Study Group.
Ferritin and transferrin are associated with metabolic syndrome abnormalities and their change over time in a general population:
Data from an Epidemiological Study on the Insulin Resistance Syndrome (DESIR). Diabetes Care 2007;30:1795-801.
5. Liu JM, Hankinson SE, Stampfer MJ, Rifai N, Willett WC, Ma J. Body iron stores and their determinants in healthy postmenopausal US women. Am J Clin Nutr 2003;78:1160-7.
6. Zacharski LR, Ornstein DL, Woloshin S, Schwartz LM. Association of age, sex, and race with body iron stores in adults: analysis of NHANES III data. Am Heart J 2000;140:98-104.
7. Lecube A, Hernández C, Pelegrí D, Simó R. Factors accounting for high ferritin levels in obesity. Int J Obes (Lond) 2008;32:1665-9.
8. Fleming DJ, Tucker KL, Jacques PF, Dallal GE, Wilson PW, Wood RJ. Dietary factors associated with the risk of high iron stores in the elderly Framingham Heart Study cohort. Am J Clin Nutr 2002;76:1375-84.
9. Hallberg L. Bioavailability of dietary iron in man. Annu Rev Nutr 1981;1:123-47.
10. Rajpathak S, Ma J, Manson J, Willett WC, Hu FB. Iron intake and the risk of type 2 diabetes in women: a prospective cohort study.
Diabetes Care 2006;29:1370-6.
11. Shi Z, Hu X, Yuan B, Pan X, Dai Y, Holmboe-Ottesen G, Byles JE.
Strong negative association between intake of tofu and anemia among Chinese adults in Jiangsu, China. J Am Diet Assoc 2008;108:
1146-53.
12. Kim MH, Bae YJ. Postmenopausal vegetarians' low serum ferritin level may reduce the risk for metabolic syndrome. Biol Trace Elem Res 2012;149:34-41.
13. Kim BJ, Ahn SH, Bae SJ, Kim EH, Lee SH, Kim HK, Choe JW, Koh JM, Kim GS. Iron overload accelerates bone loss in healthy postmenopausal women and middle-aged men: a 3-year retrospective longitudinal study. J Bone Miner Res 2012;27:2279-90.
14. Atsma F, Bartelink ML, Grobbee DE, van der Schouw YT.
Postmenopausal status and early menopause as independent risk factors for cardiovascular disease: a meta-analysis. Menopause 2006;13:265-79.
15. Seo SK, Yun BH, Chon SJ, Lee YJ, Han EJ, Park JH, Cho S, Choi YS, Lee BS. Association of serum ferritin levels with metabolic syndrome and subclinical coronary atherosclerosis in postmeno- pausal Korean women. Clin Chim Acta 2015;438:62-6.
16. Cho GJ, Shin JH, Yi KW, Park HT, Kim T, Hur JY, Kim SH. Serum ferritin levels are associated with metabolic syndrome in postmenopausal women but not in premenopausal women.
Menopause 2011;18:1120-4.
17. Jian J, Pelle E, Huang X. Iron and menopause: does increased iron affect the health of postmenopausal women? Antioxid Redox Signal 2009;11:2939-43.
18. Soustre Y, Dop MC, Galan P, Hercberg S. Dietary determinants of the iron status in menstruating women. Int J Vitam Nutr Res 1986;56:281-6.
19. Garry PJ, Goodwin JS, Hunt WC. Iron status and anemia in the elderly: new findings and a review of previous studies. J Am Geriatr Soc 1983;31:389-99.
20. Beck KL, Conlon CA, Kruger R, Coad J. Dietary determinants of and possible solutions to iron deficiency for young women living in industrialized countries: a review. Nutrients 2014;6:3747-76.
21. Cade JE, Moreton JA, O'Hara B, Greenwood DC, Moor J, Burley VJ, Kukalizch K, Bishop DT, Worwood M. Diet and genetic factors associated with iron status in middle-aged women. Am J Clin Nutr 2005;82:813-20.
22. Liu JM, Hankinson SE, Stampfer MJ, Rifai N, Willett WC, Ma J. Body iron stores and their determinants in healthy postmenopausal US women. Am J Clin Nutr 2003;78:1160-7.
23. Rural Development Administration, National Rural Resources Development Institute (KR). Food Composition Table. 7th ed.
Suwon: Rural Development Administration, National Rural Resources Development Institute; 2006.
24. Guglielmi V, D'Adamo M, Bellia A, Ciotto RT, Federici M, Lauro D, Sbraccia P. Iron status in obesity: An independent association with metabolic parameters and effect of weight loss. Nutr Metab Cardiovasc Dis 2015;25:541-7.
25. Kunutsor SK, Apekey TA, Walley J, Kain K. Ferritin levels and risk of type 2 diabetes mellitus: an updated systematic review and meta-analysis of prospective evidence. Diabetes Metab Res Rev 2013;29:308-18.
26. Azadbakht L, Kimiagar M, Mehrabi Y, Esmaillzadeh A, Hu FB, Willett WC. Soy consumption, markers of inflammation, and endothelial function: a cross-over study in postmenopausal women with the metabolic syndrome. Diabetes Care 2007;30:967-73.
27. Hallberg L. Wheat fiber, phytates and iron absorption. Scand J Gastroenterol Suppl 1987;129:73-9.
28. Milman N, Schultz-Larsen K. Iron stores in 70-year-old Danish men and women. Evaluation in 469 individuals by serum ferritin and hemoglobin. Aging (Milano) 1994;6:97-103.
29. Galán P, Hercberg S, Soustre Y, Dop MC, Dupin H. Factors affecting iron stores in French female students. Hum Nutr Clin Nutr 1985;39:279-87.
30. Hallberg L, Bengtsson C, Lapidus L, Lindstedt G, Lundberg PA, Hultén L. Screening for iron deficiency: an analysis based on bone- marrow examinations and serum ferritin determinations in a population sample of women. Br J Haematol 1993;85:787-98.
31. Fleming DJ, Jacques PF, Dallal GE, Tucker KL, Wilson PW, Wood RJ. Dietary determinants of iron stores in a free-living elderly population: The Framingham Heart Study. Am J Clin Nutr 1998;67:722-33.
32. Guenther PM, Kott PS, Carriquiry AL. Development of an approach for estimating usual nutrient intake distributions at the population level. J Nutr 1997;127:1106-12.
33. O'Neil CE, Keast DR, Fulgoni VL, Nicklas TA. Food sources of energy and nutrients among adults in the US: NHANES 2003-2006.
Nutrients 2012;4:2097-120.