Received:
Revised:
Accepted:
June 12, 2013 October 25, 2013 November 11, 2013
Corresponding Author: Min Kyong Moon, Department of Internal Medicine, Seoul National University College of Medicine, 39 Boramae Road, Dongjak-Gu, Seoul 156-707, Korea
Tel: +82-2-870-2226, Fax: +82-2-831-2826, E-mail: [email protected]
This is an Open Access article distributed under the terms of the creative Commons Attribution Non-Commercial License (http://creativecommons.org/licenses/by-nc/3.0) which permits unrestricted non-commercial use, distribution, and reproduction in any medium, provided the original work is properly cited.
pISSN 2287-2892 • eISSN 2288-2561
JLA
Serum Ferritin Level is an Independent Predictor of Insulin Resistance in Non-diabetic Men Aged Between 30-69 Years:
Korean National Health and Nutrition Examination Survey 2008-2010
Bo Kyung Koo, Sang Wan Kim, Ka Hee Yi, Min Kyong Moon
Department of Internal Medicine, Seoul National University College of Medicine, Boramae Medical Center, Seoul, Korea
Objective: We investigated predictors of insulin resistance in Korean population from the Korean National Health and Nutrition Examination Surveys.
Methods: Adults aged between 30-69 years without anemia were selected for the analysis. Fat mass was measured by dual-energy X-ray absorptiometry, and 24-hour nutritional information was obtained by interview from study subjects. Insulin resistance and beta cell function were calculated from homeostatic model assessment.
Results: 6,256 men and 8,003 women were included in the the study. Among participants, 9.8 (standard error [SE] 0.4)
% of men and 6.8 (SE 0.4) % of women had diabetes mellitus (DM); moreover, serum ferritin level was higher in the DM patients compared to the non-DM subjects both in men and women (p<0.001). Serum ferritin levels correlated significantly with insulin resistance (age and body mass index adjusted p<0.001) in men, but not in women. Serum ferritin levels also correlated with total body fat (p=0.009), triglyceride levels (p<0.001), alanine aminotransferase (ALT) levels (p<0.001) and leukocyte count (p<0.001), but not with iron or fat intake. Multivariate analysis showed that serum ferritin level was an independent predictor of insulin resistance even after adjusting body fat, ALT levels, triglyceride levels and leukocyte count (β=0.027, p=0.027). Beta cell function was not associated with ferritin levels both in men and women.
Conclusion: Elevated serum ferritin was a risk factor for DM by increasing insulin resistance rather than affecting beta cell function. Serum ferritin level was an independent predictor of insulin resistance even after adjusting body fat or systemic inflammation in men.
Key Words: Ferritin, Insulin resistance, Diabetes mellitus
INTRODUCTION
Several cross sectional studies showed that elevated serum ferritin concentrations were associated with cardio- vascular disease.1,2 essential hypertension,3 and diabetes.4,5 As serum ferritin concentration reflects systemic infla-
mmation,6 it is not clear whether elevated ferritin level is cause or result in developing metabolic disease which is also known to accompany systemic inflammation.7,8 However, recent longitudinal study showed that elevated serum ferritin levels were independently associated with future development of metabolic syndrome during the
5-year follow-up period,9 which suggests that elevated ferritin level might be a risk factor of metabolic syndrome.
Ferritin is strongly associated with insulin resistance5,10 and insulin resistance is one of important beneath mechanism of metabolic diseases.11,12 However, it is difficult to investigate the lone effect of ferritin on insulin resistance.
Serum ferritin concentration is marker of iron stores in the body13 as well as systemic inflammation6 and is associated with the amount of heme-iron intake: heme- iron intake14 and anemia14-16 also have been reported to be independently associated with insulin resistance or metabolic disease. Furthermore, central adiposity, an important risk factor of insulin resistance, is also associated with ferritin level.17 Such factors above make it difficult to differentiate the lone effect of ferritin on insulin resistance.
Therefore, we performed this study to assess the associated factor of ferritin level with body fat mass measurement, the personal dietary information and other metabolic parameters and to investigate the lone effect of ferritin on insulin resistance adjusting possible confounders in a large-sized national survey in the Korean population.
MATERIALS AND METHODS
1. SubjectsThe Korean Ministry of Health and Welfare has conducted a series of four Korean National Health and Nutrition Examination Survey (KNHANES) in non-insti- tutionalized Korean civilians since 1998 using a stratified, multistage, probability–sampling design to be repre- sentative of the Korean population. To ensure the results represented the entire Korean population weights were assigned to each respondent. This weighting method guarantees unbiased point estimates of population parameters for the entire population and its subsets.18
We selected and compared the data in 2008 to 2010
for our study as body fat mass was measured by dual- energy X-ray absorptiometry since 2008. The number of the entire participants of health examination was 9,308 (response rate, 74.3%) in KNHANES 2008, 10,078 (79.2%) in KNHANES 2009 and 8,473 (77.5%) in KNHANES 2010.
Among them, adults aged between 30–69 years with hemoglobin level 10–18 g/dL were included in our study.
2. Measurement of metabolic parameters
Anthropometric measurements were conducted by well-trained examiners in the same manner in each study.
Weight was measured to the nearest 0.1 kg using a calibrated balance-beam scale (Giant-150N; Hana, Seoul, Korea) and waist circumference was measured to the nearest 0.1 cm from the narrowest point between the lower borders of the rib cage and the iliac crest at the end of normal expiration.
Fat mass and lean body mass were measured by dual-energy X-ray absorptiometry (Discovery QDR 4500 W, Hologic Inc., Denver, CO, USA) and percent of body fat was calculated from fat mass divided by (fat mass + lean body mass).
Venous blood samples were drawn after a 12-hour (h) overnight fast and plasma was separated immediately by centrifugation. Plasma concentrations of glucose and lipids were measured enzymatically in a central laboratory;
Advia 1650/2400 (Siemens, New York, NY, USA) in 2008 and Hitachi Automatic Analyzer 7600 (Hitachi, Tokyo, Japan) in 2009 and 2010 hemoglobin A1c (HbA1c) was measured by high-performance liquid chromatography assay using BIO-RAD Variant II (Bio-Rad, Carlsbad, CA, USA) in 2008 and HLC-723G7 (Tosoh, Japan) in 2009 and 2010.
To confirm and compare accuracy and consistency in each survey, all biochemical measurements were double- checked on another day and at least 40 samples were selected to be measured using the standard method according to Clinical and Laboratory Standards Institute
Table 1. Characteristics of study participants from Korean National Health and Nutrition Examination Surveys 2008-2010 Men
(n=6,256) Women
(n=8,003) p value
Age (years) 46.3±0.2 47.0±0.2 <0.001
Body mass index (kg/m2) 24.3±0.1 23.5±0.1 <0.001
Hemoglobin (g/dL) 15.3±0.0 13.1±0.0 <0.001
AST (IU/L) 25.2±0.2 20.2±0.1 <0.001
ALT (IU/L) 28.2±0.3 18.2±0.2 <0.001
Leukocyte count (103/μL) 6.6±0.3 5.7±0.2 <0.001
Prevalence of DM (%) 9.8(0.4) 6.8(0.4) <0.001
Ferritin (ng/mL) 131.6±2.2 46.0±0.6 <0.001
Subjects with DM 177.8±9.2 66.4±3.0
Subjects without DM 127.1±2.3 44.7±0.6
Subjects with MetS 165.9±5.8 61.9±1.6
Subjects without MetS 121.4±3.3 40.9±0.7
Data was presented as mean±standard error or percent.
AST; aspartate aminotransferase, ALT; alanine aminotransferase, DM; diabetes mellitus, MetS; metabolic syndrome
guideline. Details of measurement of the metabolic para- meters have been described previously.19,20
Insulin resistance (IR) and pancreatic beta cell function (B) were assessed by the homeostasis model assessment (HOMA)- IR and HOMA-B respectively.21 Cases of diabetes mellitus (DM) were defined as subjects who were users of anti-diabetic medication including insulin at the point of the survey, had HbA1C of ≥6.5%, or had 8h-fasting plasma glucose levels ≥126 mg/dL. The working definition of the National Cholesterol Education Program-Adult Treatment Panel III22 was used to define metabolic syndrome (MetS): three or more of the following criteria- 1) waist circumference >90 cm in men and >80 cm in women using the International Obesity Task Force criteria for the Asian-Pacific population to determine waist circumference; 2) triglycerides ≥150 mg/dL or medication use; 3) HDL cholesterol <40 mg/dL in men and <50 mg/dL in women or medication use; 4) blood pressure ≥130/85 mmHg or antihypertensive medication use; and 5) fasting glucose ≥100 mg/dL or medication.
3. Assessment of dietary indices
Nutritional information was collected by 24-h recall
administered by a trained dietary interviewer at the Korea Health Industry Development Institute. This 24-h recall was based on food intake on 1 weekday and the nutrients were quantified using the Database Management System (Korea Health Industry Development Institute, Seoul, Korea). To assist subjects with recall, supplementary tools such as food models and 2-dimensional food volumes and containers were used. Detailed information has been published elsewhere.23
4. Statistical analyses
All data were analyzed using SPSS for Windows (SPSS Inc., Chicago, IL, USA). The results are presented as means (standard deviation, SD) or as prevalence (% and standard error [SE]). In the case of variables not normally distributed, logarithmic transformation was performed before ana- lysis. Sampling weights were used to account for the complex sampling, and all analyses were conducted independently for each sex. Weight for time-series analysis was used for multivariate analysis of combined data from KNHANES 2008–2010 as Korea Centers for Disease Control and Prevention recommended.23 A p value of <0.05 was considered statistically significant.
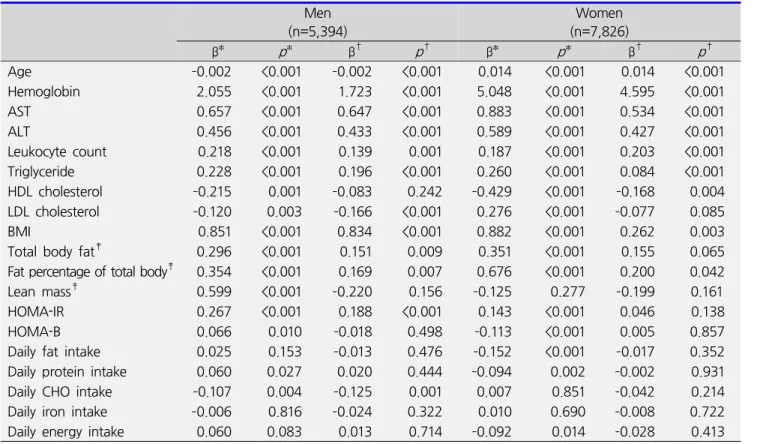
Table 2. Association between ferritin and metabolic parameters Men
(n=5,394)
Women (n=7,826)
β* p* β† p† β* p* β† p†
Age –0.002 <0.001 –0.002 <0.001 0.014 <0.001 0.014 <0.001
Hemoglobin 2.055 <0.001 1.723 <0.001 5.048 <0.001 4.595 <0.001
AST 0.657 <0.001 0.647 <0.001 0.883 <0.001 0.534 <0.001
ALT 0.456 <0.001 0.433 <0.001 0.589 <0.001 0.427 <0.001
Leukocyte count 0.218 <0.001 0.139 0.001 0.187 <0.001 0.203 <0.001
Triglyceride 0.228 <0.001 0.196 <0.001 0.260 <0.001 0.084 <0.001
HDL cholesterol –0.215 0.001 –0.083 0.242 –0.429 <0.001 –0.168 0.004
LDL cholesterol –0.120 0.003 –0.166 <0.001 0.276 <0.001 –0.077 0.085
BMI 0.851 <0.001 0.834 <0.001 0.882 <0.001 0.262 0.003
Total body fat‡ 0.296 <0.001 0.151 0.009 0.351 <0.001 0.155 0.065
Fat percentage of total body‡ 0.354 <0.001 0.169 0.007 0.676 <0.001 0.200 0.042
Lean mass‡ 0.599 <0.001 –0.220 0.156 –0.125 0.277 –0.199 0.161
HOMA-IR 0.267 <0.001 0.188 <0.001 0.143 <0.001 0.046 0.138
HOMA-B 0.066 0.010 –0.018 0.498 –0.113 <0.001 0.005 0.857
Daily fat intake 0.025 0.153 –0.013 0.476 –0.152 <0.001 –0.017 0.352
Daily protein intake 0.060 0.027 0.020 0.444 –0.094 0.002 –0.002 0.931
Daily CHO intake –0.107 0.004 –0.125 0.001 0.007 0.851 –0.042 0.214
Daily iron intake –0.006 0.816 –0.024 0.322 0.010 0.690 –0.008 0.722
Daily energy intake 0.060 0.083 0.013 0.714 –0.092 0.014 –0.028 0.413
*Monovariate linear regression analysis, †Linear regression analysis adjusting age and BMI, ‡Measured by dual-energy X-ray absorptiometry
AST; aspartate aminotransferase, ALT; alanine aminotransferase, BMI; body mass index, HOMA-IR; homeostasis model assessment of insulin resistance, HOMA-B; homeostasis model assessment of beta cell function, CHO; carbohydrate
RESULTS
1. Serum ferritin level according to DM or MetS
Among 15,059 adults aged between 30–69 years in KNHANES 2008-2010, only the subjects with blood hemoglobin level within 10–18 g/dL were selected to exclude the confounding factors for ferritin level. Finally 6,256 men and 8,003 women were included in our study.
Mean age was 46.7 (SE, 0.2) years and mean body mass index (BMI) was 23.91 (SE, 0.03) kg/m2 (Table 1). As there were significant differences in age, BMI and blood ferritin level according to gender, the further analysis to inves- tigate the associated factors of ferritin was performed in each gender respectively. Among entire study popu- lation, 9.8 (SE 0.4)% of men and 6.8 (SE 0.4)% of women
had DM. Serum ferritin level was significantly higher in DM patients compared to non-DM subjects both in men and women (177.8 [SE 9.2] ng/mL vs. 127.1 [SE 2.3] ng/mL in men; 66.4 [SE 3.0] ng/mL vs. 44.7 [SE 0.6] ng/mL in women; p<0.001 in both; Table 1). As age and BMI was significantly associated in serum ferritin level (p<0.001 in both sex), we subsequently adjusted age and BMI. Even after adjusting age and BMI, serum ferritin level was significantly higher in DM patients in men (p<0.001) but not in women (p=0.276).
Subjects with MetS had also significantly higher ferritin level compared to those without MetS in both sex (Table 1): after adjusting age and BMI, serum ferritin level was significantly higher in the subjects with MetS (p<0.001 in men and p=0.003 in women).
Table 3. Predictor of insulin resistance (HOMA- IR) in men without diabetes mellitus
Model β* p* value
Ferritin (unadjusted) 0.106 <0.001
Ferritin 0.060 <0.001
BMI 1.567 <0.001
Age – 0.633
Ferritin 0.031 0.002
BMI 1.359 <0.001
ALT 0.149 <0.001
Age – 0.184
Ferritin 0.030 0.003
BMI 1.340 <0.001
ALT 0.148 <0.001
WBC 0.069 0.005
Age – 0.144
Ferritin 0.027 0.007
BMI 1.321 <0.001
ALT 0.144 <0.001
WBC 0.057 0.024
Hb 0.273 0.016
Age – 0.062
Ferritin 0.021 0.027
BMI 1.237 <0.001
ALT 0.121 <0.001
WBC 0.027 0.290
Triglyceride 0.112 <0.001
Age – 0.495
Ferritin 0.048 <0.001
Total body fat mass† 0.522 <0.001
Age – 0.108
Ferritin 0.059 <0.001
Fat percent of total body† 0.627 <0.001
Age – 0.423
*Multivariate linear regression analysis
Measured by dual-energy X-ray absorptiometry
BMI; body mass index, ALT; alanine aminotransferase, HOMA-IR; homeostasis model assessment of insulin resistance
2. Predictor of serum ferritin level
For further analysis of the predictor of ferritin level, only non-DM subjects were included for excluding confounding factors such as medication, and age and BMI were adjusted in all the analyses. Both in men and women, alanine aminotransferase (ALT), aspartate amino- transferase (AST), hemoglobin level and leukocyte count were significantly associated with serum ferritin level (Table 2). Percent of total body fat (β=0.169 [95%
confidence interval, 0.046–0.292], p=0.007 in men and β=0.200 [0.007–0.393], p=0.042 in women) and serum triglyceride level (β=0.196 [0.148–0.243], p<0.001 in men and β=0.084 [0.039–0.129], p<0.001 in women) were also positively correlated with ferritin level. In men, ferritin level was significantly associated with HOMA-IR (β=0.188 [0.127–0.249], p<0.001) but not with HOMA-B (p= 0.498). By contrast, in the case of women, the statistically significant association between HOMA-IR and ferritin level was lost after adjusting age and BMI (Table 2): multiple linear regression analysis with age, BMI and ferritin level showed that HOMA-IR was determined by age (β=–0.001 [–0.001–0.000], p=0.009) and BMI (β=1.274 [1.191–
1.358], p<0.001) but not by ferritin level (p=0.138).
Among dietary component, total daily energy intake or the amount of daily protein, fat or iron intake was not associated with serum ferritin level both in men and women (Table 2). In men, the amount of carbohydrate intake was negatively associated with ferritin level (β=
–0.125 [–0.198 – –0.053], p<0.001).
3. The association between insulin resistance and serum ferritin level in men
To clarify the association between insulin resistance and ferritin level in men, we performed the further analysis adjusting variables which might affect both insulin resistance and ferritin. Multivariate linear regression analysis showed that ferritin level, BMI, ALT and
triglyceride were significantly associated with HOMA-IR (Table 3). In men, ferritin level was independently associated with HOMA-IR in the entire model analyzed (p<0.05; Table 3).
DISCUSSION
We extensively assessed the associated factors of serum ferritin level including lipid profile, liver function, hemo- globin, inflammatory marker, body composition and dietary information and confirmed the results of the previous studies: serum ferritin level was significantly associated with triglyceride, body fat content, AST and ALT level, and leukocyte count as well as hemoglobin level.
Interestingly, in men, ferritin level was significantly corre- lated with insulin resistance even after adjusting body fat, inflammatory markers, ALT level or lipid concentration.
Many previous studies suggested that the association between ferritin and insulin resistance is mediated by body fat content,17 systemic inflammation6 or nonalcoholic fatty liver disease.24 However, our study suggested that elevated ferritin level might be an independent risk factor of insulin resistance aside from the mediators suggested in previous studies. Reduction of iron stores by blood donation or phlebotomy have been reported to improve insulin sensitivity,25,26 which also supports that iron overload might be a primary cause of insulin resistance.
The molecular mechanism that ferritin induces insulin resistance has not been clearly defined yet. However, recent reports showed that iron status influences insulin signaling and glucose uptake in the liver27 and adipose tissue.28 Iron overloading decreased insulin signaling evaluated by the phospho-Akt/Akt ratio and up-regulated adipokines favoring insulin resistance such as resistin,28 which can explain the independent association between ferritin level and insulin resistance in our study.
We also found the significant difference in ferritin level between the subjects with or without DM. Our study showed that the elevated ferritin level might increase the risk of DM via increased insulin resistance rather than beta cell dysfunction, which was corresponded to previous study.5 Iron rather increases beta cell mass and improves beta cell function.25,29
In the case of women, the statistically significant association between insulin resistance and ferritin level was lost after adjusting age and BMI as previous reports.5,30 Multivariate analysis showed that HOMA-IR in women was determined by age and BMI but not by ferritin level.
Such a weak correlation between insulin resistance and ferritin level in women might be resulted from that there are more confounding factors in serum ferritin level in women compared to men and menstrual iron loss might be one of most important confounders.31 Significantly lower serum level of ferritin in women compared to men in our study might be caused by the menstrual iron loss in women.
Interestingly, there was no association between the amount of iron intake and ferritin level in KNHANES.
Heme-iron intake was known to be independently associated with insulin resistance,14 and very recently, only heme-iron from red meat was reported to be associated with greater risk of metabolic syndrome and cardiovascular disease and heme-iron from other sources was not.32 Although we did not differentiate the iron source according to heme-containing, monovariate analysis in our study showed that protein intake rather than iron intake was significantly associated with ferritin level in men, which also supports that the amount of red meat intake might be more important than the amount of total iron intake in ferritin level or insulin resistance. In men, the amount of carbohydrate intake showed a significant negative correlation with ferritin level. Although we cannot explain the exact cause of the association, non-carbohydrate source of energy intake, such as red meat, might positively affect ferritin level.
The limitation of our study was we did not consider menopausal state in women. And relative wide range of hemoglobin level for study inclusion might also play a confounding factor for analysis on ferritin level. However, we excluded the subjects with hemoglobin less than 10 g/dL and performed analysis after adjusting hemoglobin
level to minimize the effect of anemia. We analyzed large-sized national surveys in Korea and extensively assessed the associated factors of serum ferritin level including lipid profile, liver function, hemoglobin, infla- mmatory marker, body composition and dietary infor- mation. Furthermore, we excluded the subjects with DM in the analysis on the associated factors of ferritin level, which can reduce the probability of confounders in the association between insulin resistance and ferritin level.
In conclusion, elevated serum ferritin was a risk factor of DM via increasing insulin resistance rather than affecting beta cell function in the Korean population. Serum ferritin level was an independent determining factor of insulin resistance even after adjusting body fat or systemic inflammation in men.
REFERENCES
1. Haidari M, Javadi E, Sanati A, Hajilooi M, Ghanbili J.
Association of increased ferritin with premature coronary stenosis in men. Clin Chem 2001;47:1666-1672.
2. Williams MJ, Poulton R, Williams S. Relationship of serum ferritin with cardiovascular risk factors and inflammation in young men and women. Atherosclerosis 2002;165:179-184.
3. Piperno A, Trombini P, Gelosa M, Mauri V, Pecci V, Vergani A, et al. Increased serum ferritin is common in men with essential hypertension. J Hypertens 2002;20:
1513-1518.
4. Ford ES, Cogswell ME. Diabetes and serum ferritin concentration among U.S. adults. Diabetes Care 1999;
22:1978-1983.
5. Kim CH, Kim HK, Bae SJ, Park JY, Lee KU. Association of elevated serum ferritin concentration with insulin resistance and impaired glucose metabolism in Korean men and women. Metabolism 2011;60:414-420.
6. Jiang R, Manson JE, Meigs JB, Ma J, Rifai N, Hu FB. Body iron stores in relation to risk of type 2 diabetes in apparently healthy women. JAMA 2004;291:711-717.
7. de Jager J, Dekker JM, Kooy A, Kostense PJ, Nijpels G, Heine RJ, et al. Endothelial dysfunction and low-grade
inflammation explain much of the excess cardiovascular mortality in individuals with type 2 diabetes: the Hoorn Study. Arterioscler Thromb Vasc Biol 2006;26:1086- 1093.
8. Bastard JP, Maachi M, Lagathu C, Kim MJ, Caron M, Vidal H, et al. Recent advances in the relationship between obesity, inflammation, and insulin resistance.
Eur Cytokine Netw 2006;17:4-12.
9. Park SK, Ryoo JH, Kim MG, Shin JY. Association of serum ferritin and the development of metabolic syndrome in middle-aged Korean men: a 5-year follow-up study.
Diabetes Care 2012;35:2521-2526.
10. Fernández-Real JM, Ricart-Engel W, Arroyo E, Balançá R, Casamitjana-Abella R, Cabrero D, et al. Serum ferritin as a component of the insulin resistance syndrome.
Diabetes Care 1998;21:62-68.
11. Alexander CM. The coming of age of the metabolic syndrome. Diabetes Care 2003;26:3180-3181.
12. Mlinar B, Marc J, Janez A, Pfeifer M. Molecular mecha- nisms of insulin resistance and associated diseases. Clin Chim Acta 2007;375:20-35.
13. Cook JD, Flowers CH, Skikne BS. The quantitative assessment of body iron. Blood 2003;101:3359-3364.
14. Shi Z, Zhou M, Yuan B, Qi L, Dai Y, Luo Y, et al. Iron intake and body iron stores, anaemia and risk of hyperglycaemia among Chinese adults: the prospective Jiangsu Nutrition Study (JIN). Public Health Nutr 2010;13:1319-1327.
15. Igaki N, Takashima M, Ohyama M, Oh S, Kida A, Yanase K, et al. The beneficial effect of effective control of anemia on hyperinsulinemia and hypoxemia in a hemodialysis patient with corrected transposition of the great arteries. Clin Exp Nephrol 2004;8:163-167.
16. Shi Z, Hu X, Yuan B, Hu G, Pan X, Holmboe-Ottesen G. Coexistence of anaemia and the metabolic syndrome in adults in Jiangsu, China. Asia Pac J Clin Nutr 2008;17:
505-513.
17. Gillum RF. Association of serum ferritin and indices of body fat distribution and obesity in Mexican American men--the Third National Health and Nutrition Examination Survey. Int J Obes Relat Metab Disord 2001;25:639-645.
18. Brogan D. Software for sample survey data, misuse of standard packages. In: Armitage P, Colton T, editors.
Encyclopedia of biostatistics. New York (NY): John Wiley and Sons, Inc.; 1998.
19. Lim S, Shin H, Song JH, Kwak SH, Kang SM, Yoon JW, et al. Increasing prevalence of metabolic syndrome in Korea: the Korean National Health and Nutrition Examination Survey for 1998-2007. Diabetes Care 2011;
34:1323-1328.
20. Choi YJ, Kim HC, Kim HM, Park SW, Kim J, Kim DJ.
Prevalence and management of diabetes in Korean adults: Korea National Health and Nutrition Examination Surveys 1998-2005. Diabetes Care 2009;32:2016-2020.
21. Wallace TM, Levy JC, Matthews DR. Use and abuse of HOMA modeling. Diabetes Care 2004;27:1487-1495.
22. Grundy SM, Cleeman JI, Daniels SR, Donato KA, Eckel RH, Franklin BA, et al. Diagnosis and management of the metabolic syndrome: an American Heart Association/
National Heart, Lung, and Blood Institute Scientific Statement. Circulation 2005;112:2735-2752.
23. Ministry of Health and Welfare, Korea Centers for Disease Control and Prevention. Korea Health Statistics 2010 : Korea National Health and Nutrition Examination Survey (KNHANES V-1). Cheongwon: Korea Centers for Disease Control and Prevention; 2011.
24. Brudevold R, Hole T, Hammerstrøm J. Hyperferritinemia is associated with insulin resistance and fatty liver in patients without iron overload. PLoS One 2008;3:e3547.
25. Fernández-Real JM, Peñarroja G, Castro A, García- Bragado F, Hernández-Aguado I, Ricart W. Blood letting in high-ferritin type 2 diabetes: effects on insulin sensi- tivity and beta-cell function. Diabetes 2002;51:1000- 1004.
26. Valenti L, Fracanzani AL, Dongiovanni P, Bugianesi E, Marchesini G, Manzini P, et al. Iron depletion by phlebotomy improves insulin resistance in patients with nonalcoholic fatty liver disease and hyperferritinemia:
evidence from a case-control study. Am J Gastroenterol 2007;102:1251-1258.
27. Fargion S, Dongiovanni P, Guzzo A, Colombo S, Valenti L, Fracanzani AL. Iron and insulin resistance. Aliment Pharmacol Ther 2005;22 Suppl 2:61-63.
28. Dongiovanni P, Ruscica M, Rametta R, Recalcati S, Steffani L, Gatti S, et al. Dietary iron overload induces visceral adipose tissue insulin resistance. Am J Pathol 2013;182:2254-2263.
29. Rahier J, Loozen S, Goebbels RM, Abrahem M. The haemochromatotic human pancreas: a quantitative immunohistochemical and ultrastructural study. Diabe- tologia 1987;30:5-12.
30. Pham NM, Nanri A, Yi S, Kurotani K, Akter S, Foo LH, et al. Serum ferritin is associated with markers of insulin resistance in Japanese men but not in women. Meta- bolism 2013;62:561-567.
31. Rushton DH, Dover R, Sainsbury AW, Norris MJ, Gilkes JJ, Ramsay ID. Why should women have lower reference limits for haemoglobin and ferritin concentrations than men? BMJ 2001;322:1355-1357.
32. de Oliveira Otto MC, Alonso A, Lee DH, Delclos GL, Bertoni AG, Jiang R, et al. Dietary intakes of zinc and heme iron from red meat, but not from other sources, are associated with greater risk of metabolic syndrome and cardiovascular disease. J Nutr 2012;142:526-533.