Received: July 30, 2015 Revised: August 23, 2015 Accepted: September 16, 2015
Corresponding Author: Yangho Kim, Department of Occupational and Environmental Medicine, Ulsan University Hospital, University of Ulsan College of Medicine, 877 Bangeojinsunhwan-doro, Dong-gu, Ulsan 682-714, Korea
Tel: +82-10-2294-5973, Fax: +82-52-250-7289, E-mail: [email protected]
Associations of Low Bone Mass with High Serum Ferritin in the Korean General Female Population: Analysis of 2008–2010 Korean National Health and
Nutrition Examination Survey Data
Byung-Kook Lee
1, Yangho Kim
21
Department of Preventive Medicine, College of Medicine, Soonchunhyang University, Asan,
2
Department of Occupational and Environmental Medicine, Ulsan University Hospital, University of Ulsan College of Medicine, Ulsan, Korea
Objectives: The present study was performed to evaluate the association between serum ferritin concentrations and bone mineral density (BMD) in a representative Korean general population.
Methods: This was a cross-sectional study based on data obtained in the Korean National Health and Nutrition Examination Survey (2008~2010). The present cross-sectional analysis was restricted to participants
≥20 years of age who completed the health examination survey and BMD measurement (n=15,538).
Results: In multiple linear regression analysis of log
2-transformed serum ferritin as a continuous variable on BMD, the differences in BMD levels associated with doubling of serum ferritin were -0.0022~-0.0057 in a large representative sample of South Korean women, but not in men. In this large representative sample of South Korean women, elevated serum ferritin level was consistently associated with the prevalence of low bone mass for chronological age. However, there were no significant associations of ferritin level and low bone mass in men.
Conclusion: An association of elevated ferritin level with lower BMD level was observed in the general female population. Thus, our results have substantial public health implications.
Key Words: Bone mineral density, Ferritin, Iron, Bone mass
Osteoporosis has become a global issue and a health threat according to the World Health Organization.
1Over the past several years, there has been considerable progression in studies of iron overload and osteo- porosis.
2Iron is an essential nutrient with crucial biolo- gical functions, including basic roles in hemoglobin and the immune response. Iron is also a catalyst for the formation of hydroxyl radicals, which are powerful prooxidants that attack cellular membrane lipids, proteins, and nucleic acids, resulting in tissue damage.
3,4Hence, increasing iron stores to levels beyond the tolerable
threshold of cells can contribute to various types of
pathology. The liver, pancreas, heart, and other endo-
crine organs are frequently damaged in iron-overload
states, such as hemochromatosis and recurrent trans-
fusions in diseases such as thalassemia.
5,6In vitro
studies have shown that iron inhibits the differentiation,
proliferation, and activity of osteoblasts,
7,8whereas it
promotes osteoclast activity by enhancing mitochondrial
biogenesis.
9In a murine model, iron overload resulted
in increased oxidative stress and bone resorption, leading
to changes in bone microarchitecture and material
properties, finally resulting in bone loss.
10Osteoporosis occurs in a variety of clinical conditions associated with iron overload, including hemochromatosis,
11African hemosiderosis,
12thalassemia,
13sickle cell disease,
14and liver diseases,
15suggesting that iron overload is a common mechanism responsible for bone loss. How- ever, there have been few epidemiological studies relating iron stores to bone loss, especially in a general population.
16We performed a cross-sectional study to evaluate the association between serum ferritin concen- trations and bone mineral density (BMD) in a repre- sentative Korean general population.
MATERIALS AND METHODS
1. Design and data collection
This study used data obtained in the Korea National Health and Nutrition Examination Survey (KNHANES) for 2008~2010, representing the second and third years of KNHANES IV (2007~2009) and the first year of KNHANES V (2010~2012). KNHANES is conducted annually, using a rolling sampling design that involves a complex, stratified, multistage, probability-cluster survey of a representative sample of the non-institu- tionalized civilian population in South Korea. Detailed information regarding the design of the survey was provided previously.
17Briefly, the survey consisted of three components: a health interview survey, a health examination survey, and a nutrition survey. The present cross-sectional analysis was restricted to participants ≥ 20 years of age who completed the health examination survey and BMD measurement (n=15538). Information on age, education, smoking history, and alcohol intake was collected during the health interview. Height and weight measurements were performed with the parti- cipants wearing light clothing and no shoes. Body mass index (BMI) was calculated as weight in kilograms divided by the square of the height in meters. Obesity was categorized into three groups: lean (BMI<18.5), normal (18.5≤BMI<25), and obese (BMI≥25). Age,
as reported at the time of the health interview, was categorized into six groups (20~29, 30~39, 40~49, 50~59, 60~69, and ≥70 years). Education level was categorized into three groups: below high school, high school, and college or higher. Smoking status was divided into three categories based on self-reported cigarette use: current smoker, past smoker, and never-smoker. Never-smokers had smoked <100 cigarettes in their lifetime, and participants who smoked
≥100 cigarettes were classified as past or current smokers based on current use. Alcohol consumption was assessed by asking the participants about their drinking behavior during the month prior to the interview. The participants were asked about their average frequency (days per month) of alcoholic beverage consumption and amount (in mL) of alcoholic beverages ingested on a single occasion. The responses were converted into the amount of pure alcohol (in g) consumed per day. Alcohol consumption status was categorized into four groups according to average daily alcohol consumption: nondrinker, light drinker (1~15 g), moderate drinker (16~30 g), and heavy drinker (>30 g). Regular walking was defined as indoor or outdoor walking for ≥30 min at a time at least three times per week. Regular exercise was defined as participating in moderate exercise (slow swimming, doubles tennis, volleyball, or occupational or recreational activity invol- ving carrying light objects) on a regular basis for ≥30 min at a time at least three times per week, or partici- pating in vigorous exercise (running, climbing, fast cycling, fast swimming, football, basketball, rope jum- ping, squash, singles tennis, or occupational or recrea- tional activity involving carrying heavy objects) ≥20 min at a time at least once per week.
2. Measurement of BMD
BMD was measured in the lumbar spine, five regions
of the femur (femoral neck, trochanter, intertrochanter,
Ward’s triangle, and the total femur), and in the whole
body by dual-energy X-ray absorptiometry using a
DISCOVERY-W fan-beam densitometer (Hologic, Bedford, MA) at the mobile health examination site.
Pregnant women and subjects who had undergone contrast-agent-based examination within a week of the survey were excluded. Subjects were also excluded if their reported weight exceeded the weight and height limits of the DXA scan table (136 kg and 196 cm, respectively). BMD was classified into two categories;
normal (Z-score >=-1.0) and low bone mass (Z-score
<-1.0) based on Z-score of BMD calculated chrono- logically according to 6 age groups in any of total femur, femur neck, or lumbar spine.
3. Measurement of serum ferritin
Serum ferritin was measured by an immune radio- metric assay method using a 1470 WIZARD gamma- counter (PerkinElmer, Turku, Finland), and blood hemoglobin was measured with an XE-2100D (Sysmex, Tokyo, Japan).
To assess the association with BMD, serum ferritin was categorized into quartile (Q) levels: 1st Q (serum ferritin <18.09μg/L for women, <64.31μg/L for Men), 2nd Q (serum ferritin 18.09~35.96μg/L for women and 64.31~98.05 for men), 3rd Q (serum ferritin 35.97~
60.93μg/L for women and 98.06~149.21 for men), and 4th Q (serum ferritin>60.93μg/L for women and >
149.21 for men).
4. Statistical analysis
Statistical analyses were performed using SAS software (ver. 9.3; SAS Institute, Cary, NC) and SUDAAN (Release 10.0; Research Triangle Institute, Research Triangle Park, NC), a software package that incor- porates sample weights and adjusts analyses for the complex sample design of the survey. Survey sample weights were used in all analyses to produce estimates that were representative of the non-institutionalized civilian Korean population.
To compare the means of the levels of serum ferritin and BMDs of the total femur, femur neck, and lumbar
spine in different demographic and lifestyle groups while controlling for covariates (age, gender, smoking status, drinking status, and residence area), adjusted means and (standard error; SE) were calculated by analysis of covariance (ANCOVA) calculated by the Proc Regress function.
Multivariate linear regression analyses were then performed to determine the differences (95% CI) in BMDs of total femur, femur neck, and lumbar spine by serum ferritin level after covariate adjustment. Log
2- transformed serum ferritin level as a continuous inde- pendent variable due to its skewed distribution was regressed on three BMD levels, whereas Q of serum ferritin for women and men was used as a categorical independent variable for regression on three BMD levels. Covariates used in the analysis were age, resi- dence area, BMI, smoking & drinking status, education level, regular exercise and walking for men, with addition of menopausal status, hormone treatment, and use of oral contraceptives for women.
Next, using logistic regression analysis, odds ratios (ORs) and 95% CIs for low bone mass for chronolo- gical age by serum ferritin level were then determined according to log
2-transformed serum ferritin (as a conti- nuous variable) and Q of serum ferritin (as a catego- rical variable) after adjusting for the same covariates as in regression analyses.
RESULTS
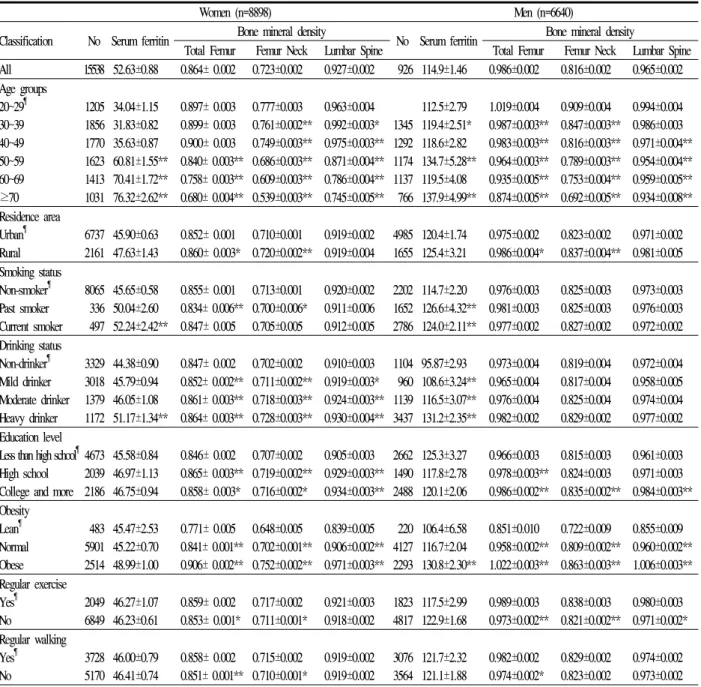
Adjusted means (SE) of serum ferritin and BMDs of total femur, femur neck, and lumbar spine are shown in Table 1.
The adjusted mean (SE) of serum ferritin, BMDs of
total femur, femur neck, and lumbar spine for women
were 52.63 (0.88)μg/L, 0.864 (0.002) g/cm
2, 0.723
(0.002) g/cm
2, and 0.927 (0.002) g/cm
2, respectively,
and those for men were 114.9 (1.46)μg/L, 0.986
(0.002) g/cm
2, 0.816 (0.002) g/cm
2, 0.965 (0.002)
g/cm
2, respectively.
Table 1. Means and standard error of serum ferritin and bone mineral densities of adult population by gender and classification variables after covariate adjustment
Women (n=8898) Men (n=6640)
Classification No Serum ferritin Bone mineral density
No Serum ferritin Bone mineral density
Total Femur Femur Neck Lumbar Spine Total Femur Femur Neck Lumbar Spine All 15538 52.63±0.88 0.864± 0.002 0.723±0.002 0.927±0.002 926 114.9±1.46 0.986±0.002 0.816±0.002 0.965±0.002 Age groups
20~29
¶30~39 40~49 50~59 60~69
≥70
1205 1856 1770 1623 1413 1031
34.04±1.15 31.83±0.82 35.63±0.87 60.81±1.55**
70.41±1.72**
76.32±2.62**
0.897± 0.003 0.899± 0.003 0.900± 0.003 0.840± 0.003**
0.758± 0.003**
0.680± 0.004**
0.777±0.003 0.761±0.002**
0.749±0.003**
0.686±0.003**
0.609±0.003**
0.539±0.003**
0.963±0.004 0.992±0.003*
0.975±0.003**
0.871±0.004**
0.786±0.004**
0.745±0.005**
1345 1292 1174 1137 766
112.5±2.79 119.4±2.51*
118.6±2.82 134.7±5.28**
119.5±4.08 137.9±4.99**
1.019±0.004 0.987±0.003**
0.983±0.003**
0.964±0.003**
0.935±0.005**
0.874±0.005**
0.909±0.004 0.847±0.003**
0.816±0.003**
0.789±0.003**
0.753±0.004**
0.692±0.005**
0.994±0.004 0.986±0.003 0.971±0.004**
0.954±0.004**
0.959±0.005**
0.934±0.008**
Residence area Urban
¶Rural
6737 2161
45.90±0.63 47.63±1.43
0.852± 0.001 0.860± 0.003*
0.710±0.001 0.720±0.002**
0.919±0.002 0.919±0.004
4985 1655
120.4±1.74 125.4±3.21
0.975±0.002 0.986±0.004*
0.823±0.002 0.837±0.004**
0.971±0.002 0.981±0.005 Smoking status
Non-smoker
¶Past smoker Current smoker
8065 336 497
45.65±0.58 50.04±2.60 52.24±2.42**
0.855± 0.001 0.834± 0.006**
0.847± 0.005
0.713±0.001 0.700±0.006*
0.705±0.005
0.920±0.002 0.911±0.006 0.912±0.005
2202 1652 2786
114.7±2.20 126.6±4.32**
124.0±2.11**
0.976±0.003 0.981±0.003 0.977±0.002
0.825±0.003 0.825±0.003 0.827±0.002
0.973±0.003 0.976±0.003 0.972±0.002 Drinking status
Non-drinker
¶Mild drinker Moderate drinker Heavy drinker
3329 3018 1379 1172
44.38±0.90 45.79±0.94 46.05±1.08 51.17±1.34**
0.847± 0.002 0.852± 0.002**
0.861± 0.003**
0.864± 0.003**
0.702±0.002 0.711±0.002**
0.718±0.003**
0.728±0.003**
0.910±0.003 0.919±0.003*
0.924±0.003**
0.930±0.004**
1104 960 1139 3437
95.87±2.93 108.6±3.24**
116.5±3.07**
131.2±2.35**
0.973±0.004 0.965±0.004 0.976±0.004 0.982±0.002
0.819±0.004 0.817±0.004 0.825±0.004 0.829±0.002
0.972±0.004 0.958±0.005 0.974±0.004 0.977±0.002 Education level
Less than high school
¶High school College and more
4673 2039 2186
45.58±0.84 46.97±1.13 46.75±0.94
0.846± 0.002 0.865± 0.003**
0.858± 0.003*
0.707±0.002 0.719±0.002**
0.716±0.002*
0.905±0.003 0.929±0.003**
0.934±0.003**
2662 1490 2488
125.3±3.27 117.8±2.78 120.1±2.06
0.966±0.003 0.978±0.003**
0.986±0.002**
0.815±0.003 0.824±0.003 0.835±0.002**
0.961±0.003 0.971±0.003 0.984±0.003**
Obesity Lean
¶Normal Obese
483 5901 2514
45.47±2.53 45.22±0.70 48.99±1.00
0.771± 0.005 0.841± 0.001**
0.906± 0.002**
0.648±0.005 0.702±0.001**
0.752±0.002**
0.839±0.005 0.906±0.002**
0.971±0.003**
220 4127 2293
106.4±6.58 116.7±2.04 130.8±2.30**
0.851±0.010 0.958±0.002**
1.022±0.003**
0.722±0.009 0.809±0.002**
0.863±0.003**
0.855±0.009 0.960±0.002**
1.006±0.003**
Regular exercise Yes
¶No
2049 6849
46.27±1.07 46.23±0.61
0.859± 0.002 0.853± 0.001*
0.717±0.002 0.711±0.001*
0.921±0.003 0.918±0.002
1823 4817
117.5±2.99 122.9±1.68
0.989±0.003 0.973±0.002**
0.838±0.003 0.821±0.002**
0.980±0.003 0.971±0.002*
Regular walking Yes
¶No
3728 5170
46.00±0.79 46.41±0.74
0.858± 0.002 0.851± 0.001**
0.715±0.002 0.710±0.001*
0.919±0.002 0.919±0.002
3076 3564
121.7±2.32 121.1±1.88
0.982±0.002 0.974±0.002*
0.829±0.002 0.823±0.002
0.974±0.002 0.973±0.002
#
Covariates: age, residence area, smoking status, drinking status, educational level, obesity, regular exercise and walking
¶: Reference *: P<0.05, **: P<0.01
The means of serum ferritin in the old age group (>
50 years) were significantly higher, as compared to the young age group in women, but the differences were not apparent in men. On the other hand, the BMDs of three areas decreased according to age, and were more significant in those of the total femur and femur neck, as compared to the lumbar spine.
While the BMDs of total femur and femur neck of women and men who were rural residents were significantly higher than those for urban residents, there were no differences in serum ferritin and BMD of lumbar spine between residents of both areas, for both genders.
The means of non-smokers were significantly lower
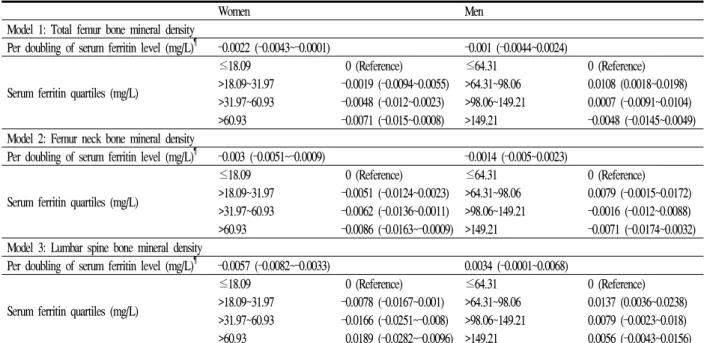
Table 2. Differences (95% CI) in bone mineral densities of total femur, femur neck, and lumbar spine by serum ferritin level after covariate adjustmentª
Women Men
Model 1: Total femur bone mineral density
Per doubling of serum ferritin level (mg/L)
¶–0.0022 (–0.0043~–0.0001) –0.001 (–0.0044~0.0024)
Serum ferritin quartiles (mg/L)
≤18.09
>18.09~31.97
>31.97~60.93
>60.93
0 (Reference) –0.0019 (–0.0094~0.0055) –0.0048 (–0.012~0.0023) –0.0071 (–0.015~0.0008)
≤64.31
>64.31~98.06
>98.06~149.21
>149.21
0 (Reference) 0.0108 (0.0018~0.0198) 0.0007 (–0.0091~0.0104) –0.0048 (–0.0145~0.0049) Model 2: Femur neck bone mineral density
Per doubling of serum ferritin level (mg/L)
¶–0.003 (–0.0051~–0.0009) –0.0014 (–0.005~0.0023)
Serum ferritin quartiles (mg/L)
≤18.09
>18.09~31.97
>31.97~60.93
>60.93
0 (Reference) –0.0051 (–0.0124~0.0023) –0.0062 (–0.0136~0.0011) –0.0086 (–0.0163~–0.0009)
≤64.31
>64.31~98.06
>98.06~149.21
>149.21
0 (Reference) 0.0079 (–0.0015~0.0172) –0.0016 (–0.012~0.0088) –0.0071 (–0.0174~0.0032) Model 3: Lumbar spine bone mineral density
Per doubling of serum ferritin level (mg/L)
¶–0.0057 (–0.0082~–0.0033) 0.0034 (–0.0001~0.0068)
Serum ferritin quartiles (mg/L)
≤18.09
>18.09~31.97
>31.97~60.93
>60.93
0 (Reference) –0.0078 (–0.0167~0.001) –0.0166 (–0.0251~–0.008) 0.0189 (–0.0282~–0.0096)
≤64.31
>64.31~98.06
>98.06~149.21
>149.21
0 (Reference) 0.0137 (0.0036~0.0238) 0.0079 (–0.0023~0.018) 0.0056 (–0.0043~0.0156) ª: Adjusted for age, residence area, body mass index, smoking & drinking status, education level, regular exercise & walking for men with the addition of menopausal status, hormone treatment, and use of oral contraceptives for women.
: Mean differences in bone mineral densities of total femur, femur neck, and lumbar spine with doubling of the blood ferritin level.
than current smokers in women and past & current smokers in men, whereas only the BMDs of total femur and femur neck of female past smokers were significantly lower than those of female non-smokers, and there were no differences in BMD of the three regions among male smoking status groups.
While the mean BMDs of non-drinkers were signifi- cantly lower than for heavy drinkers in women and mild, moderate, & heavy drinkers in men, the BMDs of the three regions in non-drinkers were significantly lower than those of drinkers in women, but not in men.
Education level was a significant predictor for BMDs of the three regions, but not for serum ferritin in women and men. On the other hand, obesity was a significant predictor for BMDs of three regions in both genders, but was a significant predictor for serum ferritin only in men.
Regular exercise was a more significant predictor for BMDs of the three regions in both genders, as compared to regular walking, but regular exercise and
walking were not significant predictors for serum ferritin.
Multivariate linear regression analyses were then performed to calculate the mean differences in BMDs of total femur, femur neck, and lumbar spine by serum ferritin and to determine the significance of serum ferritin as a predictor of BMD after adjusting for age, BMI, residence area, education level, smoking &
drinking status, and regular exercise and walking for men, with addition of menopausal status, hormone treatment, and use of oral contraceptives for women (Table 2).
Log
2-transformed serum ferritin as a continuous inde- pendent variable was a significant predictor for BMDs of the three regions (model 1-3) in women but not in men, whereas serum ferritin Q as a categorical independent variable was only a significant predictor for BMDs of femur neck and lumbar spine in women.
Using logistic regression analysis, ORs and 95% CI
values for low bone mass for chronological age were
Table 3. Odd ratios (95% CI) for low bone mass for chronological age by serum ferritin level in adult population after covariate adjustmentª
Women Men
Per doubling of serum ferritin level (mg/L)
¶1.082 (1.017~1.1504) 1.010 (0.933~1.0942)
Serum ferritin quartiles (mg/L)
≤18.09
>18.09~31.97
>31.97~60.93
> 60.93
1 (Reference) 1.002 (0.815~1.231) 1.203 (0.984~1.471) 1.267 (1.006~1.596)
≤64.31
>64.31~98.06
>98.06~149.21
>149.21
1 (Reference) 0.858 (0.698~1.054) 0.991 (0.793~1.237) 1.170 (0.952~1.439) ª: Adjusted for age, residence area, body mass index, smoking & drinking status, education level, regular exercise & walking for men with the addition of menopausal status, hormone treatment, and use of oral contraceptives for women.