http://e-nrp.org
The association of dietary quality and food group intake patterns with bone health status among Korean postmenopausal women: a study using the 2010 Korean National Health and Nutrition Examination Survey Data
Gyeongah Go
1, Zuunnast Tserendejid
2, Youngsook Lim
1, Soyeon Jung
3, Younghee Min
4and Haeryun Park
1§1Department of Food and Nutrition, Myongji University, 116, Myongji-ro, Cheoin-gu, Yongin, Gyeonggi 449-728, Korea
2Mongolia Center for Improvement of Nutrition (MIN), Ulaanbaatar-13, Mongolia
3Yongin Center for Children’s Foodservice Management, Gyeonggi 449-704, Korea
4Public Health Promotion Division, Gyeonggi Province, 1, Maesanno 3-ga, Paldal-gu, Suwon, Gyeonggi 442-781, Korea
BACKGROUND/OBJECTIVES: Osteoporosis and osteoporosis-related disease are drawing a lot of attention in Korea as one of the serious health problems. Bone health status may be influenced by the general dietary quality and dietary pattern.
SUBJECTS/METHODS: To determine the relationship between dietary quality and intake patterns and bone health status, the
%RNI, NAR, DDS, and food group intake patterns were assessed according to their bone health status for 847 postmenopausal women using the 2010 KNHANES data after eliminating those of likely changing their diet under the advice of doctors or those taking estrogen.
RESULTS: Bone health became worse as dietary quality deteriorated. All NAR and %RNI values were highly associated with bone health levels and the consumption frequency of Ca sources, DDS and the food group intake patterns also confirmed the findings.
CONCLUSIONS: This study confirmed that dietary quality and dietary patterns were important for bone health. Nutritional education on eating foods from the five basic food groups has to be emphasized to prevent osteoporosis among older women.
Nutrition Research and Practice 2014;8(6):662-669; doi:10.4162/nrp.2014.8.6.662; pISSN 1976-1457 eISSN 2005-6168
Keywords: Dietary quality and intake patterns, bone health, KNHANES, postmenopausal Korean women
INTRODUCTION
8)Korea is a country undergoing rapid demographic transition.
Korea will be considered an aged society by 2020, and the proportion of people over 65 will be 24.3% in 2030, mainly due to improved economic status and medical services [1]. Currently the approximate proportion of postmenopausal women over the age of 50 is approximately 26% of the female population and is expected to increase consistently every year as life expectancy increases [2].
Osteoporosis is a global health problem with the accelerating growth of the elderly population, and it was estimated that 52 million people suffered from low bone density, osteoporosis or osteopenia in 2010 in the USA [3].
The possibility of suffering from a bone fracture during one’s lifetime was estimated to be approximately 40% in USA [4].
Although the prevalence of osteoporosis among Oriental women compared to American women has been reported to
be lower in some studies, it is still necessary to increase public health awareness of risk factors for osteoporosis. Laundedale reported that the female fracture ratio relative to Whites was 30.1 for Chinese, 73.2 for Japanese, and 52.8 for Korean women [5].
In Korea, although there is no nationwide statistical data on the prevalence of osteoporosis or bone fracture related to lower bone density, significant osteoporosis and osteoporosis-related diseases are drawing a great deal of attention as serious public health problems.
Menopause itself is not a disease but it is strongly associated with certain chronic diseases such as osteoporosis and/or cardiovascular diseases. It is believed that, among genetic factors, the female hormone, estrogen is the most affective one [6], determining up to 80% of peak bone mass in conjunction with environmental factors such as physical activity, medicine, smoking, being underweight, ovariotomy, alcohol drinking and nutrition, etc [7].
This work was supported by the 2013 research fund of Myongji University in Korea
§Corresponding Author: Haeryun Park, Tel. 82-31-330-6204, Fax. 82-31-335-7248, Email. [email protected] Received: April 3, 2014, Revised: June 21, 2014, Accepted: August 1, 2014
This is an Open Access article distributed under the terms of the Creative Commons Attribution Non-Commercial License (http://creativecommons.org/licenses/by-nc/3.0/) which permits unrestricted non-commercial use, distribution, and reproduction in any medium, provided the original work is properly cited.
To maintain health and improve quality of life after menopause, lifestyle changes [8] and maintenance of a healthy dietary pattern that leads to optimal dietary quality are recommended [6]. Reduced dietary quality after menopause may be the cause of many other health problems and could make the postmenopausal syndrome worse [9]. The dietary quality of the post menopausal women is not only associated with low intake of Ca but also with the intake of other bone-formation related nutrients such as protein, vitamin D, vitamin C, sodium and phosphorus [7,10].
Intake of a balanced and optimal amount of minerals in accordance with the recommended dietary intakes is important because minerals have important roles in protein metabolism and are related to bone formation and collagen synthesis [11].
Low Ca intake in particular is believed to be associated with poor bone growth and maintenance and acts as a risk factor for bone fracture and osteoporosis [12-17]. The low diet quality of elderly people is caused by reduced food intake due to changes in taste, low appetite, problematic digestion, medica- tion, and reduced physical activity, which result in deficient intake of minor nutrients and could be developed into osteoporosis [18].
The 2010 KNHANES reported that the Ca intake level of Korean adults is approximately 74% of the KDRI and the proportion of the population whose Ca intake is under the estimated average requirement was 65.9% [19]. As a matter of fact, increasing the Ca intake among the Korean population is the main focus of nutrition intervention programs on various public nutrition policies along with decreased sodium intake.
Recent bone-health-related studies in Korea have focused on Ca and P intakes [20] or Dietary pattern grouped as traditional, dairy, and Western [21], but the relationship between the whole dietary pattern and quality and bone health status is not well understood in postmenopausal Korean women those of not likely changing their diet under the advice of doctors or those taking estrogen. The aim of this study was to examine the relationship between dietary quality and bone health among postmenopausal Korean women and to suggest a nutrition intervention strategy to improve the bone health of postmeno- pausal Korean women.
SUBJECTS AND METHODS
SubjectsTo determine the relationship between dietary quality and bone health among postmenopausal Korean women, the first year data of 8,958 participants from the 5
thKNHANES, which was collected in 2010 [22] was used. Participants who might have recently changed their diet under the advice of doctors due to a diagnosis of low bone density or those taking female hormones whose bone density might be changed by treatments were eliminated.
As the first step, 1,579 post-menopausal women were selected among the 8,958 KNHANES. Second, 394 participants with osteoporosis diagnosed by medical doctors and 272 participants taking female hormones were eliminated. Third, 66 participants who did not completed all three parts (health survey, health examination, and nutrition survey) of the
KNHANES were eliminated.
A total of 847 post-menopausal women were used as the study subjects.
Grouping subjects by bone health status
The final data set of 847 participants was divided into 3 groups, normal, osteopenia, and osteoporosis according to their bone health status. The T-score was calculated using the following formula:
T score = (measured bone density - maximum bone density)/
the maximum standard deviation
The 136 participants with T-score ≥ -1.0 were grouped as normal, 413 participants with -2.5 < T-score < -1.0 were put in the osteopenia, and 298 participants with T-score ≤ -2.5 were categorized as having osteoporosis according to WHO criteria [23].
Anthropometric measurement
The weight and height measurement data from the 847 participants were collected and the BMI (Body Mass Index) value was calculated using the following formula:
BMI = Weight (kg) / Height (m)
2Obese and overweight subjects were defined as those with BMI ≥ 23.0, and low weight was defined as BMI < 18.5 based on the WHO Standard Definition for Obesity.
Dietary intake data analysis
The KNHANES diet survey was composed of food frequency intake data and one-day food intake data collected using the 24-hr dietary recall method. The average amount of certain nutrients intakes was calculated and compared with the KDRI [24].
Dietary quality was assessed using the nutrient adequacy ratio (NAR and MAR), KDRI and the Dietary Diversity Score (DDS).
The NAR of certain nutrients was calculated by comparing the amount of the participant’s nutrient intake with the recomm- ended intake. The maximum score was designated as 1.0 and all scores over 1.0 were considered to be 1.0. The MAR was calculated by averaging each nutrient’s NAR score [25].
The DDS was calculated to determine whether the participants consumed foods from the various five basic food groups, cereal, meat, dairy, vegetable, and fruit daily. When a subject consumed the designated amount of foods from a certain food group one point was given. A maximum of five points was given when one ate the designated amount of foods from all five basic food groups [25,26].
For major Ca source assessment, the nine most important sources of calcium were identified and average weekly consum- ption frequencies of those nine foods were calculated using food frequency data.
The food group intake patterns were analyzed using food
consumption data. The foods eaten by the participants were
classified as Grain, Meat, Dairy, Vegetable, and Fruit; expressed
as GMDVF, and the amount of intake was calculated. To avoid
giving credit for a food group when the amounts consumed
were small, we established a minimum intake level as Kant
suggested. For meat, fruit, and vegetable groups, the minimum
reported amount for inclusion was 30 g for all solid foods
Characteristics Normal Osteopenia Osteoporosis Total P value Age
< 59 100 (29.5)1) 186 (54.5) 56 (16.0) 342 (100.0)
60-69 25 (10.6) 148 (56.2) 85 (33.2) 258 (100.0) .000
70 ≤ 11 (3.2) 79 (32.0) 157 (64.8) 247 (100.0)
Total 136 (16.9) 413 (48.6) 298 (34.6) 847 (100.0)
Attained education level
Elementary school 56 (10.1) 253 (46.1) 256 (43.7) 565 (100.0)
.000
Middle school 32 (29.6) 64 (48.5) 23 (21.9) 119 (100.0)
High school 36 (31.3) 78 (63.2) 11 (5.6) 125 (100.0)
College 12 (36.0) 18 (45.1) 6 (18.9) 36 (100.0)
Total 136 (16.9) 413 (48.8) 296 (34.3) 845 (100.0)
Residence
City 98 (17.0) 291 (48.6) 192 (34.4) 581 (100.0)
.977
Town 38 (16.7) 122 (48.5) 106 (34.8) 266 (100.0)
Total 136 (16.9) 413 (48.6) 298 (34.6) 847 (100.0)
Employment status
employed 63 (20.4) 178 (53.0) 101 (26.6) 342 (100.0)
.001
unemployed 73 (14.5) 235 (45.7) 195 (39.8) 503 (100.0)
Total 136 (16.9) 413 (48.8) 296 (34.3) 845 (100.0)
Household income
Low 30 (10.3) 136 (41.9) 141 (47.7) 307 (100.0)
.000
Mid-Low 31 (15.6) 112 (54.2) 69 (30.1) 212 (100.0)
Mid-High 32 (20.5) 80 (52.0) 44 (27.4) 156 (100.0)
High 42 (27.3) 78 (47.0) 39 (25.7) 159 (100.0)
Total 135 (17.1) 406 (48.2) 293 (34.6) 834 (100.0)
1)Values are number of subjects (%).
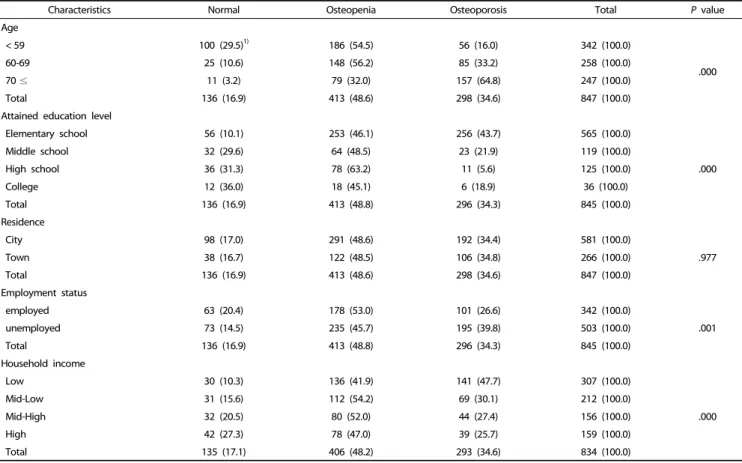
Table 1. General characteristics of the subjects by bone health status
categorized in one group and 60 g for all liquids and mixed dished. For the dairy and grain groups, the minimum amount was 15 g for all solids and 30 g for all liquids and mixed dishes [26].
Statistical analysis
The SPSS 18.0 statistics package was used for the analysis of this study data. Descriptive statistics such as the mean, frequency and proportion were calculated and a Chi-square test was administered to examine the association between categorical variables using a significance level of P < 0.05. For continuous variables, the average and standard error were calculated and the student’s t-test, One way ANOVA test or Logistic regression test was applied to control for the age variable to examine the difference among the three designated groups.
RESULTS
Socio-demographic and anthropometric characteristics of the subjects
Using the survey data, participants’ general characteristics were analyzed, including age, education level attained, employ- ment status, and household income. Subjects were divided into three age groups, under 59 years, 60-69 years, and over 70 years, and into four groups by educational level having completed elementary school, middle school, high school, and college. The subjects were divided into four groups of
household income, with the top 25
thpercentile designated as high, 25-50
thpercentile mid-high, 50-75
thpercentile as mid-low, and under 75
thpercentile as low.
The study participants’ socio-demographic characteristics are reported in table 1. The proportion of osteoporosis among those under 59 was 16.0%, 33.2% among those 60-69 years, and 64.8% among those 70 years old (P < 0.001), showing that age is one of the most important risk factors in bone health.
The proportion of subjects with osteoporosis was the highest (43.7%) among those who graduated from elementary school and lowest among those who graduated from high school (5.6%), showing a trend of increasing prevalence of osteoporosis as the education level attained decreased (P < 0.001).
Additionally, the prevalence rate of osteoporosis was higher among those with relatively lower economic status or who are unemployed (P < 0.001).
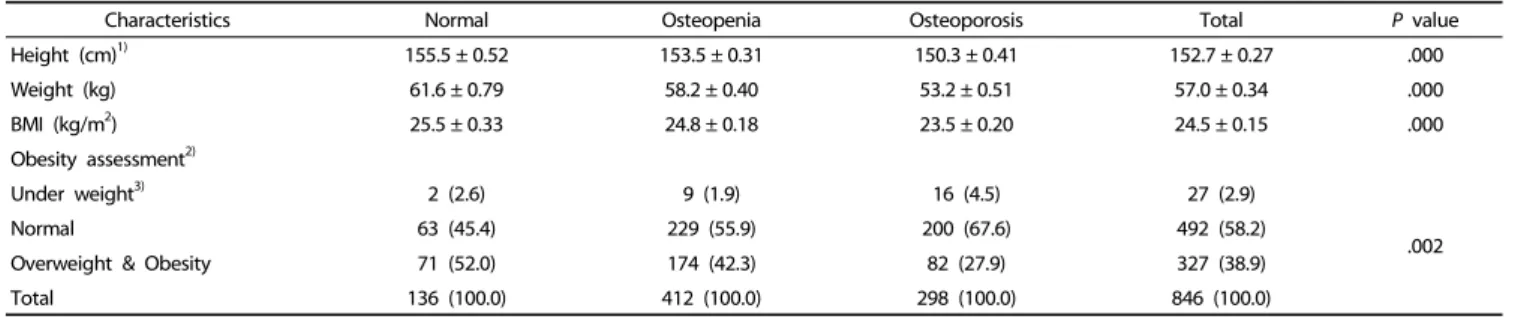
The subjects’ anthropometric characteristics are reported in the table 2 showing statistically significant difference in height, weight and BMI values among the three groups. The average height of the subjects was 155.5 ± 0.5 cm in the normal bone health group, 153.5 ± 0.3 cm in the osteopenia group and 150.3
± 0.4 cm in the osteoporosis group (P < 0.01), The average weight was 61.6 ± 0.8 kg in the normal bone health group, 58.2
± 0.4 kg in the osteopenia group and, 53.2 ± 0.5 kg in the
osteoporosis group (P < 0.001). The BMI value was 25.5 ± 0.33
kg/m
2in the normal bone health group, 24.8 ± 0.2 kg/m
2in
the osteopenia group, and 23.5 ± 0.2 kg/m
2the osteoporosis
Characteristics Normal Osteopenia Osteoporosis Total P value
Height (cm)1) 155.5 ± 0.52 153.5 ± 0.31 150.3 ± 0.41 152.7 ± 0.27 .000
Weight (kg) 61.6 ± 0.79 58.2 ± 0.40 53.2 ± 0.51 57.0 ± 0.34 .000
BMI (kg/m2) 25.5 ± 0.33 24.8 ± 0.18 23.5 ± 0.20 24.5 ± 0.15 .000
Obesity assessment2)
Under weight3) 2 (2.6) 9 (1.9) 16 (4.5) 27 (2.9)
Normal 63 (45.4) 229 (55.9) 200 (67.6) 492 (58.2) .002
Overweight & Obesity 71 (52.0) 174 (42.3) 82 (27.9) 327 (38.9)
Total 136 (100.0) 412 (100.0) 298 (100.0) 846 (100.0)
1)Values are mean ± SE.
2)Values are number of subjects(%).
3)WHO (1997) Standard Definition for Obesity, Obesity Preventing and the Global Epidemic-Report of a WHO Consultation on Obesity Table 2. Anthropometric characteristics of the subjects by bone health status
Normal (n = 136) Osteopenia (n = 413) Osteoporosis (n = 298) Total (n = 847) P value
Energy1) NAR 0.85 ± 0.022) 0.83 ± 0.01 0.82 ± 0.02 0.83 ± 0.01 .384
%RNI 101.3 ± 3.82) 92.6 ± 2.7 92.7 ± 2.9 94.1 ± 2.6 .060
Protein NAR 0.92 ± 0.01 0.88 ± 0.01 0.83 ± 0.02 0.87 ± 0.01 .002
%RNI 141.3 ± 6.5 119.9 ± 4.6 103.9 ± 3.5 118.0 ± 3.1 .000
Vitamin A NAR 0.76 ± 0.03 0.68 ± 0.02 0.63 ± 0.02 0.68 ± 0.02 .002
%RNI 159.7 ± 34.1 116.0 ± 9.2 95.4 ± 6.8 116.2 ± 9.4 .064
Vitamin C NAR 0.79 ± 0.03 0.68 ± 0.02 0.61 ± 0.02 0.67 ± 0.01 .000
%RNI 128.5 ± 10.7 100.2 ± 6.4 82.1 ± 5.1 98.8 ± 4.2 .000
Thiamin NAR 0.81 ± 0.02 0.77 ± 0.02 0.73 ± 0.02 0.76 ± 0.01 .009
%RNI 104.4 ± 5.5 92.1 ± 3.3 86.5 ± 4.4 92.3 ± 2.6 .025
Riboflavin NAR 0.77 ± 0.02 0.66 ± 0.02 0.58 ± 0.02 0.65 ± 0.01 .000
%RNI 100.9 ± 6.5 78.2 ± 3.2 63.6 ± 2.9 77.0 ± 2.5 .000
Niacin NAR 0.84 ± 0.02 0.78 ± 0.02 0.71 ± 0.02 0.77 ± 0.01 .000
%RNI 128.8 ± 7.0 109.2 ± 3.7 95.7 ± 3.8 107.8 ± 3.0 .000
Calcium NAR 0.65 ± 0.03 0.57 ± 0.02 0.51 ± 0.02 0.56 ± 0.01 .000
%RNI 83.1 ± 6.0 64.6 ± 3.1 53.9 ± 2.5 64.0 ± 2.2 .000
Phosphorus NAR 0.96 ± 0.01 0.94 ± 0.01 0.91 ± 0.01 0.93 ± 0.01 .023
%RNI 165.4 ± 7.6 138.8 ± 4.4 126.5 ± 4.2 139.1 ± 3.5 .000
Iron NAR 0.95 ± 0.01 0.90 ± 0.01 0.86 ± 0.02 0.89 ± 0.01 .000
%RNI 208.4 ± 15.8 171.6 ± 9.3 167.0 ± 13.5 176.3 ± 7.5 0.069
MAR 0.83 ± 0.02 0.77 ± 0.01 0.72 ± 0.02 0.76 ± 0.01 .000
1)Standard: % of EER(Estimated Energy Requirements)
2)Values are mean ± SE.
Table 3. Nutrient Adequacy Ratio (NAR) and %RNI of the subjects by bone health status
group (P < 0.001).
Based on BMI value, the proportion of overweight or obese women (23 ≤ BMI) was 52.0% in the normal bone health group, 42.3% in the osteopenia group, and 27.9% in the osteoporosis group. In contrast, the proportion of underweight subjects (BMI
< 18.5) was 2.6% in the normal bone health group, 1.9% in the osteopenia group, and 4.5% in the osteoporosis group (P
< 0.01).
Dietary quality analysis
Nutrient adequacy ratio and percent of Korean RNI
Table 3 shows the NAR and percent of Korean Reference Nutrient Intakes (RNI). Except for the energy intake, the NAR and %RNI of all of nutrients were significantly different among the three groups, and decreased with decreasing bone mineral
density (P < 0.05). Especially in the case of Ca, the average NAR value was 0.56, which was the lowest NAR value of all the DRI indexed nutrients; it was 0.65 in the normal bone health group, 0.57 in the osteopenia group, and 0.51 in the osteoporosis group. The MAR, the average of the NAR values of 10 nutrients was 0.76 for all subjects and showed the same trend as the NAR values, 0.83, 0.77, and 0.72, respectively (P < 0.001).
Compared to the %RNI, the NAR value for each nutrient was lower and showed high inter subject variance in all three groups. Although the average %RNI was over 100% in all three groups, the NAR values were far lower for protein, iron, and phosphorus confirming a large difference in the amount of food consumed among the subjects.
Dietary diversity score (DDS)
The Korean Nutrition Society and the Ministry of Health and
Score Normal (n = 136) Osteopenia (n = 413) Osteoporosis (n = 298) Total (n = 847) P value
1 - 3 (1.0)1) 6 (2.9) 9 (1.5)
.005
2 - 7 (0.9) 4 (1.2) 11 (0.8)
3 14 (10.1) 58 (14.3) 67 (19.1) 139 (15.3)
4 79 (56.9) 234 (56.3) 180 (63.9) 493 (59.0)
5 43 (33.0) 111 (27.5) 41 (12.8) 195 (23.4)
Total 136 (100.0) 413 (100.0) 298 (100.0) 847 (100.0)
Mean ± SD 4.23 ± 0.072) 4.08 ± 0.06 3.82 ± 0.05 4.02 ± 0.03 .000
1)Values are number of subjects (%).
2)Values are mean ± SE.
Table 4. Dietary Diversity Score (DDS) of the subjects by bone health status
Rank Normal (n = 136) Osteopenia (n = 413) Osteoporosis (n = 298) Total (n = 847)
1 GMdVF 73 (53.7)2) GMdVF 216 (53.0) GMdVF 166 (59.5) GMdVF 455 (55.3)
2 GMDVF 43 (33.0) GMDVF 111 (27.5) GmdVF 65 (18.6) GMDVF 195 (23.4)
3 GmdVF 14 (10.1) GmdVF 56 (13.8) GMDVF 41 (12.8) GmdVF 135 (14.9)
4 GmDVF 6 (3.1) GmDVF 18 (3.3) GmDVF 13 (3.7) GmDVF 37 (3.4)
5 - - GMdvf 5 (0.7) Gmdvf 6 (2.9) Gmdvf 9 (1.5)
1)GMDVF: Grain, Meat, Dairy, Vegetable, Fruit: Capital letter indicates eating a certain amount from the food group; lower case letter means not eating a certain amount from the food group.
2)Values are number of subjects (%).
Table 5. Food group intake patterns (GMDVF)1) by bone health status
Rank Food Normal (n = 136) Osteopenia (n = 405) Osteoporosis (n = 275) Total (n = 816) P value P value1)
1 Milk 2.61 ± 0.432) 1.85 ± 0.2 1.30 ± 0.1 1.80 ± 0.1 .001 .026
2 Kimchi 15.5 ± 0.7 14.4 ± 0.4 14.89 ± 0.5 14.75 ± 0.3 .295 .311
3 Anchovy 2.91 ± 0.3 2.71 ± 0.3 1.53 ± 0.1 2.36 ± 0.2 .000 .006
4 Bean-curd 1.60 ± 0.2 1.38 ± 0.1 1.14 ± 0.1 1.34 ± 0.1 .020 .926
5 Radish leaves 2.25 ± 0.4 1.87 ± 0.1 2.05 ± 0.2 2.00 ± 0.1 .612 .446
6 Yoghurt 1.08 ± 0.2 1.05 ± 0.2 0.60 ± 0.1 0.91 ± 0.1 .031 .575
7 Sea mustard 1.23 ± 0.2 0.89 ± 0.1 0.99 ± 0.1 0.98 ± 0.1 .057 .036
8 Egg 2.21 ± 0.2 1.71 ± 0.1 1.39 ± 0.1 1.69 ± 0.1 .003 .588
9 Bean 10.76 ± 1.0 9.59 ± 0.6 8.46 ± 0.6 9.43 ± 0.4 .074 .094
1)Adjusted for age.
2)Frequency per week, values are mean ± SE.
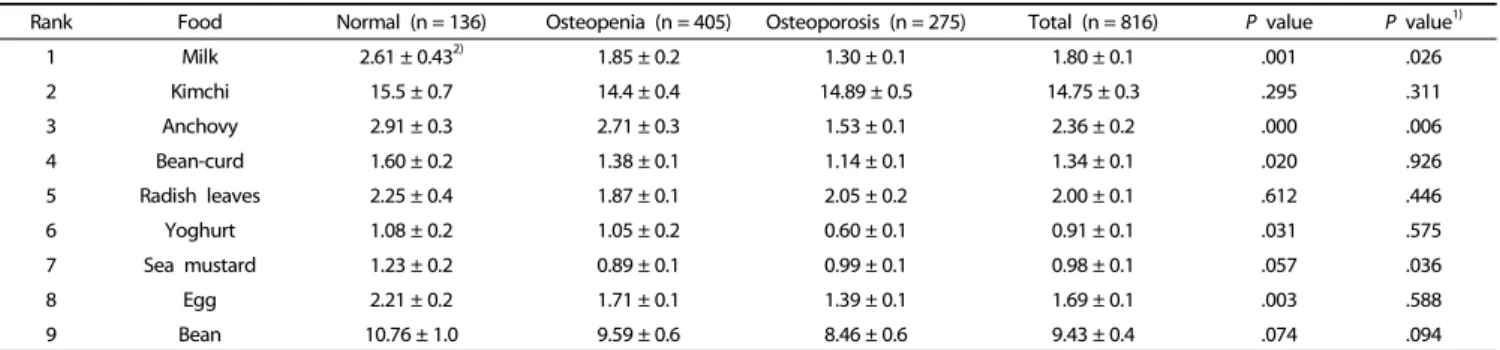
Table 6. Weekly consumption frequencies of major Ca sources by bone health status
Welfare recommends intake of various and certain amount of foods from each of the basic food groups [27]. Table 4 shows the DDS analysis results.
Only 23.4% of the subjects ate a variety of foods from the five basic food groups, resulting in a DDS of 5. The average DDS value of the subjects in designated three bone health groups was 4.0, and 4.23, 4.08, and 3.82, respectively (P < 0.001).
Ratio of intake of all foods from the five basic food groups was 33.0% in the normal bone health group, 27.5% in the osteopenia group, and 12.8% in the osteoporosis group. The percentage of the most inferior diet pattern, eating only foods from one food group was 0.0% in the normal bone health group, 1.0%
in the osteopenia group, and 2.9% in the osteoporosis group, while the percentage of women eating only foods from two food groups was 0.0%, 0.9%, and 1.2%, respectively.
Dietary pattern analysis Food group intake patterns
Table 5 shows the food group intake patterns among three
different groups.
The most frequent dietary pattern, eating foods from cereals, meats and poultries, vegetables, and fruits but not milk or milk products, was exhibited by 55.3% of the subjects, and the second most frequent dietary pattern, eating foods from all five basic food groups, was exhibited by 23.4% of the subjects. The proportion of subjects with vegetarian dietary pattern, which is popular in Korean women, especially the elderly or an economically stressed populations, eating only cereals, vegetables, and fruits was 14.9%. the proportion of those that ate food from four food groups but not meats and poultries was 3.4%, and the proportion of those who ate only cereals was 1.5%.
The proportion of subjects eating all of four food groups
except for milk and milk products was the highest in all three
different bone health groups, specifically 53.7% in the normal
bone health group, 53.0% in the osteopenia, and 59.5% in the
osteoporosis group. The second most frequent dietary pattern
among each of three groups was eating food from all five food
groups in the normal and osteopenia groups but in the
osteoporosis group, a vegetarian eating pattern of not eating
meats and milks was the second most prevalent pattern. Milk and milk products are the best source of Ca, but the proportion of dietary patterns deficient in milk and milk products was 63.8% in the normal, 67.5%, in the osteopenia, and 81.4% in the osteoporosis groups.
Weekly eating frequencies of major Ca sources
Table 6 shows the major Ca sources and weekly consumption frequencies among postmenopausal Korean women grouped according to their bone health status.
The major Ca sources in the usual diet of these postme- nopausal Korean women were milk, Kimchi, dried anchovy, bean curd(tofu), radish leaves, yoghurt, sea mustard, egg, green onion, and beans, in order from greatest to least according to the weekly eating frequency analysis. On average, the weekly eating frequency of milks, the most frequent and important Ca source, was 2.61 in the normal group, 1.85 in the osteopenia, and 1.30 in the osteoporosis group. The more frequent the intake of milk or milk products by the subjects, the healthier bones they had (P < 0.01). The average weekly intake of anchovies, the third most important source of Ca was 2.91, 2.71, and 1.53, respectively (P < 0.001). However, the frequency of Kimchi intake, the second most important Ca source for Korean people was not different among the three different bone health groups, reflecting the fact that Kimch is a typical and traditional dish in the Korean diet. Tofu, the fourth most important Ca source (1.60, 1.38, 1.14, respectively), yoghurt, and egg did showed differences in intake frequency (P < 0.05) but after adjusting for age, there was no statistically significant difference among the three groups.
DISCUSSION
The prevalence of osteoporosis increased among the subjects with increasing age has been observed in other studies. Age is one of the most important risk factors for osteoporosis among postmenopausal women [28,29]. This tendency is associated with the decreased function of osteoblast leading to bone resorption due to decreased estrogen secretion as one ages.
To prevent this phenomenon, It is recommended for women to obtain maximum bone mass prior to age 35s [30]. The socio-demographic analysis showed that the low bone health is associated with low education level, confirming previous study results that education level affects nutritional knowledge about bone health and related prevention behaviors [31].
Employment status and monthly household income were also associated with bone health. As income level increases, health management behavior becomes optimal because socio- economic and demographic variables are highly correlated. Low bone health is associated with low income and /or affordability of quality foods, deficiency in nutritional knowledge and exposure to nutritional information, which leads to inferior diet quality and deficiency in nutrient intakes related to bone formation and bone health. The average height and weight of the subjects decreased in the normal, osteopenia, and osteo- porosis groups in that order as did the BMI, which confirmed previous results in menopausal women [32-35].
The prevalence of overweight and obesity based on BMI was
highest in the normal bone health group at 52%, and was 42.3%
in the osteopenia group, and was lowest in the osteoporosis group as 27.9%. This finding was consistent with the results of a previous study, which found an odds ratio of 1.92 for the subjects in the underweight group to have osteoporosis compared to the normal weight group [36], confirming that being underweight is risk factor for osteoporosis.
The %RNI of each nutrient became lower as bone health levels decreased. The %RNI of protein in the normal bone health group was approximately 140%, far higher than the recommended;
the other two group with inferior bone health were still over the RNI level and showed the same trend in the case of phosphorus and iron.
In case of vitamin C, the normal group and osteopenia group consumed higher amount than recommended, but the osteoporosis group did not.
Vitamin C helping collagen formation by activating alkaline phosphase [37], and the vitamin C intake level and the bone density of calcar femorale are positively correlated [38]. A positive effect on bone formation could be expected with increasing vitamin C intake.
A chronic high- protein diet may result in unhealthy bones due to increasing Ca excretion and bone resorption [39].
However, other studies have shown that protein intake and bone density were positively correlation [40], Although a chronic high protein diet from animal protein sources could lead to negative effect on bone health [41], daily intake of 60-70 g of protein along with isoflavone from bean and bean products could prevent osteoporosis by increasing bone density and decreasing bone resorption [42,43].
Dietary quality analysis showed that the NAR of all of the nutrients except energy decreased a with the bone health level.
The NAR value for Ca and vitamins in the osteoporosis group was significantly lower compared to the normal bone health group. It is important to educate people with lower bone health status to eat appropriate amount of various Ca sources, especially dairy foods and/or bean products. The NAR of Ca was only 0.51 and that of riboflavin was 0.58 in the osteoporosis group, which confirmed the deficiency milks and dairy products.
The same results were obtained in a previous small scale study [44,45] of postmenopausal Korean females over 50 years of age. These women had higher MAR in the groups with more education compared to those with less. Education also affected the bone level of the subjects. Providing appropriate nutrition information through systematic infrastructure such as health centers and extension courses might be another option to prevent osteoporosis.
The average Dietary Diversity Score of the subjects was 4.02 and decreased as bone health level became worse, with values of 4.23, 4.08, and 3.82, respectively. The proportion of women who ate various foods from each of the five basic food groups was only 33.0% in the normal health group, 27.5% in the osteopenia group, and 12.8% in the osteoporosis group. Eating diverse foods from the five basic food groups is important because if one only eats from a limited number of food groups, one has lower chance of fulfilling nutritional requirements.
Because the osteoporosis group in particular showed a high
prevalence of extremely limited variety of food intake, nutrition
education is necessary from childhood to prevent osteoporosis later in life. It is also important to identify and educate people about substitutes or supplementary Ca sources because it is almost impossible for elderly people to increase the number of foods consumed daily due to decreased digestive function or dental problems, psychological stress, etc.
Food group intake pattern analysis showed that the most popular pattern, followed by 55.3% of the subjects, was eating cereals, meats, vegetables and fruits but not dairy and the second most common pattern was eating food from all the five food group foods, but only 23.4% of the subjects did this. In each of the three bone -health -groups, the proportion that did not eat dairy products was very high but it was highest in the osteoporosis group. The values were 63.8%, 67.5%, and 81.4%, respectively. In the osteoporosis group the second most popular dietary pattern was not eating dairy products or meats, confirming the inferior dietary quality of the osteoporosis group.
The typical Korean diet is low in Ca. Koreans seldom eat nor use milk or milk products during cooking. This problem was also found in other Korean studies [44]. The most important source of Ca for Koreans is mainly green leaves and dried anchovies. Food intake frequency analysis of 10 leading food sources of Ca showed that the average weekly intake frequency of milk and milk products was 2.61 in the normal group, 1.5 in the osteopenia group, and 1.30 in the osteoporosis group, showing sharp decrease in intake frequency along with decreased bone health levels measured by mineral density.
The Korean dietary guidelines for adults and the elderly recommend drinking one cup(200 ml) of milk daily [27].
Compared to the recommended 7 servings (1,400 ml) per week, the subjects’ milk intake in all three groups was much lower with an average frequency of 1.80. If a woman drink one cup of milk daily, she can fulfill approximately 30% of the recommended amount of daily Ca intake from milk [46] and other C-containing foods such as green leaves and anchovies can be added. Because the gut absorption rate of Ca from dairy is relatively high compared to other foods it is essential to eat dairy foods to prevent and treat of osteoporosis.
As expected, there was no significant difference in the frequency of subjects eating Kimchi. Kimchi is the second most important source of Ca for Korean women because it is a traditionally typical food for Koreans and is eaten with each meal. The frequency of eating anchovies was significantly different among the three bone-health groups as was milks and sea mustard even after adjusting for age. One hundred grams of dried anchovies contains 1,200 mg of Ca and 17 g of one serving size, provides approximately the same amount of Ca as one serving of milk [46]. Anchovies can be the substituted in a Ca- deficient diet caused by lactose intolerance among Oriental elderly people. Currently, functional foods such as lactose free milks are produced and they can reduce Ca deficiency problems for the people with lactose intolerance.
Tofu, a bean product, can be an excellent substitute for supplementing Ca intake, providing not only Ca but also isoflavone, which also has a positive effect on bone density [41].
Setchell et al. reported that for female subjects taking in over 45-50 mg isoflavone daily resulted in lengthened menopause
[47]. Because one cup of soy milk or half a portion of tofu provide this amount of isoflavone, it is advisable to increase the intake of tofu and beans by postmenopausal women in Korea to increase bone health.
In summary, we found that the bone health level based on bone mineral density was highly associated with dietary quality among postmenopausal Korean women. Women with osteoporosis or osteopenia consumed a lower amount of each KDRI- indexed nutrients compared to women with normal bone health and lower %RNI and NAR. Ca had the lowest NAR value among all of the KRNI- indexed nutrients, all Korean women consumed a deficient amount regardless of bone density levels.
Eating pattern analysis of the five basic food groups also confirmed these findings, showing that women were not eating sufficient dairy, especially those in the lower bone health group.
This could be partly explained by the lack of milk and milk products in the typical eating pattern and lactose intolerance among Oriental women. Alternative Ca sources such as dried anchovies or bean products could help elderly people who have difficulty in digesting dairy foods or are not familiar with them.
These findings of our study could be applied to nutrition education interventions focusing on eating a variety of foods from each of the five basic food groups and consuming more dairy products if they can be digested, or supplementing Ca intake with dried anchovies and/or bean products better bone health later in life.
REFERENCES
1. Statistics Korea. Population projections and summary indicators for Korea [Internet]. Daejeon: Statistics Korea; 2012 [cited 2012 Febuarary 23]. Available from: http://kosis.kr/statHtml/statHtml.do?
orgId=101&tblId=DT_1B35001&vw_cd=MT_ZTITLE&list_id=A41_10_
10&seqNo=&lang_mode=ko&language=kor&obj_var_id=&itm_id=&
conn_path=E1#.
2. Statistics Korea. Summary of census population [Internet]. Daejeon:
Statistics Korea; 2013 [cited 2006 December 27]. Available from:
http://kosis.kr/statHtml/statHtml.do?orgId=350&tblId=TX_35001_A0 61&conn_path=I2.
3. National Osteoporosis Foundation (US). America's Bone Health: The State of Osteoporosis and Low Bone Mass in Our Nation.
Washington D.C.: National Osteoporosis Foundation; 2002.
4. Preisinger E, Leitner G, Uher E, Alacamlioglu Y, Seidl G, Marktl W, Resch KL. Nutrition and osteoporosis: a nutritional analysis of women in postmenopause. Wien Klin Wochenschr 1995;107:418-22.
5. Lauderdale DS, Jacobsen SJ, Furner SE, Levy PS, Brody JA, Goldberg J. Hip fracture incidence among elderly Asian-American populations.
Am J Epidemiol 1997;146:502-9.
6. Jeong GH, Yang SO, Lee KO, Pye OJ, Lee M, Baik SH, Kim KW. Bone mineral density, health-promoting behaviors, and self-efficacy in middle-aged women. Korean J Women Health Nurs 2003;9:170-8.
7. Ilich JZ, Kerstetter JE. Nutrition in bone health revisited: a story beyond calcium. J Am Coll Nutr 2000;19:715-37.
8. Walker SN, Volkan K, Sechrist KR, Pender NJ. Health-promoting life styles of older adults: comparisons with young and middle-aged adults, correlates and patterns. ANS Adv Nurs Sci 1988;11:76-90.
9. Carr MC. The emergence of the metabolic syndrome with menopause. J Clin Endocrinol Metab 2003;88:2404-11.
10. Peters BS, Martini LA. Nutritional aspects of the prevention and treatment of osteoporosis. Arq Bras Endocrinol Metabol 2010;54:
179-85.
11. Pinnel SR, Murad S, Darr D. Induction of collagen synthesis by ascorbic acid. A possible mechanism. Arch Dermatol 1987;123:
1684-6.
12. Choi MJ. Effects of exercise and calcium intake on blood pressure and blood lipids in premenopausal women. Korean J Nutr 2001;34:62-8.
13. Heaney RP, Gallagher JC, Johnston CC, Neer R, Parfitt AM, Whedon GD. Calcium nutrition and bone health in the elderly. Am J Clin Nutr 1982;36:986-1013.
14. Young EA. Nutrition, aging, and the aged. Med Clin North Am 1983;67:295-313.
15. Spencer H, Kramer L. NIH Consensus Conference: osteoporosis.
Factors contributing to osteoporosis. J Nutr 1986;116:316-9.
16. Son SM, Lee Y. Bone density of middle aged women residing in urban area and the related factors: I. distribution of bone density according to age and the prevalence of osteoporosis in the middle aged women residing in urban area. Korean J Community Nutr 1998;3:380-8.
17. Hong H, Kim EK, Lee JS. Effects of calcium intake, milk and dairy product intake, and blood vitamin D level on osteoporosis risk in Korean adults: analysis of the 2008 and 2009 Korea National Health and Nutrition Examination Survey. Nutr Res Pract 2013;7:409-17.
18. Eaton-Evans J. Osteoporosis and the role of diet. Br J Biomed Sci 1994;51:358-70.
19. Ministry of Health and Welfare, Korea Centers for Disease Control and Prevention. Korea Health Statistics 2010: Korea National Health and Nutrition Examination Survey (KNHANES V-1). Cheongwon:
Korea Centers for Disease Control and Prevent; 2011.
20. Choi MJ, Park EJ, Jo HJ. Relationship of nutrient intakes and bone mineral density of elderly women in Daegu, Korea. Nutr Res Pract 2007;1:328-34.
21. Park SJ, Joo SE, Min H, Park JK, Kim Y, Kim SS, Ahn Y. Dietary patterns and osteoporosis risk in postmenopausal Korean women. Osong Public Health Res Perspect 2012;3:199-205.
22. Ministry of Health and Welfare, Korea Centers for Disease Control and Prevention. Korea Health Statistics 2010: Korea National Health and Nutrition Examination Survey (KNHANES V-1). Cheongwon:
Korea Centers for Disease Control and Prevent; 2011.
23. Kanis JA. Assessment of fracture risk and its application to screening for postmenopausal osteoporosis: synopsis of a WHO report. WHO Study Group. Osteoporos Int 1994;4:368-81.
24. The Korean Nutrition Society. Dietary Reference Intakes for Koreans.
Seoul: The Korean Nutrition Society; 2010.
25. Gibson RS. Principles of Nutritional Assessment. New York (NY):
Oxford University Press; 1990.
26. Kant AK. Indexes of overall diet quality: a review. J Am Diet Assoc 1996;96:785-91.
27. Ministry of Health and Welfare. Dietary Guidelines for Elderly. Seoul:
Ministry of Health and Welfare; 2010.
28. Jung SP, Lee KM, Lee SH. Factors affecting to bone mineral density in postmenopausal women. Yeungnam Univ J Med 1996;13:261-71.
29. Jeon JD. A case-control study on the associated factors of osteoporosis in adult women [master's thesis]. Gwangju: Chosun
University; 2004.
30. Oh SA. A study on risk factors of osteoporosis among postmeno- pausal women [master's thesis]. Seoul: Yonsei University; 1998.
31. Kim MC, Choi JH, Kim TH, Hong IP, Park HS. Women's recognition about postmenopausal osteoporosis. J Korean Acad Fam Med 1995;16:298-306.
32. Lee JS, Yu CH. Some factors affecting bone mineral density of Korean rural women. Korean J Nutr 1999;32:935-45.
33. Kim KR, Kim KH, Lee EK, Lee SS. A study on the factors affecting bone mineral density in adult women: based on the mothers of elementary school students. Korean J Nutr 2000;33:241-9.
34. Youk JI. Female bone mineral density in an urban area and its relation with contributing factors [master's thesis]. Daejeon:
Chungnam National University; 2004.
35. Lee HJ, Choi MJ, Lee IK. The effect of anthropometric measurement and body composition on bone mineral density of Korean women in Taegu. Korean J Nutr 1996;29:778-87.
36. The Study Group of Menopause. Risk factors of osteoporosis in Korean menopause women. J Korean Soc Menopause 2005;11:
143-9.
37. Morton DJ, Barrett-Connor EL, Schneider DL. Vitamin C supplement use and bone mineral density in postmenopausal women. J Bone Miner Res 2001;16:135-40.
38. Wang MC, Luz Villa M, Marcus R, Kelsey JL. Associations of vitamin C, calcium and protein with bone mass in postmenopausal Mexican American women. Osteoporos Int 1997;7:533-8.
39. Metz JA, Anderson JJ, Gallagher PN Jr. Intakes of calcium, phosphorus, and protein, and physical-activity level are related to radial bone mass in young adult women. Am J Clin Nutr 1993;58:
537-42.
40. Lee HJ, Lee HO. A Study on the bone mineral density and related factors in Korean postmenopausal women. Korean J Nutr 1999;32:
197-203.
41. Marsh AG, Sanchez TV, Midkelsen O, Keiser J, Mayor G. Cortical bone density of adult lacto-ovo-vegetarian and omnivorous women.
J Am Diet Assoc 1980;76:148-51.
42. Erlandsson MC, Islander U, Moverare S, Ohlsson C, Carlsten H.
Estrogenic agonism and antagonism of the soy isoflavone genistein in uterus, bone and lymphopoiesis in mice. APMIS 2005;113:317-23.
43. Heaney RP, Recker RR. Effects of nitrogen, phosphorus, and caffeine on calcium balance in women. J Lab Clin Med 1982;99:46-55.
44. Choi YH. A study on nutritional status, bone metabolism related factors and serum minerals in Korean postmenopausal women with in different bone mineral density [master's thesis]. Seoul: Sookmyung Women's University; 2002.
45. Bae YJ, Sung CJ. A comparison between postmenopausal osteoporotic women and normal women of their nutrient intakes and the evaluation of diet quality. Korean J Community Nutr 2005;10:205-15.
46. Rural Development Administration. Food Composition Table.
Suwon: Rural Development Administration; 2012.
47. Setchell KD. Phytoestrogens in the prevention of hormone- dependent disease with reference to the significance to soy infant formula diets. Proceedings of the 3rd International Soybean Symposium; 1998 Nov 19-20; Hotel Shilla, Seoul. Miryang: Korean Soybean Society; 1998. p.19-20.