Evaluation of Focal Bone Mineral Density Using Three-dimensional Measurement of Hounsfield Units in the Proximal Humerus
Young Lae Moon , Sung Jung, Sang Ha Park, Gwi Youn Choi
Department of Orthopaedic Surgery, Chosun University Hospital, Gwangju, Korea
Background: Although there are several methods for evaluating bone quality, Hounsfield units (HU), a standardized computed tomogra- phy (CT) attenuation coefficient, provide a useful tool for estimating focal bone mineral density (BMD). The aim of this study is to investi- gate the HU for evaluating the degree of osteoporosis in greater tuberosity with regard to anchor positioning.
Methods: Forty patients diagnosed as normal on shoulder CT were included and categorized according to age and gender. Axially sec- tioned CT images were processed to 3-dimensional models containing information about bone quality using Mimics (14.11 platform v14.1.1.1 Materialise). Three-dimensional anchors were simulated and positioned according to 6 regions of interest (ROI) in the greater tuberosity classified using Tingart’s system. Mean HU of intra-anchor volumes in the 6 regions was measured.
Results: A significant decrease in HU was observed with increasing age (p=0.0001) and menopause (p<0.001). A significant difference in HU was found between male and female groups with males showing the higher values (p=0.0001). HU of proximal areas of ROI was higher than those of distal areas (p<0.005). However, although mean HU of distal posterior ROI showed the lowest values, no statisti- cally significant difference was found between anterior, middle, and posterior regions (p=0.087).
Conclusions: Mean HU of ROIs provides a tool for preoperative assessment of focal BMD, which is a factor of suture anchor stability and can be used to aid decision-making regarding secure anchor positioning for rotator cuff repair. Our data support that the most se- cure point is the proximal regions of ROI.
(Clin Shoulder Elbow 2015;18(2):86-90)
Key Words: Shoulder; Hounsfield units; Three-dimensional; Bone density; Anchor stability Clinics in Shoulder and Elbow Vol. 18, No. 2, June, 2015
http://dx.doi.org/10.5397/cise.2015.18.2.86
Received October 28, 2014. Revised December 29, 2014. Accepted February 25, 2015.
Correspondence to: Young Lae Moon
Department of Orthopaedic Surgery, Chosun University Hospital, 365 Pilmun-daero, Dong-gu, Gwangju 501-717, Korea Tel: +82-62-220-3147, Fax: +82-62-226-3379, E-mail: [email protected]
Financial support: This work was supported by the ICT R&D program of MSIP/IITP (2014[2014-044-065-003], Development of Human Digital Multimedia Contents Generation and Service Technology). Conflict of interests: None.
Introduction
Pull-out failure of rotator cuff repair is not uncommon. Failure could occur at the anchor-bone interface, the tendon suture interface, the anchor-suture interface, or the suture itself.1-5) In addition, poor bone quality caused by osteoporosis has been suggested to play a role in suture anchor failure at the anchor- bone interface after rotator cuff repair.6-8) Bone quality is usually evaluated by dual energy X-ray absorptiometry (DXA), which is regarded as the gold standard for determining global bone mineral density (BMD); however, it does not correlate with the proximal humerus BMD. Local osteoporosis of proximal hu- merus is particularly common in patients with rotator cuff tear.9)
According to recent studies, Hounsfield Units (HU) derived by computed tomography (CT) scan provided an alternative meth- od for estimating focal BMD.10,11) Because BMD does not reflect the localized osteoporosis, we investigated the HU for evaluating the degree of osteoporosis in proximal humerus with regard to anchor positioning.
Methods
Among the patients who underwent evaluation by shoulder CT in our hospital for shoulder pain between January 2011 and December 2013, with the exception of a previous humeral fracture, surgery, and osteoporosis medication, 40 patients di-
agnosed as normal or simple contusion by the radiologists were selected. There were 20 females with a mean age of 50 years (range, 42 to 65 years), half of them were post-menopausal, and 20 males with a mean age of 53 years (range, 49 to 67 years).
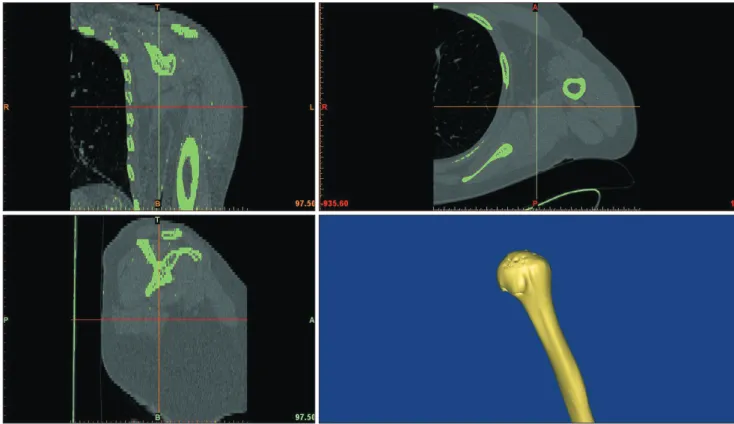
For 3-dimensional (3D) analysis, CT images of the humerus were transformed to 3D models using image-processing software (Mimics v14.1.1; Materialize, Leuven, Belgium) (Fig. 1). Regional
segmentation was required for investigation of the localized osteoporosis. The greater tuberosity of the 3D humerus was di- vided into 6 regions of interests (ROI) as described by Tingart et al. (Fig. 2).8)
Depending on the depth and location of the anchor, the pull out strength varied significantly. Therefore, instead of measuring the HU values of each segment, we measured the HU of only Fig. 1. Translation of clinical shoulder computed tomography images to 3-dimensional models.
Fig. 2. The greater tuberosity of the 3-dimensional humerus was classified ac-
cording to 6 regions of interest as described by Tingart et al.8). Fig. 3. A 4.5×15 mm 3-dimensional virtual anchor.
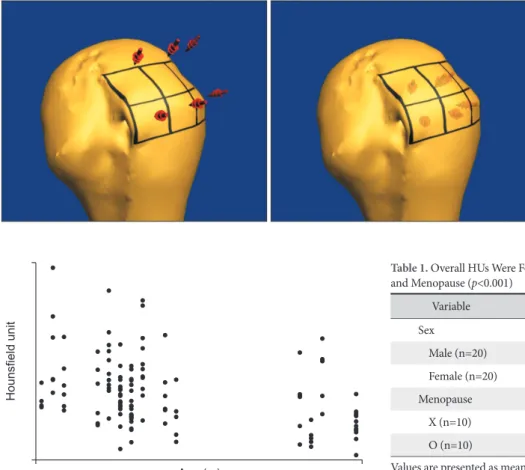
the portion in which the 3D anchor was inserted. Following insertion of the 3D anchor, the HU values of the regions cor- responding to the total volume of the anchor occupied were compared. Therefore, analysis of HU value of the cortical bone as well as analysis of the cancellous bone in more depth was performed. Using this method, it is possible to represent the force received after inserting the actual anchor more closely than comparing the surface area only. 3D anchor computer aided design model (Fig. 3), with a size of 4.5×15 mm, was positioned using 3D image-processing software into each area of the 6 ROIs in the greater tuberosity of the 3D humerus model (Fig. 4). To exclude the cortical area, the anchors were simulated and positioned approximately 3 mm below the cortical margin, deep into the tubercular area. The mean HU in each of the 3D anchors was measured using Mimics software. HU represents a normalized index of X-ray attenuation based on a scale of 1,000 defined for air and 0 for water at standard pressure and temperature.10) For clinical CT examinations, the HU values are automatically calculated by the equation and displayed on the screen.
Statistical Analysis
Correlation between HU of the 6 ROIs and age was analyzed using Pearson correlation coefficients. Correlation between HU and sex and menopause was analyzed using the independent two sample t-test, and each focal HU of the 6 ROIs was com- pared using analysis of variance. The IBM SPSS ver. 19.0 pro- gram (IBM Co., Armonk, NY, USA) was used for the statistical analysis and statistical charts were generated using Microsoft Ex- cel 2010 software (Microsoft, Redmond, WA, USA). P-values of
<0.05 were considered significant and p-values of <0.01 were considered highly significant.
Results
HU value measurements were found to have excellent intrao- bserver and interobserver reliabilities (0.953 and 0.964, respec- tively). HU values obtained using the 3D image-processing soft- ware were categorized according to sex, age, and menopause.
The mean HU showed a linear decrease with increasing age (r2=-0.112, p<0.001) (Fig. 5). In addition, results for the mean HU according to sex (p=0.0001) and menopause (p<0.001) showed higher values for males and premenopausal females (Table 1). In addition, HU of proximal ROIs (157.65) was signifi- cantly higher than that of distal ROIs (105.83; p<0.005). How- Fig. 4. Insertion of the 3-dimensional virtual anchor into the 6 regions of interest in the greater tuberosity.
Age (yr)
Hounsfieldunit
Fig. 5. Relation between overall Hounsfield units and age (r2=-0.112, p<0.001).
Table 1. Overall HUs Were Found to Decrease Significantly by Age (p=0.0001) and Menopause (p<0.001)
Variable HU p-value
Sex 0.009
Male (n=20) 162.33 ± 92.134 Female (n=20) 122.10 ± 77.518 Menopause
X (n=10) 162.59 ± 85.639 <0.001 O (n=10) 87.92 ± 64.030
Values are presented as mean ± standard deviation.
HU: Hounsfield unit.
ever, no statistically significant difference was observed between anterior, middle, and posterior regions, although the mean HU of the distal posterior ROI showed the lowest value (p=0.087;
Table 2, Fig. 6).
Discussion
According to Schreiber et al.,10) HU obtained from CT scans are comparable with DXA scores and potentially provide an alternative method for determining focal BMD without ad- ditional cost to the patient11,12) even though DXA is currently regarded as the gold standard for evaluation of global BMD.13) Ryo et al.14) proposed an equation for calculation of bone density from HU values in their preliminary analyses (bone density=1.122×HU+47).
Poor bone quality caused by osteoporosis can reduce implant
stability, and increase the risk of suture anchor pullout failure in cases of rotator cuff repair.15) Failure at the anchor-bone interface is not uncommon, and some recent clinical studies have assessed the suitability of this interface with respect to bone quality.1-5)
BMD has been proposed as a good predictor of the mechani- cal integrity of trabecular bone.16) However, global measures of bone quality can only explain implant stability to a limited ex- tent. In other words, good bone stock, as assessed by DXA, does not guarantee good implant stability in rotator cuff repair. Oh et al.9) found that bone quality in the proximal humerus in affected unilateral rotator cuff tear shoulder is different from that of con- tralateral, normal shoulder. That is, in general, because BMD is calculated as the value of DXA of lumbar spine and hip joint and specific areas, BMD cannot represent the state of the proximal humerus with localized osteoporosis due to rotator cuff tear.
Regarding the pull-out strength of the anchor, Tingart et al.8) showed that bone quality, anchor type, and anchor placement have significant impacts on anchor failure loads. In this previ- ous study, pullout strengths were studied for different anchor insertion locations on the greater tuberosity. Analysis of the fo- cal BMDs of ROIs in the greater tuberosity found that suture anchors inserted into the proximal anterior and middle zones were capable of sustaining significantly higher loads at failure,8) which matches our results. In our study, significant correlations were observed between overall HU and age, sex, and meno- pause, and the HU of proximal ROIs in the greater tuberosity (GT) was significantly higher than that of distal HU. Although no difference was found between the HU of anterior, middle, and posterior ROIs, the distal posterior ROI showed the lowest mean HU value.
Depth of anchor insertion as well as bone quality and anchor location is important in regard to suture anchor failure. Because partial decortication for greater tuberosity preparation may be performed during repair of a rotator cuff, we inserted anchors into the tubercular area. Mahar et al.17) found that deep suture anchor placement increased purchase and caused greater sta- bility than standard placement; thus, in the anchor model, we Table 2. Mean HUs of Each ROI
ROI HU p-value
PA 162.646 ± 29.336 <0.001
PM 159.203 ± 34.707
PP 151.128 ± 57.875
DA 132.514 ± 69.848
DM 112.798 ± 48.917
DP 72.200 ± 23.464
Proximal 157.659 ± 41.426 <0.001
Distal 105.837 ± 55.630
Anterior 147.580 ± 54.505 0.087
Middle 136.000 ± 47.719
Posterior 111.664 ± 59.066 Values are presented as mean ± standard deviation.
ROI: region of interest, HU: Hounsfield unit, PA: proximal anterior, PM: proxi- mal middle, PP: proximal posterior, DA: distal anterior, DM: distal middle, DP:
distal posterior.
175
150
125
100
75
MeanHU
PA PM PP DA DM DP ROIs
160 150 140 130 120 110 100
MeanHU
Proximal Distal
150
140
130
120
110
MeanHU
Anterior Middle Posterior
Fig. 6. Hounsfield unit (HU) of proximal regions of interest (ROIs) in the greater tuberosity were significantly greater than those of distal ROIs. Although no cor- relation was found between anterior, middle, and posterior regions, mean HU of the distal posterior ROI were lowest.
PA: proximal anterior, PM: proximal middle, PP: proximal posterior, DA: distal anterior, DM: distal middle, DP: distal posterior.
placed anchors approximately 3 mm below the cortical margin in an effort to prevent sclerotic change in the GT caused by rota- tor cuff tear.
Our study has some limitations. First, only 40 patients were included, thus, our findings cannot be accurately applied to the general population. Second, while DXA scans assess both trabecular and cortical bone, HU values provide an evaluation of only trabecular bone, which may account for some of the dif- ferences observed between DXA findings and findings obtained using HU values. Third, in patients with rotator cuff tear only, the need for CT is lower than magnetic resonance imaging.
We have only studied the normal group. Future study of HU of the proximal humerus with localized osteoporosis due to rota- tor cuff tear and correlation between HU in CT scan and clinical score is planned.
Conclusion
Mean HU of ROIs obtained by CT can provide a means of preoperative assessment of focal bone density, which plays a role in suture anchor stability. We believe that appropriate HU values can be used to aid decision-making regarding proper suture an- chor positioning during rotator cuff repair. And, according to our data, the most secure point is the proximal regions of ROI.
References
1. Aktay SA, Kowaleski MP. Analysis of suture anchor eyelet posi- tion on suture failure load. Vet Surg. 2011;40(4):418-22.
2. Barber FA, Cawley P, Prudich JF. Suture anchor failure strength--an in vivo study. Arthroscopy. 1993;9(6):647-52.
3. Cummins CA, Appleyard RC, Strickland S, Haen PS, Chen S, Murrell GA. Rotator cuff repair: an ex vivo analysis of suture anchor repair techniques on initial load to failure. Arthroscopy.
2005;21(10):1236-41.
4. Ma R, Chow R, Choi L, Diduch D. Arthroscopic rotator cuff re- pair: suture anchor properties, modes of failure and technical considerations. Expert Rev Med Devices. 2011;8(3):377-87.
5. Strauss E, Frank D, Kubiak E, Kummer F, Rokito A. The effect of the angle of suture anchor insertion on fixation failure at the tendon-suture interface after rotator cuff repair: deadman’s angle revisited. Arthroscopy. 2009;25(6):597-602.
6. Tingart MJ, Lehtinen J, Zurakowski D, Warner JJ, Apreleva M.
Proximal humeral fractures: regional differences in bone min- eral density of the humeral head affect the fixation strength of cancellous screws. J Shoulder Elbow Surg. 2006;15(5):620-4.
7. Poukalova M, Yakacki CM, Guldberg RE, et al. Pullout strength of suture anchors: effect of mechanical properties of trabecular bone. J Biomech. 2010;43(6):1138-45.
8. Tingart MJ, Apreleva M, Lehtinen J, Zurakowski D, Warner JJ.
Anchor design and bone mineral density affect the pull-out strength of suture anchors in rotator cuff repair: which anchors are best to use in patients with low bone quality? Am J Sports Med. 2004;32(6):1466-73.
9. Oh JH, Song BW, Kim SH, et al. The measurement of bone mineral density of bilateral proximal humeri using DXA in patients with unilateral rotator cuff tear. Osteoporos Int. 2014;
25(11):2639-48.
10. Schreiber JJ, Anderson PA, Rosas HG, Buchholz AL, Au AG.
Hounsfield units for assessing bone mineral density and strength: a tool for osteoporosis management. J Bone Joint Surg Am. 2011;93(11):1057-63.
11. Silva MJ, Keaveny TM, Hayes WC. Computed tomography- based finite element analysis predicts failure loads and fracture patterns for vertebral sections. J Orthop Res. 1998;16(3):300-8.
12. McBroom RJ, Hayes WC, Edwards WT, Goldberg RP, White AA 3rd. Prediction of vertebral body compressive fracture us- ing quantitative computed tomography. J Bone Joint Surg Am.
1985;67(8):1206-14.
13. Marshall D, Johnell O, Wedel H. Meta-analysis of how well measures of bone mineral density predict occurrence of osteo- porotic fractures. BMJ. 1996;312(7041):1254-9.
14. Rho JY, Hobatho MC, Ashman RB. Relations of mechanical properties to density and CT numbers in human bone. Med Eng Phys. 1995;17(5):347-55.
15. Wirth AJ, Goldhahn J, Flaig C, Arbenz P, Müller R, van Lenthe GH. Implant stability is affected by local bone microstructural quality. Bone. 2011;49(3):473-8.
16. Ciarelli MJ, Goldstein SA, Kuhn JL, Cody DD, Brown MB.
Evaluation of orthogonal mechanical properties and density of human trabecular bone from the major metaphyseal regions with materials testing and computed tomography. J Orthop Res. 1991;9(5):674-82.
17. Mahar A, Bynum CK, Lee S, Tasto J, Pedowitz R. Failure mode of suture anchors as a function of insertion depth. Am J Sports Med. 2005;33:1030-4.