RESEARCH ARTICLE
Received: June 10, 2016, Revised: July 7, 2016, Accepted: July 7, 2016 ISSN 1598-4478 (Print) / ISSN 2233-7679 (Online)
†
Correspondence to: Ji-Hyun Min
Department of Dental Hygiene, College of Health Sciences, Cheongju University, 298 Daeseong-ro, Cheongwon-gu, Cheongju 28503, Korea Tel: +82-43-229-8375, Fax: +82-43-229-8969, E-mail: [email protected]
Copyright © 2016 by Journal of Dental Hygiene Science
Optical Coherence Tomography를 이용한 초기 치아우식 검사
민지현
†
청주대학교 보건의료대학 치위생학과
Assessment of Early Dental Caries by Using Optical Coherence Tomography
Ji-Hyun Min †
Department of Dental Hygiene, College of Health Sciences, Cheongju University, Cheongju 28503, Korea
The purpose of this study was to assess the correlation between integrated mineral loss (volume % mineral×μm, ΔZ
TMR) determined using transverse microradiography (TMR) and integrated reflectivity (dB×μm, ΔR
OCT) determined using optical coherence tomography (OCT) for detecting early dental caries with lesion depth more than 200 μm. Sixty tooth specimens were made from sound bovine teeth. They were immersed in a demineralized solution for 20, 30, and 40 days. The ΔR
OCTwas obtained from the cross-sectional OCT image. The ΔZ
TMRwas obtained from the TMR image. The correlation between ΔR
OCTand ΔZ
TMRwas examined using Pearson correlation. The Bland-Altman plot was constructed using the ΔR
OCTand ΔZ
TMRvalues. A significant correlation between ΔR
OCTand ΔZ
TMRwas confirmed (r=0.491, p=0.003). Moreover, most of the difference between ΔR
OCTand ΔZ
TMRwas included in the error section of the Bland-Altman plot. Therefore, OCT could be used as a substitute for TMR when analyzing mineral loss in early dental caries.
Key Words: Early dental caries, Optical coherence tomography, Transverse microradiography
서 론
구강 내 법랑질은 탈회(demineralization)와 재광화(re- mineralization)가 반복되며 무기질의 소실과 획득이 균형 을 이루고 있다. 그러나 이러한 순환 과정 중 치면세균막의 구성과 양, 당의 섭취 빈도와 시간, 타액의 성분과 흐름, 법 랑질의 질(quality), 불소의 노출, 개인의 면역 반응 등의 복 잡한 과정이 장시간 지속되어 균형이 깨지면 무기질이 소실 되거나 획득될 수 있다 1-6) .
치아우식(dental caires)은 구강 내 미생물이 발효성 당질 을 대사하여 생긴 각종 산(acid)으로 인해 치아 무기질이 용 해되는 것을 의미하며 3) , 치아의 붕괴 없이 무기질 소실만 일
어나는 초기단계에서 치아의 구조가 무너져 와동(cavity)이 형성되는 단계를 거친다. 초기단계의 우식은 침습적인의 (invasive) 처치가 필요하지 않으며 무기질의 재획득, 즉 재 광화 과정을 통해 정상 치아로의 회복이 가능하다 2) . 따라서 초기단계의 우식을 관리하는 것이 중요하다고 하겠다. 만약 초기단계의 우식을 임상에서 쉽게 탐지할 수 있다면 더 이 상의 진행을 막을 수 있도록 하는 예방 처치가 가능할 것이다.
치아우식은 전통적으로 시진 또는 촉진, 그리고 방사선
장비를 이용하여 탐지하였다. 그러나 이러한 방법은 주관적
인 평가법으로, 초기우식 부위에 대해 민감도(sensitivity)가
떨어질 수 있으며 7,8) , 초기우식의 심도에 따른 객관적인 수
치화가 어렵다. 이미 초기우식을 탐지하고 이를 심도에 따
Fig. 1. Bland-Altman plot between integrated mineral loss (volume % mineral× μm, ΔZ
TMR) and integrated reflectivity (dB× μm, ΔR
OCT). The line in the center indicates the mean dif- ference between ΔZ
TMRand ΔR
OCT. The two dotted lines indicate plus or minus 1.96 times the standard deviation from the mean between ΔZ
TMRand ΔR
OCT. TMR: transverse microradiography, OCT: optical coherence tomography.
라 수치화하여 결과를 제시하는 다양한 장비들이 시판되고 있다 9-11) . 그 중 최근 광간섭 단층영상기(optical coherence tomography, OCT)를 이용한 초기우식 탐지 및 심도 평가 가능성에 대해 많은 연구가 이루어지고 있다 12-17) . OCT는 1991년도에 처음 개발되었으며, 백색광 간섭계(white-light interferometry) 또는 저가간섭 간섭계(low coherence int- erferometry)의 원리와 공초점 현미경(confocal microscopy) 의 원리를 조합한 영상 기기이다 18) . 기본적으로 마이켈슨 간 섭계(Michelson interferometry)의 시스템을 가지며, 안과학 (ophthalmology) 영역에서 활발히 활용되고 있다 19) . OCT 를 이용하면 실시간으로 생체조직 내부의 미세구조를 비접 촉 방식으로 고해상도 영상을 관찰할 수 있으며, 초기 치아 우식도 비파괴적으로 단층(cross section)에 대해 관찰이 가 능하다 12,13,20) . 게다가 초기 치아우식 평가의 gold standard로 여겨지는 횡단 미세 방사선법(transverse microradiography, TMR)과 상관성이 높은 것으로 확인되었다 21,22) . 그러나 200 μm 이상의 깊은 법랑질 초기우식과의 상관성에 대한 연구는 부족한 실정이다. 따라서 본 연구의 목적은 200 μm 이상의 깊이를 가지는 법랑질 초기우식 병소에서 병소의 심 도를 의미하는 TMR의 integrated mineral loss (volume % mineral× μm, ΔZ TMR )와 OCT에서 이와 상응하는 inte- grated reflectivity (dB× μm, ΔR OCT )를 구하여 둘 간의 상 관성을 확인해보고자 하였다.
연구대상 및 방법
1. 시편 제작
치아 시편은 건전한 우치 영구치의 전치를 이용하여 제작 하였다. 저속 핸드피스(Lasungmedice, Incheon, Korea)를 이용하여 6×4 mm의 크기로 치아를 절단하여, 레진에 매몰 하였다. 이후 1,200 grit까지 silicon carbide paper (Allied High Tech Products, Rancho Dominguez, CA, USA)를 이 용하여 편평하고 매끄럽게 치아 시편 표면을 연마하였다.
노출된 치아면에 2×4 mm의 창(window)이 형성되도록 내 산성 바니쉬를 도포하였다(Fig. 1).
200 μm 이상의 다양한 깊이를 가지는 병소를 인공적으로 형성하기 위해서 37 o C의 배양기에 저장된 탈회용액에 각 20개씩의 시편을 20일, 30일, 40일간 침적하였다. 탈회 용 액은 21일째에 한 차례 교환하였다. 탈회용액은 pH 4.8의 lactic acid gel로 수산화인회석(hydroxyapatite)에 대해 50% 포화상태이며, 1% carbopol (Carbopol ETD 2050 polymer; The Lubrizol Corporation, Wickliffe, OH, USA) 이 포함되어 있었다. 탈회 이후에는 모든 시편을 철저히 세 척 후 치아의 측면, 법랑질과 상아질 층이 확인될 수 있도록 diamond saw (Techcut 4; Allied High Tech Products)를 이 용하여 치아시편을 절단하였다.
2. OCT 촬영 및 이미지 분석
본 연구에서 사용한 OCT는 spectral domain OCT (SD-OCT prototype; LG Electronics, Seoul, Korea)였다 12) . OCT를 통한 이미지 영상은 치아시편의 측면이 노출되도록 절단한 면에 최대한 가깝게 probe를 위치시켜 촬영을 진행 하였다. 이미지의 폭과 높이는 각각 5.3 mm, 3.2 mm였다.
OCT의 probe와 치아시편 표면 간에는 4 mm의 거리가 있 었으며, backscattered light의 강도(intensity)에 대한 B-scan 영상을 획득했다.
이미지 내 치아표면에서부터 우식병소 최하방까지의
backscattered light의 강도를 각 화소(pixel)에서 흑백 명암
의 값으로 Image J software (public domain developed by
National Institutes of Health, Bethesda, MD, USA)를 이용
하여 얻었다. 이후 화소의 명암값이 0에서 100까지가 되도
록 재구성하였으며, 이 값을 세로축으로 하고 우식병소의
깊이를 가로축으로 하는 그래프를 그렸다. TMR의 경우와
마찬가지로 OCT 영상에서도 세로축의 명암값을 무기질 함
량으로 가정하였으며, 세로축에서 89%의 값을 정상치아의
무기질 함량으로 가정하였다. 이후 치아표면에서부터 89의
명암값과 만나는 x축의 거리까지를 컴퓨터 프로그램(Ori-
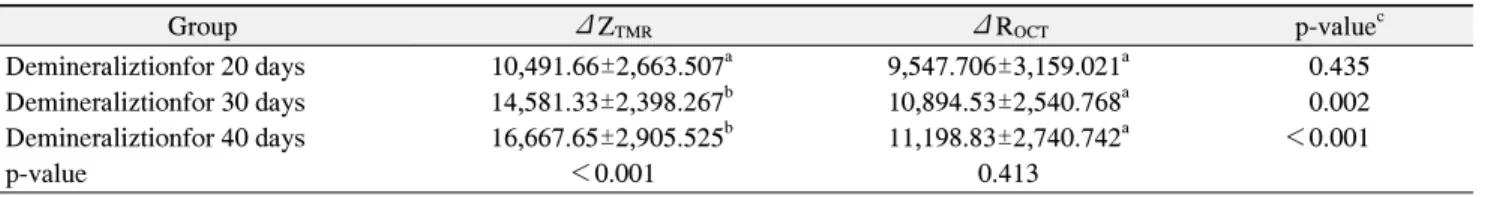
Table 1. The Values of ΔZ
TMRand ΔR
OCTaccording to the Groups
Group ΔZ
TMRΔR
OCTp-value
cDemineraliztionfor 20 days 10,491.66±2,663.507
a9,547.706±3,159.021
a0.435
Demineraliztionfor 30 days 14,581.33±2,398.267
b10,894.53±2,540.768
a0.002
Demineraliztionfor 40 days 16,667.65±2,905.525
b11,198.83±2,740.742
a<0.001
p-value <0.001 0.413
Values are presented as mean±standard deviation.
TMR: transverse microradiography, OCT: optical coherence tomography.
a,b
Values with the same letter superscripts are not significant in Scheffé’s multiple-comparison test at α=0.05.
cp-value was obtained from paired t-test between integrated mineral loss (volume % mineral×μm, ΔZ
TMR) and integrated reflectivity (dB×μm, ΔR
OCT) values.
ginPro 9.0; OriginLab, Northampton, MA, USA)을 이용하 여 적분하여 ΔR OCT 를 구하였다.
3. TMR 촬영 및 분석
치아시편을 측면으로 절단하여 노출된 면에 대해 TMR 촬영을 할 수 있도록, 그 부위의 치아를 절단하여 100 μm의 slice가 될 수 있도록 silicon carbide paper (Allied High Tech Products)를 이용하여 편평하게 연마(grinding)하였 다. 시편을 얇게 제작하는 이 과정에서 20일, 30일, 40일간 탈회한 각 20개 시편 중 각각 9개, 10개, 7개의 시편(총 26개) 소실이 있었다. 이후 100 μm로 제작한 slice와 aluminium step wedge를 20 kV, 15 mA의 Cu-K α radiation (X-ray generator PW 1830; Philips, Amedo, The Netherlands)에 18초간 노출했다 23) . 획득된 필름은 현상, 정착(Korectol E;
Fujifilm, Tokyo, Japan) 과정을 거쳤다.
TMR에서 얻어진 필름은 현미경(Optiphoto; Nikon, Tokyo, Japan)으로 관찰하여 8-bit 디지털 영상(digital images)으로 표준화된 상태 하에서 캡쳐하여 이미지 파일 을 획득하였다. 이후 각 시편마다 치아표면에서부터 병소 깊이까지의 무기질 함량의 윤곽(mineral content profile) 을 얻어, 치아표면(0)에서부터 병소 깊이까지의 적분값, 즉 ΔZ TMR 을 이전 연구의 방법에 따라 컴퓨터 프로그램 (OriginPro 9.0)을 이용하여 구하였다 23) .
4. 통계분석
ΔZ TMR 과 ΔR OCT 간의 평균값의 차이는 paired t-test를 통해 확인하였으며, 탈회 시간에 따른 ΔZ TMR 과 ΔR OCT
의 평균값 간의 차이는 ANOVA 분석으로 검정하였다. 또한 ΔZ TMR 과 ΔR OCT 간의 상관성은 Pearson correlation을 통해 확인하였으며, 이후 gold standard인 ΔZ TMR 과 OCT에서 구한 ΔR OCT 간의 오차를 확인하기 위해 Bland-Altman plot을 그렸다. 모든 통계분석은 PASW Statistics ver. 18.0
(IBM Co., Armonk, NY, USA)을 이용하였으며, 유의수준 은 p<0.05를 기준으로 검정하였다.
결 과
ΔZ TMR 의 평균값은 14,236.66±3,531.98 vol%×μm였으 며, ΔR OCT 의 평균값은 10,366.26±2,840.038 dB× μm로 ΔZ TMR 이 ΔR OCT 보다 평균적으로 1.42배 컸다. ΔZ TMR 과 ΔR OCT 의 평균값 간에 20일간 탈회를 진행한 군에서는 유 의한 차이가 없었으나, 30일(p=0.002)과 40일(p<0.001)간 탈회를 진행한 군에서는 유의한 차이가 확인되었다. 또한 탈회 기간에 따른 평균 ΔZ TMR 값 간에는 유의한 차이가 확 인되었으나(p<0.001), 평균 ΔR OCT 값 간에는 유의한 차이 가 없었다(p=0.413, Table 1). ΔZ TMR 과 ΔR OCT 간에 유의한 상관관계가 확인되었으며(r=0.491, p=0.003), Bland-Altman plot에서도 TMR과 OCT의 두 측정방법으로 구해진 ΔZ TMR
과 ΔR OCT 값 간의 차이가 거의 대부분 오차구간 내에 있는 것이 확인되어 두 측정방법 간의 오차가 적은 것으로 확인 되었다(Fig. 1).
고 찰
TMR은 초기우식병소의 무기질 밀도(mineral density)조 사에 gold standard 장비로 알려져 있다. TMR 분석에서는 얇은 치아 slice에 방사선을 조사하여 높은 해상도의 법랑질 영상을 취득한다. 이때 TMR의 소프트웨어에는 aluminum stepwedge에 대비하여 calibration이 되어 있어, 치아 slice 를 촬영하면 그 영상의 회색도(gray level)에 따라 무기질 함 량(mineral content)값을 자동적으로 산출하는 원리를 가진다.
본 연구에서 조사한 TMR의 무기질 소실(ΔZ TMR ) 정도의 값
은 병소의 깊이( μm)뿐만 아니라 무기질 함량이 반영된 값
으로서 의미가 있다 24) . 또한 이전 연구에서는 낮은 깊이의
법랑질 초기우식병소 또는 치근 우식병소에 대해 TMR과 OCT 간의 상관성에 대해 조사한 경우가 대부분이었다 21,22,25) . 그러나 본 연구에서 사용한 시편은 20일에서 40일까지 법랑 질에 탈회를 진행하여 215.20 μm에서 450.49 μm의 범위의 깊은 병소 깊이를 가지고 있었다(data not shown).
TMR 분석은 초기우식병소의 무기질 밀도 조사에 대한 정확성은 높으나, 분석을 위해서는 시편을 절단해야 하며, 약 100 μm의 slice로 제작해야만 한다. 이 과정에 많은 노력 이 소요될 뿐만 아니라 정교한 작업 실패로 인해 시편의 소 실이 있을 수 있다 26) . 본 연구에서도 초기 60개의 인공 탈회 시편을 제작하였으나, TMR 촬영을 위해 시편을 100 μm의 slice로 제작 중에 26개의 시편 소실이 발생하였다. 또한 TMR 분석은 시편을 파괴해야 하므로 동일 병소의 무기질 변화에 대해 종적인 추적이 불가능하다.
한편 OCT를 이용하면 비파괴적으로 높은 해상도의 실시 간 생체 영상 획득이 가능하다 18,27) . 초기우식병소에 대해 OCT를 활용하면 병소의 단층 영상(cross-sectional image) 을 얻을 수 있으며, 이는 TMR 또는 편광현미경(polarized light microscopy)에서 제공하는 초기우식병소의 단층 영상 과 매우 흡사하다. 이전 연구에서는 편광현미경과 OCT에 서 측정한 각각의 법랑질 초기우식병소 깊이 간에 0.64에서 0.83의 상관계수를 확인하였으며 20,25,28) , ΔZ TMR 과 ΔR OCT 간 에는 0.50 25) , 편광현미경에서 구한 ΔZ과 ΔR OCT 간에는 0.76의 상관계수를 확인하였다(p<0.05) 28) . 본 연구에서도 ΔZ TMR 과 ΔR OCT 간의 유의한 상관관계가 확인되었으며 (r=0.491, p=0.003), Bland-Altman plot에서 오차 구간 내 에 둘 간의 차이가 확인되었다. 따라서 TMR을 대신하여 OCT를 초기우식병소의 정성 분석 및 정량 분석에 이용할 수 있을 것으로 생각된다.
본 연구결과에서 20일, 30일, 40일의 탈회기간에 따라 TMR로 측정하여 얻은 결과값인 ΔZ TMR 에서는 유의한 차 이가 확인되었으나(p<0.001), OCT로 측정하여 얻은 ΔR OCT
에서는 유의한 차이가 없었다(p=0.413). 이는 시편에 인공 탈회를 형성 시 탈회용액을 21일에 교체하여 20일 탈회한 치아와 30일과 40일 탈회한 치아 간 탈회량에 상당한 차이 를 형성하였는데, 이러한 차이가 초기 치아우식 탐지의 gold standard로 여겨지는 TMR에서는 정밀하게 확인되었 으나, OCT에서는 유의한 차이가 확인되지 않은 것으로 생 각된다.
본 연구의 제한점은 실제 사람치아에 형성된 초기우식병 소가 아닌 우치에 인공적으로 형성한 초기우식병소를 이용 하여 분석하였다는 것이다. 그러나 사람치아와 조성이 비슷 한 우치를 연구에 이용하였으며, 치아표면의 소실이 없는
치아우식병소를 사용하였다. 본 연구결과, ΔZ TMR 과 ΔR OCT
간의 유의한 상관관계를 확인하였으며(r=0.491, p=0.003), Bland-Altman plot에서도 ΔZ TMR 과 ΔR OCT 간의 차이가 오차 구간 내에 확인되었다. 따라서 TMR을 대신하여 OCT 를 활용하면 비파괴적으로 초기우식병소 조직의 단층 영상 확인이 가능하다. 뿐만 아니라, 치과임상에서 OCT를 활용 하면 초기우식병소의 탐지 및 모니터링, 그리고 초기우식병 소의 심도 파악이 가능하며, 이에 따른 처치방법의 결정을 효과적으로 할 수 있을 것으로 생각된다.
요 약
TMR은 초기우식 평가의 gold standard로 여겨지나 시편 을 파괴하여야만 시편의 무기질 밀도를 확인할 수 있는 실 험법이다. 그러나 OCT는 비파괴적인 검사법으로 임상에서 도 초기우식을 확인하는 데 사용하므로 본 연구에서는 200 μm 이상의 깊은 법랑질 초기우식에서의 OCT와 TMR에서 구한 integrated mineral loss값 간의 상관성을 확인하고자 하였다. 200 μm 이상의 깊이를 갖는 인공 초기우식병소를 제작하여 TMR (ΔZ TMR )과 OCT (ΔR OCT )에서 구한 integ- rated mineral loss를 각각 구하여 상관성 분석을 시행하였 으며 Bland-Altman plot을 그려 두 값 간의 오차 분석을 시 행하였다. ΔR OCT 과 ΔZ TMR 간에는 유의한 상관성이 확인 되었으며(r=0.491, p=0.003), Bland-Altman plot 상에서도 ΔZ TMR 과 ΔR OCT 값 간의 차이가 거의 대부분 오차 구간 내 에 있는 것이 확인되어 두 측정 방법 간의 오차가 적은 것으 로 확인되었다. 따라서 치과임상에서 OCT를 활용하면 초 기우식병소의 탐지 및 모니터링 그리고 초기우식병소의 심 도 파악이 가능할 것으로 여겨진다.
감사의 글
이 논문은 2015∼2017학년도에 청주대학교 보건의료과 학연구소가 지원한 학술연구조성비(특별연구과제)에 의해 연구되었음.
본 연구 성과를 얻기 위해 많은 가르침을 주시고 지원을 아 끼지 않으신 연세대학교 치과대학 김백일 교수님과 Iwate Medical University School of Dentistry의 Daisuke Inaba 교 수님께 깊은 감사의 말씀을 드립니다.
References