• 검색 결과가 없습니다.

Comparison between the Color Properties of Whiteness Index and Yellowness Index on the CIELAB

N/A
N/A
Protected

Academic year: 2021

Share "Comparison between the Color Properties of Whiteness Index and Yellowness Index on the CIELAB"

Copied!
6
0
0

로드 중.... (전체 텍스트 보기)

전체 글

(1)

2013 KSDF 1229-0033/2013-12/241-246

〈Research Paper〉

1. Introduction

In our daily life, a white fabric is often used such as tablecloth, dress shirt, wedding dress, etc. Because the associated impressions of white color are related to clean and pure. Generally, a white fabric which is an untreated optical whitener has slightly tinted yellowish owing to absorption of blue wavelength of the light

1)

.

Since the developments of chemical bleaching powder in 18th century and fluorescent whitening agents in 20th century, a white fabric is possible to produce a visually higher white fabric which has high reflectivity of blue wavelength of the light

2)

. Thus, the visual whiteness evaluation of white fabric is strongly depends on the spectral properties of the light

3)

. However, the treated white fabric gradually turns towards yellowish with damage owing to washing, direct rays, air pollution etc. Accordingly yellowness of the white fabric is related to deteri- oration of quality, and given a dirty impression

4)

.

Corresponding author: Hyojin Jung ([email protected]) Tel.: +81-75-724-7578 Fax.: +81-75-724-7578

Consequently, the quantitative measurements of both values are important indexes to represent the quality of the white fabric in textile industry. However the whiteness and yellowness evaluations for a white fabric are different in purpose and concept.

Generally, the whiteness is related to the quality of fresh white fabric, thus higher whiteness is a superior color to a white fabric. On the other hand, the yellow- ness is related to the white durability, thus higher yellowness is an inferior color to a white fabric.

Many previous studies have investigated about whit- eness and yellowness e.g., estimation of whiteness

5)

, whiteness and white cognition

6)

, whiteness and tole- rance

7)

, prevention of yellowing

8,9)

, external factor of yellowing

10,11)

, etc. However, those studies were focusing on either whiteness of yellowness.

For a systemization of color quality control of white fabric, it is important to understand how the whiteness differs from yellowness in terms of a measuring concept. However the relation between whiteness and yellowness has not been considered together yet.

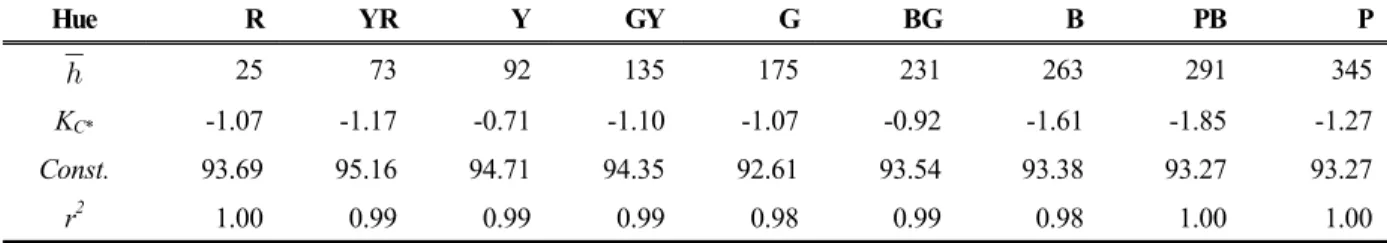
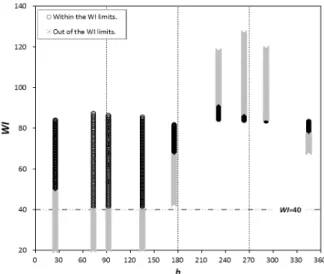
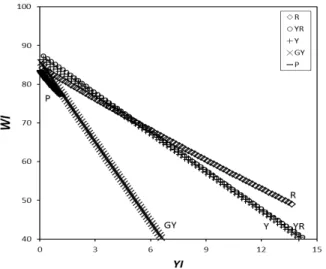
In respect of colorimetric, these two colorimetric values are able to calculate using based on CIE Abstract: The color properties of a white or nearly colorless fabric are represented by whiteness index (WI) or yellowness index (YI). These two indexes relate to a white fabric’s color quality. The purpose of this study was to identify the properties of WI and YI on the CIELAB through the simulations of estimation data for a systemization of color quality control. The results indicated that the relationship between WI and YI was a negative correlation, however the coefficients of correlation function between WI and YI were depended on hue. There were two hue transition points of the rate of changes in WI and YI. These hue transition points were the reference points to divide the hue contribution to WI and YI. These points were not the point of h=0 and h=180 and asymmetric. In addition, where the colors were same distance from the white point on the CIELAB, the rate of changes in WI and YI by ∆E

w

were depending on hue. Specifically, when WI decreased, YI of reddish and yellowish tinted colors decreased more than bluish tinted colors.

Keywords: color quality, whiteness, yellowness, CIELAB, color difference, hue contribution

Comparison between the Color Properties of Whiteness Index and Yellowness Index on the CIELAB

Hyojin Jung

and Tetsuya Sato

1

Venture Laboratory, Kyoto Institute of Technology, Kyoto, Japan

1

Department of Design Engineering and Management, Kyoto Institute of Technology, Kyoto, Japan

(Received: October 10, 2013 / Revised: November 21, 2013 / Accepted: November 22, 2013)

(2)

tristimulus values and indicate on chromaticity coor- dinates

12)

. Therefore, the purpose of this study was to identify the color properties of whiteness index and yellowness index on the CIELAB through the simula- tions of estimation data.

2. Indexes of whiteness and yellowness

There are many declared measuring methods of whiteness and yellowness based on spectral reflec- tance

13)

. In this study, for the comparison between the color properties of whiteness and yellowness, two standard measurement methods were chosen as following.

In textile industry, the international standard method to estimate the whiteness is according to ISO 105-J02 (Textile-tests for colour fastness- Part J02: Instrumental assessment of relative whiteness)

14)

. This estimation is the CIE whiteness index (WI) as following equation (1);

) (

1700 ) (

800

,10 10 ,10 10

10

x x y y

Y

WI = +

n

− +

n

··· (1)

where Y

10

is the Y-value, χ

10

, y

10

are the chro- maticity coordinates of the sample fabric and χ

n,10

, y

n,10

are the coordinates of the reference white (For CIE D65 standard illuminant / 10° standard observer, χ

n,10

=0.3310, y

n,10

=0.3310). WI lies within the limits given by 40 < WI < (5 y

10

-280)

15)

. This WI has the properties of hue dependence: a bluish fluorescent whitened sample has higher value than yellowish white sample

16)

. WI is able to have more than 100 where the object has tinted bluish.

On the other hand, the method to estimate the yellowness for is according to ASTM 313-00 (Cal- culation Yellowness Indices from Instrumentally Measured Color Coordinates)

17)

. The yellowness index (YI) of an opaque sample is defined as following equation (2);

  



 







··· (2)

where X

10

, Y

10

, and Z

10

are the X-value, Y-value, and Z-value of CIE D65 standard illuminantt / 10°

standard observer. YI has positive value to a yello- wish object, but negative value to a bluish object.

Therefore a negative YI is not estimating yellowness.

The calculated WI is 100, and YI is -0.006 where the object (perfect reflecting diffuser) has the defined tristimulus values X

10

(94.811), Y

10

(100), and Z

10

(107.304) for CIE 1964 standard colorimetric observer for CIE illuminant D65.

3. The CIELAB color space

The CIELAB color space is defined lightness (L*), hue (a* and b*), chroma (C*), and hue angle (h) by the calculations using CIE tristimulus values. In the CIELAB color space, L* has the value from 0 (black) to 100 (white). a* and b* have positive or negative values to indicate a chromatic color: positive a*, negative a*, positive b*, and negative b* point the direction of redness, greenness, yellowness and blueness respectively. Where both a* and b* are 0, the color is an achromatic color. And C* is calculated by the equation (3);

C

8

=(a

*2

+ b

*2

)

1/2

··· (3) and h is calculated by the equation (4);

h=arctan

12)

··· (4)

Accordingly, the perfect colorless white (white point) has the values L*=100, a*=0, b*=0, and C*=0 in theory.

4. Properties of WI and YI on the CIELAB color space

For simulations of estimation data, the CIE tristi- mulus values of the ninety near-white colors (nine hues: R, YR, Y, GY, G, BG, B, PB, and P by ten lightness/chroma grades) as sample colors were applied to coordinate WI and YI on the CIELAB (Figure 1).

The ninety colors have used for the evaluation of whiteness and white cognition in the previous study

6)

. The color samples were made up gradually tinted by the linear relationship between L* and C* of each hue. The relationship between L* and C* was a negative correlation, and the colors on the each hue direction were approximately the same h.

Therefore the coefficients of nine hues could estimate

(3)

Hue R YR Y GY G BG B PB P

  25 73 92 135 175 231 263 291 345

K

C*

-1.07 -1.17 -0.71 -1.10 -1.07 -0.92 -1.61 -1.85 -1.27

Const. 93.69 95.16 94.71 94.35 92.61 93.54 93.38 93.27 93.27

r

2

1.00 0.99 0.99 0.99 0.98 0.99 0.98 1.00 1.00

Table 1. The coefficients and correlation coefficients (r

2

) of the linear function between L* and C* of the color samples of each hue (round off the numbers to two decimal place)

by a linear equation (L* = K

C*

C*+Const.). The regression coefficient (K

C*

) and intercept coefficient (Const.) were depended on hue as shown in Table 1.

Based on the CIE tristimulus values of the 90 color samples, the colors on the nine hue angles were able to estimate by L*, a*, b*, C*, and h values for simulations. Since C* is indicated the distance from an achromatic color point (a*=0, b*=0) on the CIELAB

Figure 1. The 90 color samples in the CIELAB color space.

Figure 2. WI and YI against of b* (blueness (-) - yellowness (+)): for all colors on the nine hues (left) and for only the colors within the WI limits and the positive YI (right).

color space, the colors range of estimation were decided within the C* value 0 < C* < 15.

WI and YI of the nine hues were calculated by the

equations (1) and (2). The results indicated that the

relationship between WI and YI was a negative

correlation generally. In addition, WI and YI of nine

hue directions separated from b*=0 (achromatic color)

as shown in Figure 2 (left).

(4)

There were two main hue groups: R-YR-Y-GY group and BG-B-PB group roughly; those two groups were opposite directions each other. G and P colors were positioned the middle of the two hue groups.

When the absolute value of b* was increasing, WI of the R-YR-Y-GY group, G and P was decreased but WI of the BG-B-PB group was increased. On the other hand, when the absolute value of b* was increasing, YI of the R-YR-Y-GY group and P was increased but YI of the BG-B-PB group and G was decreased. The R-YR-Y-GY group was the colors belong to yellowish or reddish, and the BG-B-PB group was the colors belong to bluish or reddish.

Accordingly, these results were suggested that WI and YI were influenced based on the amount of yellowness-blueness: b*.

WI and YI were compared with ∆E

w

since the WI and YI are the indexes of a white object. ∆E

w

was the color difference from the white point (L*=100, C*=0), E

w

is defined as following equation (5);

∆E

w

  

  

··· (5) The rate of changes in WI and YI by ∆E

w

were depending on hue as shown in Figure 3. Where ∆E

w

=6 which means the color is closer to the white point, WI and YI were nearly same values in the whole hue. However, where ∆E

w

was increased, the contribution rate to WI and YI were diffused by hue.

In addition, there were two hue transition points of rate of changes in WI and YI. These hue transition points were the reference points to divide the hue contribution to WI and YI.

Figure 3. WI and YI against of hue angle (h) corresponding to Ew.

The hue transition points were not the point of h=0 and h=180. The hue transition points of WI were h=208 and h=300, thus the h scope of positive contribution to WI was 92. In other words, the h scope of negative contribution to WI was 268 that is much larger than the positive contribution scope.

On the other hand, the hue transition points of YI were h=157 and h=335, therefore the h scope of positive and negative contribution were 182 and 178 respectively that is nearly the same.

In terms of the measuring concept of WI and YI, there were two considerations: the limits of WI and the negative YI. The limits of WI are to define the range of white color, and negative YI is to indicate that the color is not including yellowness. The WI limits 40 < WI < (5 y

10

-280) was applied to the lower WI of R-YR-Y-GY group, G, P, and the higher WI of BG-B-PB group as shown in Figure 4.

Figure 4. The range of the limits of WI.

(5)

In addition, the applied range of the WI limits was depended on hue. The range of applicable WI was larger to R-YR-Y-GY group than BG-B-PB group.

Therefore, the appropriable colors within the limits of WI and the positive YI (R-YR-Y-GY group and P) estimated to compare the color properties of the WI and YI on the CIELAB as shown in Figure 2 (right).

The results of correlations between WI and YI of the colors within the limits of WI and the positive YI indicated totally a linear relationship of each hue (negative correlations r

2

=0.99) as shown in Figure 5.

Therefore, the WI of each hue was able to calculate by a linear function of YI. The rate of change (slope) of each hue was different. Practically, when WI were decrease, YI of R-YR-Y-GY group were more increased than YI of BG-B-PB group, GY and P.

Figure 5. The correlations between the WI and YI of each hue.

5. Conclusions

In this study, the properties of WI and YI on the CIELAB were identified through the simulations of estimation data. The four points were figured out from this study as followings.

1. The relationship of WI and YI was a negative correlation generally, however the coefficients of correlation function between WI and YI were depended on hue, especially yellowness-blueness.

2. Both WI and YI had two hue transition points,

these points were not the point of h=0 and h=180 and asymmetric.

3. In terms of the measuring concept of WI and YI, there were two considerations: the limits of WI and the negative YI. The applied range and direction of the WI limits was depended on hue. In addition, the range of negative YI was 157 < h < 335.

4. There was a linear relationship of each hue (negative correlations r

2

=0.99) between WI and YI.

The rate of changes in WI and YI by ∆E

w

were depending on hue because the rate of change (slope) of each hue was different.

The obtained results indicated that WI and YI were strongly influenced by hue. In terms of the hue contribution to WI and YI, the direction to yellowness and blueness were more effective than redness and greenness. However the hue transition points were not the point of h=0 and h=180 which are b*=0, and the contribution rates of both directions were asymmetric.

This study was carried on using estimation data of WI and YI. Generally, YI is calculated using the color changes ∆YI from the original white toward yellow.

Therefore, YI may more relate to the color fastness to daylight or to washing and laundering, etc. The colors were not considered the hue direction by the damages. In the further study, it is necessary to understand to the relationship between YI and the color fastness using the practical color samples.

References

1. M. Komaki, Whiteness, A Preference of Japanese People, SEN-I GAKAISHI, 43(5), 178(1987).

2. H. Uchida, Estimation of Whiteness, J. Color Science Association of Japan, 23(3), 176(1999).

3. R. S. Berns, “Billmeyer and Saltzman’s Principles of Color Technology, 3rd ed.”, John Wiley &

Sons, Inc., UK, pp.70-71, 2000.

4. A. Wilfling, Yellowing of Textile during Storage- Investigation of the Yellowing Tendency of Textile Goods, Textile Finishing Chemicals and Packing Material, 33(2), 83(1987).

5. H. Uchida and T. Hukuda, Estimation of Whiteness

(6)

of Fluorescent Whitened Cloths, J. of Color Science Association of Japan, 11(2), 113(1987).

6. H. Jung, S. Kitaguchi, and T. Sato, The Cognition of White Paper and the Possibility of the Pre- diction of the Color Tolerance of Recycled Paper, J. of Color Science Association of Japan, 36(1), 27(2012).

7. H. Jung, H. Suk, S. Kitaguchi, T. Sato, and K.

Kajiwara, Color Tolerance Prediction for Recycled Paper based on Consumers Awareness, Color Research and Application, 37(4), 272(2012).

8. K. Yamauchi and S. Kobayashi, Preventive Effect of Triphosphate on Yellowing of White Fabrics Due to Iron Compounds in Laundering, J. of the Japan Research Association for Textile End-Uses, 22(7), 285(1981).

9. K. Yamauchi and S. Kobayashi, Control of Yellowing of Used White Underwear During Stowing by Using Organic Acids, J. of the Japan Research Association for Textile End-Uses, 35(7), 382(1994).

10. Y. Lu and C. Q. Yang, Fabric Yellowing Caused by Citric Acid as a Crosslinking Agent for Cotton, Textile Research J., 69(9), 685(1999).

11. E. K. C. Park and S. K. Obendorf, Chemical Changes in Unsaturated Oils Upon Aging and Subsequent Effects on Fabric Yellowing and Soil Removal, J. of the American Oil Chemists Society, 71(1), 17(1994).

12. J. Schanda, “Colorimetry Understanding the CIE System”, John Wiley & Sons, Inc., UK, pp.61-64, pp.423-424, 2007.

13. The Color Science Association of Japan, “Hand- book of Color Science, 3rd ed.”, University of Tokyo Press, Japan, pp.593-605, 2011.

14. Japanese Standards Association, “JIS L 1916 Deter- mination of Whiteness for Textiles”, Japan, pp.

1073-1076, 2008.

15. CIE 15: 2004, “Colorimetry, 3rd ed.”, Vienna, CIE Central Bureau, 2004.

16. H. Uchida, A New Whiteness Formula, Color Research and Application, 23(4), 202(1998).

17. Japanese Standards Association, “JIS K 7373 Plastics-

Determination of Yellowness Index and Change

of Yellowness Index”, Japan, pp.1102-1106, 2007.

수치

Table 1. The coefficients and correlation coefficients (r 2 ) of the linear function between L* and C* of the color samples of each hue (round off the numbers to two decimal place)
Figure 3. WI and YI against of hue angle (h) corresponding to Ew. ∆
Figure 5. The correlations between the WI and YI of each hue.

참조

관련 문서

The contemporary music of the twentieth century due to various and new changes in the style of presentation, shows dramatic differences in comparison to

First, it examines the music environment in the 20th century and developmental process of technical improvements and materials used which allowed for the

If both these adjustments are considered, the resulting approach is called a bootstrap-BC a -method (bias- corrected-accelerated). A description of this approach

This paper is one of the series of studies on overseas Chinese in the northern region of Colonial Chosun in the 20th century, which examines the status

This study is to explore why Confucianism has declined in modern China, why Confucianism is reviving in today's China in the 21st century, and what is the mechanism of

1 John Owen, Justification by Faith Alone, in The Works of John Owen, ed. John Bolt, trans. Scott Clark, &#34;Do This and Live: Christ's Active Obedience as the

In summary, in order to detect malicious flows in a target network traffic, the flow correlation index between the target network traffic and the seed flow is calculated,

As a contemporary genre of music in the late 20th century, minimal music has been reputed as a contributor that reconnected composers and the audience.