Association between Growth Differentiation Factor 15 (GDF15) and Cardiovascular Risk in Patients with Newly Diagnosed Type 2 Diabetes Mellitus
We investigated an association between serum Growth Differentiation Factor 15 (GDF15) level and cardiovascular risk in patients with newly diagnosed type 2 diabetes mellitus (T2D). A total of 107 participants were screened for T2D and divided into a T2D group and a control group (without diabetes). We used the Framingham risk score (FRS) and the New Pooled Cohort Equation score to estimate the 10-year risk of atherosclerotic cardiovascular disease. Serum GDF15 levels were measured using an enzyme-linked immunosorbent assay. Correlation analyses were performed to evaluate the associations between GDF15 level and cardiovascular risk scores. The mean serum GDF15 level was elevated in the T2D group compared to the control group (P < 0.001). A positive correlation was evident between serum GDF15 level and age (r = 0.418, P = 0.001), the FRS (r = 0.457, P < 0.001), and the Pooled Cohort Equation score (r = 0.539, P < 0.001). After adjusting for age, LDL-C level, and body mass index (BMI), the serum GDF15 level was positively correlated with the FRS and the New Pooled Cohort Equation score. The serum GDF15 level is independently associated with cardiovascular risk scores of newly diagnosed T2D patients. This suggests that the level of GDF15 may be a useful predictive biomarker of cardiovascular risk in newly diagnosed T2D patients.
Keywords: Growth Differentiation Factor 15; Cardiovascular Disease; Diabetes Mellitus, Type 2
Min Young Shin,* Ji Min Kim,*
Yea Eun Kang, Min Kyeong Kim, Kyong Hye Joung, Ju Hee Lee, Koon Soon Kim, Hyun Jin Kim, Bon Jeong Ku, and Minho Shong Department of Internal Medicine, Chungnam National University School of Medicine, Daejeon, Korea
* Min Young Shin and Ji Min Kim contributed equally to this work.
Received: 1 April 2016 Accepted: 18 May 2016 Address for Correspondence:
Bon Jeong Ku, MD
Department of Internal Medicine, Chungnam National University School of Medicine, 282 Munhwa-ro, Jung-gu, Daejeon 35015, Korea
E-mail: [email protected]
Funding: This work was supported by Chungnam National University Hospital Research Fund, 2014 and the National Research Foundation of Korea (NRF) grant funded by the Korean Government (NRF-2015M3C9A4053400).
http://dx.doi.org/10.3346/jkms.2016.31.9.1413 • J Korean Med Sci 2016; 31: 1413-1418
INTRODUCTION
The atlas of the International Diabetes Federation (IDF) shows that the estimated number of subjects worldwide who will de- velop diabetes by 2013 is 382 million, increasing to 592 million by 2035 (1). The prevalence of diabetes has increased worldwide as life expectancy has become prolonged, the incidence of obe- sity has increased, and lifestyles have changed. Cardiovascular disease (CVD), the principal complication of diabetes, is attrib- utable to all of these risk factors. The incidence and prevalence of, and mortality from, CVD are 2-to 8-fold higher in subjects with diabetes than in those without diabetes (2). Therefore, in- dividual cardiovascular risk assessment of diabetes patients is critical in terms of patient management.
In 1979, the Framingham Risk Score (FRS) equation, based on data from the Framingham Heart Study, was developed. The FRS evaluates age, systolic blood pressure, need for hyperten- sion treatment, smoking status, present diabetes, and levels of high-density lipoprotein cholesterol (HDL-C) and total choles- terol (TC) (3). More recently (in 2013), the New Pooled Cohort Equation, which predicts the risk of atherosclerotic cardiovas-
cular disease (ASCVD), was developed by the American Col- lege of Cardiology (ACC) and the American Heart Association (AHA) (4). Both cardiovascular risk scoring systems are com- monly used worldwide to evaluate the 10-year risk of cardio- vascular disease and to establish management plans. However, the systems are of limited utility when used to score patients with diabetes; diabetes-specific equations must be employed.
Therefore, new biomarkers of cardiovascular risk in patients with diabetes are required.
Growth differentiation factor 15 (GDF15), also termed mac- rophage-inhibiting cytokine 1 (MIC-1), is a member of the trans- forming growth factor-β (TGF-β) superfamily (5). GDF15 is a cytokine released from various cells (including macrophages, cardiomyocytes, and adipocytes) under stressful conditions (6,7). Circulating GDF15 is present in the blood of all individu- als at levels ranging from 150 to 1,150 pg/mL; the level rises dramatically when disease develops (8). The overall and serum GDF15 expression levels increase with age, body mass index (BMI), development of insulin resistance, and development of type 2 diabetes (T2D) (9-11). Higher GDF15 levels are associat- ed with the development of various CVDs, including heart fail- Endocrinology, Nutrition & Metabolism
ure, atrial fibrillation, and acute coronary syndrome (12-14).
Some studies have shown that GDF15 levels are related to the development of obesity and diabetes, and a well-known connec- tion exists between metabolic disorders and CVD levels. How- ever, few reports have explored the relationship between GDF15 levels and CVD in T2D patients. We focused on GDF15 as a mar- ker of whole-body inflammation and, therefore, a possible bio- marker of cardiovascular risk in patients with T2D. We explored the associations between serum GDF15 level and conventional cardiovascular risk scores in patients with newly diagnosed T2D.
We suggest that the GDF15 level reliably predicts the future de- velopment of cardiovascular disease in patients with T2D.
MATERIALS AND METHODS Subjects
A total of 113 participants were recruited from the outpatient clinic of the Division of Endocrinology and Metabolism of Chun- gnam National University Hospital from January 2014 to July 2015. The inclusion criteria were as follows: age > 18 years, a BMI > 18.0 kg/m2, and no previous history of diabetes mellitus.
Six participants were excluded because of malignancies (one case each of stomach and breast cancer), a fatty liver (one case), and prior CVDs (three cases). Finally, 107 participants were as- sessed in terms of diabetes mellitus status using the diagnostic criteria of the American Diabetes Association (15). The partici- pants were divided into two groups: those with newly diagnosed T2D (n = 65) and those who were not diabetic (n = 42).
Clinical and biochemical parameters
On the day on which the study commenced, all participants underwent physical examinations. Height, body weight, waist circumference (WC), systemic blood pressure (SBP), and dia- stolic blood pressure (DBP) were recorded. BMI was calculated as the body weight (kg) divided by the square of the height (m2).
All blood samples were collected in the morning after an over- night fast of more than 8 hours into tubes containing ethylene- diaminetetraacetic acid (EDTA). We measured the levels of fast- ing glucose, C-peptide, insulin, triglycerides, total cholesterol (TC), low-density lipoprotein cholesterol (LDL-C), high-density lipoprotein cholesterol (HDL-C), apolipoprotein B, aspartate aminotransferase (AST), alanine aminotransferase (ALT), blood urea nitrogen (BUN), creatinine, high sensitivity C-reactive pro- tein (hsCRP), and glycosylated hemoglobin (HbA1c). We also performed the 75-g oral glucose tolerance test (OGTT). The ho- meostasis model assessment of insulin resistance (HOMA-IR) was calculated as follows: fasting insulin level (μU/mL) × fast- ing glucose level (in mmol/L)/22.5. The HOMA-beta index was calculated as follows: fasting insulin level (μU/mL) × 20/fasting glucose level (in mmol/L)-3.5.
Definition of metabolic syndrome
We defined metabolic syndrome (MS) and components thereof using the USA Adult Treatment Panel III classification of the Na- tional Cholesterol Education Program guidelines (16).
Assessment of atherosclerotic cardiovascular disease risk To estimate the 10-year risk of ASCVD, we used both the Fram- ingham risk equation (3) and the New Pooled Cohort Equation for ASCVD risk prediction, promulgated in 2013 by reference to the ACC/AHA cardiovascular risk assessment guidelines (4).
GDF15 measurements
Fasting serum GDF15 levels were measured using a quantita- tive sandwich enzyme-linked immunosorbent assay (ELISA) kit (R&D Systems, Minneapolis, MN, USA; Quantikine ELISA kit for human GDF15, catalog No. DGD150). The ELISA quantita- tively immunoassayed human GDF15 levels; the intra-assay coefficient of variation (CV) was < 3% and the inter-assay CV was < 6%.
Statistical analysis
Continuous variables are expressed as the means ± standard deviations (SDs), and the significance of between-group differ- ences was evaluated using Student’s t-test or the Mann-Whit- ney U-test. Categorical variables are expressed as percentages, and between-group differences were compared with the χ2 test.
To evaluate associations between GDF15 level and other vari- ables, we subjected the data to Pearson and partial correlation analyses. A two-tailed P value < 0.05 was regarded as statistical- ly significant. All statistical analyses were performed with SPSS version 21.0 (SPSS Inc., Chicago, IL, USA).
Ethics statement
The protocol for this research was approved by the institutional review board of Chungnam National University Hospital (Reg.
No. CNUH 2014-12-013) and written informed consent was pro- vided to all of the participants.
RESULTS
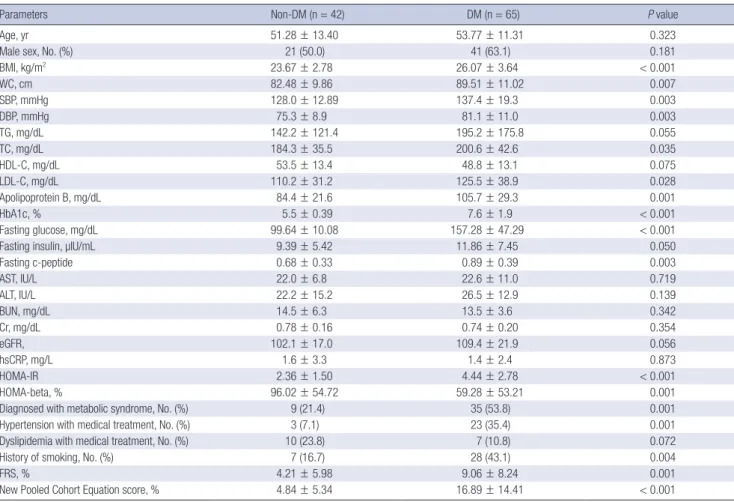
Clinical and biochemical characteristics of study subjects Baseline characteristics of the subjects are shown in Table 1.
The T2D group had a higher BMI and WC; higher levels of SBP, DBP, TC, LDL-C, apolipoprotein B, fasting glucose, and fasting C-peptide; and a greater HOMA-IR than did those without dia- betes. The proportion of patients diagnosed with metabolic syn- drome was higher in the T2D group than in the group without diabetes. The prevalence of both hypertension (under medical treatment) and a history of smoking were higher in the T2D group.
Both the FRS and the New Pooled Cohort Equation scores, re- flecting the 10-year risk for ASCVD development, were signifi-
cantly higher in the T2D group. The serum GDF15 level was significantly higher in the T2D group (643.29 ± 361.39 vs. 210.12
± 142.97 pg/mL) (Fig. 1).
Associations between serum GDF15 level and various variables including ASCVD risk
Correlation analyses were performed to determine associations between GDF15 level and other clinical parameters, including the FRS and the New Pooled Cohort Equation score (Table 2).
Positive correlations were evident between GDF15 level and age (r = 0.277, P = 0.004), WC (r = 0.262, P = 0.03), the HOMA- IR (r = 0.225, P = 0.02), HbA1c level (r = 0.305, P = 0.001), fast- ing plasma glucose level (FPG; r = 0.359, P < 0.001), number of metabolic syndrome components (r = 0.354, P < 0.001), the FRS (r = 0.828, P < 0.001), and the New Pooled Cohort Equa- tion score (r = 0.617, P < 0.001). However, GDF15 level was not correlated with hsCRP level or the estimated glomerular filtra- tion rate. In the T2D group, a positive correlation was evident between serum GDF15 level and age (r = 0.418, P = 0.001), the FRS (r = 0.457, P < 0.001), and the New Pooled Cohort Equa- tion score (r = 0.539, P < 0.001). In contrast, the serum GDF15 level did not correlate with the FRS or the New Pooled Cohort Equation score in the group without diabetes. After adjusting for age, LDL-C level, and BMI, partial correlation analyses show- Fig. 1. The differences of serum growth differentiated factor 15 (GDF15) levels in
control without diabetes and type 2 diabetes (T2D) groups.
*P < 0.001.
GDF15 (pg/mL)
Control group T2D group
2,000 * 1,500
1,000
500
0
Table 1. Clinical and biochemical characteristics of patients with the newly diagnosed T2D and the control without diabetes
Parameters Non-DM (n = 42) DM (n = 65) P value
Age, yr 51.28 ± 13.40 53.77 ± 11.31 0.323
Male sex, No. (%) 21 (50.0) 41 (63.1) 0.181
BMI, kg/m2 23.67 ± 2.78 26.07 ± 3.64 < 0.001
WC, cm 82.48 ± 9.86 89.51 ± 11.02 0.007
SBP, mmHg 128.0 ± 12.89 137.4 ± 19.3 0.003
DBP, mmHg 75.3 ± 8.9 81.1 ± 11.0 0.003
TG, mg/dL 142.2 ± 121.4 195.2 ± 175.8 0.055
TC, mg/dL 184.3 ± 35.5 200.6 ± 42.6 0.035
HDL-C, mg/dL 53.5 ± 13.4 48.8 ± 13.1 0.075
LDL-C, mg/dL 110.2 ± 31.2 125.5 ± 38.9 0.028
Apolipoprotein B, mg/dL 84.4 ± 21.6 105.7 ± 29.3 0.001
HbA1c, % 5.5 ± 0.39 7.6 ± 1.9 < 0.001
Fasting glucose, mg/dL 99.64 ± 10.08 157.28 ± 47.29 < 0.001
Fasting insulin, µIU/mL 9.39 ± 5.42 11.86 ± 7.45 0.050
Fasting c-peptide 0.68 ± 0.33 0.89 ± 0.39 0.003
AST, IU/L 22.0 ± 6.8 22.6 ± 11.0 0.719
ALT, IU/L 22.2 ± 15.2 26.5 ± 12.9 0.139
BUN, mg/dL 14.5 ± 6.3 13.5 ± 3.6 0.342
Cr, mg/dL 0.78 ± 0.16 0.74 ± 0.20 0.354
eGFR, 102.1 ± 17.0 109.4 ± 21.9 0.056
hsCRP, mg/L 1.6 ± 3.3 1.4 ± 2.4 0.873
HOMA-IR 2.36 ± 1.50 4.44 ± 2.78 < 0.001
HOMA-beta, % 96.02 ± 54.72 59.28 ± 53.21 0.001
Diagnosed with metabolic syndrome, No. (%) 9 (21.4) 35 (53.8) 0.001
Hypertension with medical treatment, No. (%) 3 (7.1) 23 (35.4) 0.001
Dyslipidemia with medical treatment, No. (%) 10 (23.8) 7 (10.8) 0.072
History of smoking, No. (%) 7 (16.7) 28 (43.1) 0.004
FRS, % 4.21 ± 5.98 9.06 ± 8.24 0.001
New Pooled Cohort Equation score, % 4.84 ± 5.34 16.89 ± 14.41 < 0.001
Non-DM, control without diabetes; DM, type 2 diabetes group; GDF15, growth differentiation factor-15; BMI, body mass index; WC, waist circumference; TG, triglyceride; TC, total cholesterol; HDL-C, high density lipoprotein cholesterol; LDL-C, low density lipoprotein cholesterol; HbA1c, glycosylated hemoglobin; AST, aspartate transaminase; ALT, ala- nine transaminase; BUN, blood urea nitrogen; Cr, creatinine; eGFR, estimated glomerular filtration rate; hsCRP, high sensitivity C-reactive protein; HOMA-IR, homeostatic model assessment-insulin resistance; HOMA-beta, homeostatic model assessment β-cell function; CVD, cardiovascular disease; CVA, cerebrovascular disease; FRS, Framingham risk score.
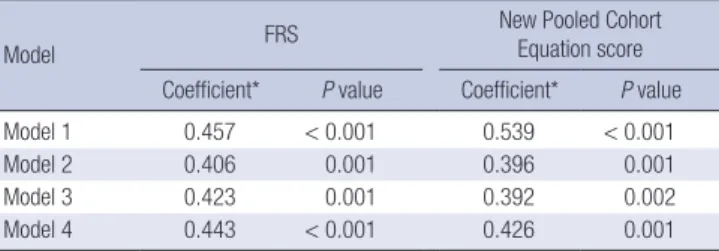
ed that the serum GDF15 level was significantly (positively) cor- related with both the FRS and the New Pooled Cohort Equation score (Table 3). In the T2D group except for seven patients who taking drugs for dyslipidemia, partial correlation analyses also showed that the serum GDF15 level was significantly correlated with both the FRS and the New Pooled Cohort Equation score (data not shown).
DISCUSSION
We found that the serum GDF15 level correlated with represen- tative indices of the future risk of CVD in newly diagnosed T2D patients. The mean GDF15 level was higher in the T2D group than in the group without diabetes (Fig. 1). Serum GDF15 levels were correlated with HOMA-IR, HbA1c level, and fasting glu- cose level. These associations were statistically significant and consistent with the results of previous studies (11,17). However, there was negative correlation between LDL-C and GDF15. Pre- vious studies have found the same result and suggest that GDF15 is associated with different LDL-C subtypes (18). In the T2D group, we found that the serum GDF15 level was correlated with both the FRS and the New Pooled Cohort Equation score, which measures the 10-year risk of CVD. Apart from these scores, age was the single most important variable that correlated with serum GDF15 level in the T2D group. We found consistent cor- relations between the serum GDF15 level and cardiovascular risk scores after adjusting for age in the T2D group, but not in the control (without diabetes) group. However, we found no
positive correlation between serum GDF15 and high-sensitivity C-reactive protein (hsCRP) levels; the latter reflects the extent of inflammation in both atherosclerosis and diabetes (19,20).
Some reports have found that the serum GDF15 level was highest in T2D patients, lowest in patients without diabetes, and intermediate in individuals with prediabetes (11,20). More- over, serum GDF15 levels were inversely correlated with insulin sensitivity and positively correlated with dyslipidemia (11,21).
Associations between GDF15 levels and various types of CVD have been reported in general populations (12,14,22). The GDF15 level was prognostic of heart failure (12), associated with recur- rent adverse events after the development of acute coronary syndrome (14), and was suggested to serve as a useful novel biomarker of mortality in patients with non-ST-elevation myo- cardial infarction (22). More recently, the level of GDF15 has been suggested to be a useful predictive biomarker of diabetic cardiomyopathy in T2D patients (23). Therefore, the GDF15 level may usefully predict both insulin resistance and metabolic dysfunction.
Although the details on how GDF15 expression is controlled remain largely unknown, we offer a speculative explanation of our present results. The components of the FRS and the New Pooled Cohort Equation score are similar: age, total cholesterol and HDL-C levels, systemic blood pressure, hypertension, the presence or absence of diabetes, and smoking history. All of these components are well-known risk factors for CVD in pa- tients with diabetes. In the present study, each component was significantly correlated with serum GDF15 level in the T2D group.
However, we found no correlation between the serum GDF15 level and components of the cardiovascular risk scores in pa- tients without diabetes. Together, these data suggest that the se- rum GDF15 level may be a useful biomarker for the estimation of CVD risk in T2D patients.
To the best of our knowledge, this is the first study to investi- gate an association between serum GDF15 level and cardiovas- cular risk in T2D patients. We examined newly diagnosed T2D patients who were drug-naïve to exclude any possible bias caus- Table 2. Pearson’s correlation coefficient between the differences in GDF-15 levels
and the differences in various variables
Variables Total DM Non-DM
Age 0.277* 0.418* -0.087
WC 0.262* 0.035 0.274
BMI 0.108 -0.199 0.297
SBP 0.338* 0.244 0.212
HOMA-IR 0.225* -0.030 0.124
HbA1c 0.305* -0.060 0.066
Fasting glucose 0.359* 0.010 -0.010
Fasting c-peptide 0.115 -0.114 0.192
Fasting insulin 0.067 -0.086 0.159
TC -0.016 -0.204 -0.017
LDL-C -0.079 -0.298* -0.082
HDL-C -0.075 0.020 0.098
No. of metabolic syndrome components† 0.354* 0.067 0.258
FRS 0.458* 0.457* -0.104
New Pooled Cohort Equation score 0.617* 0.539* -0.058 DM, type 2 diabetes group; Non-DM, control without diabetes; GDF15, growth differ- entiation factor-15; WC, waist circumference; BMI, body mass index; SBP, systolic blood pressure; HOMA-IR, homeostatic model assessment-insulin resistance; HbA1c, glycosylated hemoglobin; TC, total cholesterol; LDL-C, low density lipoprotein choles- terol; HDL-C, high density lipoprotein cholesterol; FRS, Framingham risk score.
*P < 0.05; †Zero to five factors are defined by NCEP-ATP III clinical identification of metabolic syndrome; waist circumference, blood pressure, triglycerides, HDL choles- terol, and fasting glucose level.
Table 3. Association of serum GDF15 with FRS and New Pooled Cohort Equation score in type 2 diabetes group
Model FRS New Pooled Cohort
Equation score Coefficient* P value Coefficient* P value
Model 1 0.457 < 0.001 0.539 < 0.001
Model 2 0.406 0.001 0.396 0.001
Model 3 0.423 0.001 0.392 0.002
Model 4 0.443 < 0.001 0.426 0.001
Model 2, adjustment for age; Model 3, adjustment for age and LDL-C; Model 4, ad- justment for age, LDL-C and BMI.
GDF15, growth differentiation factor-15; LDL-C, low density lipoprotein cholesterol;
FRS, Framingham risk score.
*Pearson correlation coefficients were used to assess the relationship between vari- ables.
ed by underestimating hyperglycemia in patients who were med- icated. In addition, we excluded participants with any prior his- tory of CVD. Thus, no patient had any CVD, which is a long-term macrovascular complication of T2D.
Our study had some limitations. First, the precise mechanism of GDF15 expression and the signaling pathways involved re- main unclear. Second, we did not perform a long-term follow- up analysis. A large-scale prospective study is needed to con- firm that serum GDF15 level predicts cardiovascular risk of T2D patients.
In conclusion, we observed independent associations between the serum GDF15 level and conventional cardiovascular risk prediction scores in newly diagnosed T2D patients. This sug- gests that the serum GDF15 level may be a more useful clinical biomarker than the present conventional scoring systems, esti- mating later cardiovascular risk in early-stage T2D patients with- out any long-term complications of CVD.
DISCLOSURE
The authors have no potential conflicts of interest to disclose.
AUTHOR CONTRIBUTION
Research conception & design: Shin MY, Kim JM, Ku BJ, Shong M. Data acquisition: Shin MY, Kim JM, Kang YE. Data analysis and interpretation: Shin MY, Kim JM, Kim MK, Joung KH, Lee JH, Kim KS, Kim HJ, Ku BJ. Data review: Kim JM, Kim HJ, Ku BJ, Shong M. Drafting of the manuscript: Shin MY, Kim JM. Receiv- ing grant: Ku BJ. Approval of final manuscript: all authors.
ORCID
Min Young Shin http://orcid.org/0000-0002-7094-5451 Ji Min Kim http://orcid.org/0000-0002-0177-1849 Yea Eun Kang http://orcid.org/0000-0002-2012-3716 Min Kyeong Kim http://orcid.org/0000-0002-0349-0194 Kyong Hye Joung http://orcid.org/0000-0001-6674-9506 Ju Hee Lee http://orcid.org/0000-0001-5976-7175 Koon Soon Kim http://orcid.org/0000-0002-5545-2093 Hyun Jin Kim http://orcid.org/0000-0002-6760-4963 Bon Jeong Ku http://orcid.org/0000-0002-3414-8949 Minho Shong http://orcid.org/0000-0002-0247-7115 REFERENCES
1. Guariguata L, Whiting DR, Hambleton I, Beagley J, Linnenkamp U, Shaw JE. Global estimates of diabetes prevalence for 2013 and projections for 2035. Diabetes Res Clin Pract 2014; 103: 137-49.
2. Grundy SM, Howard B, Smith S Jr, Eckel R, Redberg R, Bonow RO. Pre- vention conference VI: diabetes and cardiovascular disease: executive
summary: conference proceeding for healthcare professionals from a special writing group of the American Heart Association. Circulation 2002; 105: 2231-9.
3. Lloyd-Jones DM, Wilson PW, Larson MG, Beiser A, Leip EP, D’Agostino RB, Levy D. Framingham risk score and prediction of lifetime risk for cor- onary heart disease. Am J Cardiol 2004; 94: 20-4.
4. Goff DC Jr, Lloyd-Jones DM, Bennett G, Coady S, D’Agostino RB Sr, Gib- bons R, Greenland P, Lackland DT, Levy D, O’Donnell CJ, et al. 2013 ACC/
AHA guideline on the assessment of cardiovascular risk. J Am Coll Car- diol 2014; 63: 2935-59.
5. Bootcov MR, Bauskin AR, Valenzuela SM, Moore AG, Bansal M, He XY, Zhang HP, Donnellan M, Mahler S, Pryor K, et al. MIC-1, a novel macro- phage inhibitory cytokine, is a divergent member of the TGF-β superfam- ily. Proc Natl Acad Sci U S A 1997; 94: 11514-9.
6. Bermúdez B, López S, Pacheco YM, Villar J, Muriana FJ, Hoheisel JD, Bau- er A, Abia R. Influence of postprandial triglyceride-rich lipoproteins on lipid-mediated gene expression in smooth muscle cells of the human coronary artery. Cardiovasc Res 2008; 79: 294-303.
7. Ding Q, Mracek T, Gonzalez-Muniesa P, Kos K, Wilding J, Trayhurn P, Bing C. Identification of macrophage inhibitory cytokine-1 in adipose tissue and its secretion as an adipokine by human adipocytes. Endocrinology 2009; 150: 1688-96.
8. Brown DA, Breit SN, Buring J, Fairlie WD, Bauskin AR, Liu T, Ridker PM.
Concentration in plasma of macrophage inhibitory cytokine-1 and risk of cardiovascular events in women: a nested case-control study. Lancet 2002; 359: 2159-63.
9. Simm A, Nass N, Bartling B, Hofmann B, Silber RE, Navarrete Santos A.
Potential biomarkers of ageing. Biol Chem 2008; 389: 257-65.
10. Vila G, Riedl M, Anderwald C, Resl M, Handisurya A, Clodi M, Prager G, Ludvik B, Krebs M, Luger A. The relationship between insulin resistance and the cardiovascular biomarker growth differentiation factor-15 in obese patients. Clin Chem 2011; 57: 309-16.
11. Hong JH, Chung HK, Park HY, Joung KH, Lee JH, Jung JG, Kim KS, Kim HJ, Ku BJ, Shong M. GDF15 is a novel biomarker for impaired fasting glu- cose. Diabetes Metab J 2014; 38: 472-9.
12. Anand IS, Kempf T, Rector TS, Tapken H, Allhoff T, Jantzen F, Kuskowski M, Cohn JN, Drexler H, Wollert KC. Serial measurement of growth-differ- entiation factor-15 in heart failure: relation to disease severity and prog- nosis in the valsartan heart failure trial. Circulation 2010; 122: 1387-95.
13. Wallentin L, Hijazi Z, Andersson U, Alexander JH, De Caterina R, Hanna M, Horowitz JD, Hylek EM, Lopes RD, Asberg S, et al. Growth differentia- tion factor 15, a marker of oxidative stress and inflammation, for risk as- sessment in patients with atrial fibrillation: insights from the apixaban for reduction in stroke and other thromboembolic events in atrial fibrillation (ARISTOTLE) trial. Circulation 2014; 130: 1847-58.
14. Bonaca MP, Morrow DA, Braunwald E, Cannon CP, Jiang S, Breher S, Sa- batine MS, Kempf T, Wallentin L, Wollert KC. Growth differentiation fac- tor-15 and risk of recurrent events in patients stabilized after acute coro- nary syndrome: observations from PROVE IT-TIMI 22. Arterioscler Thromb Vasc Biol 2011; 31: 203-10.
15. American Diabetes Association. (2) Classification and diagnosis of dia- betes mellitus. Diabetes Care 2015; 38 Suppl: S8-16.
16. Grundy SM, Cleeman JI, Daniels SR, Donato KA, Eckel RH, Franklin BA, Gordon DJ, Krauss RM, Savage PJ, Smith SC Jr, et al. Diagnosis and man- agement of the metabolic syndrome: an American Heart Association/
National Heart, Lung, and Blood Institute Scientific Statement. Circula- tion 2005; 112: 2735-52.
17. Kempf T, Guba-Quint A, Torgerson J, Magnone MC, Haefliger C, Bobadil- la M, Wollert KC. Growth differentiation factor 15 predicts future insulin resistance and impaired glucose control in obese nondiabetic individu- als: results from the XENDOS trial. Eur J Endocrinol 2012; 167: 671-8.
18. Ho JE, Mahajan A, Chen MH, Larson MG, McCabe EL, Ghorbani A, Cheng S, Johnson AD, Lindgren CM, Kempf T, et al. Clinical and genetic corre- lates of growth differentiation factor 15 in the community. Clin Chem 2012; 58: 1582-91.
19. Gungor N, Thompson T, Sutton-Tyrrell K, Janosky J, Arslanian S. Early signs of cardiovascular disease in youth with obesity and type 2 diabetes. Dia- betes Care 2005; 28: 1219-21.
20. Navarro JF, Mora C, Maca M, Garca J. Inflammatory parameters are inde-
pendently associated with urinary albumin in type 2 diabetes mellitus.
Am J Kidney Dis 2003; 42: 53-61.
21. Karczewska-Kupczewska M, Kowalska I, Nikolajuk A, Adamska A, Otzi- omek E, Gorska M, Straczkowski M. Hyperinsulinemia acutely increases serum macrophage inhibitory cytokine-1 concentration in anorexia ner- vosa and obesity. Clin Endocrinol (Oxf) 2012; 76: 46-50.
22. Wollert KC, Kempf T, Peter T, Olofsson S, James S, Johnston N, Lindahl B, Horn-Wichmann R, Brabant G, Simoons ML, et al. Prognostic value of growth-differentiation factor-15 in patients with non-ST-elevation acute coronary syndrome. Circulation 2007; 115: 962-71.
23. Dominguez-Rodriguez A, Abreu-Gonzalez P, Avanzas P. Usefulness of growth differentiation factor-15 levels to predict diabetic cardiomyopa- thy in asymptomatic patients with type 2 diabetes mellitus. Am J Cardiol 2014; 114: 890-4.