http://e-nrp.org
Is the association of continuous metabolic syndrome risk score with body mass index independent of physical activity? The CASPIAN-III study
Ramin Heshmat
1, Gita shafiee
1, Roya Kelishadi
2, Amir Eslami Shahr Babaki
3, Mohammad Esmaeil Motlagh
4, Tahereh Arefirad
5, Gelayol Ardalan
2, Asal Ataie-Jafari
6, Hamid Asayesh
7, Rasool Mohammadi
8and Mostafa Qorbani
9,1§1Chronic Diseases Research Center, Endocrinology and Metabolism Population Sciences Institute, Tehran University of Medical Sciences, Tehran, Iran
2Child Growth and Development Research Center, Research Institute for Primordial Prevention of Non-communicable Disease, Isfahan University of Medical Sciences, Isfahan, Iran
3Research Department, Tehran Heart Center, Tehran University of Medical Sciences, Tehran, Iran
4Department of Pediatrics, Ahvaz Jundishapur University of Medical Sciences, Ahvaz, Iran
5Department of Exercise Physiology, Science and Research Branch, Islamic Azad University, Tehran, Iran
6Department of Nutrition, Faculty of Medicine, Science and Research Branch, Islamic Azad University, Tehran, Iran
7Department of Medical Emergencies, Qom University of Medical Sciences, Qom, Iran
8Department of Epidemiology, School of Public Health, Shahid Beheshti University of Medical Sciences, Tehran, Iran
9Department of Community Medicine, School of Public Health, Alborz University of Medical Sciences, Baghestan Boulevard, 31485/56, Karaj, Iran
BACKGROUND/OBJECTIVES: Although the association of body mass index (BMI) with metabolic syndrome (MetS) is well documented, there is little knowledge on the independent and joint associations of BMI and physical activity with MetS risk based on a continuous scoring system. This study was designed to explore the effect of physical activity on interactions between excess body weight and continuous metabolic syndrome (cMetS) in a nationwide survey of Iranian children and adolescents.
SUBJECTS/METHODS: Data on 5,625 school students between 10 and 18 years of age were analyzed. BMI percentiles, screen time activity (STA), leisure time physical activity (LTPA) levels, and components of cMetS risk score were extracted. Standardized residuals (z-scores) were calculated for MetS components. Linear regression models were used to study the interactions between different combinations of cMetS, LTPA, and BMI percentiles.
RESULTS: Overall, 984 (17.5%) subjects were underweight, whereas 501 (8.9%) and 451 (8%) participants were overweight and obese, respectively. All standardized values for cMetS components, except fasting blood glucose level, were directly correlated with BMI percentiles in all models (P-trend < 0.001); these associations were independent of STA and LTPA levels. Linear associations were also observed among LTPA and standardized residuals for blood pressure, high-density lipoprotein, and waist circumference (P-trend < 0.01).
CONCLUSIONS: Our findings suggest that BMI percentiles are associated with cMetS risk score independent of LTPA and STA levels.
Nutrition Research and Practice 2015;9(4):404-410; doi:10.4162/nrp.2015.9.4.404; pISSN 1976-1457 eISSN 2005-6168
Keywords: BMI, metabolic syndrome, physical activity
INTRODUCTION
*Metabolic Syndrome (MetS) is a cluster of risk factors that confers increased risks for cardiovascular disease and type 2 diabetes compared to its individual components [1]. The prevalence of MetS has increased in the adult population worldwide [2]. The lack of a common definition for MetS in the pediatric age group may be the cause of controversial findings across epidemiologic studies as well as the low prevalence of MetS in some populations [3-5]. Therefore, the American
Diabetes Association (ADA) and the European Association for the Study of Diabetes (EASD) have suggested using continuous Metabolic Syndrome (cMetS) risk score for studies on associa- tions between MetS and potential risk factors in children and adolescents [6].
Some studies suggest using cMetS risk score instead of the binary definition in epidemiologic studies [7,8]. Using a conti- nuous system for scoring is proposed to have the following advantages: a) cardiovascular and diabetes risk is a progressive function of several other risk factors of metabolic syndrome;
The authors are thankful of the large team working on this study and all participants and their families in different provinces.
§Corresponding Author: Mostafa Qorbani, Tel. 009821-88913543, Fax. 009821-88808082, Email. [email protected] Received: November 2, 2013, Revised: March 16, 2015, Accepted: April 19, 2015
This is an Open Access article distributed under the terms of the Creative Commons Attribution Non-Commercial License (http://creativecommons.org/licenses/by-nc/3.0/) which permits unrestricted non-commercial use, distribution, and reproduction in any medium, provided the original work is properly cited.
this nullifies the need to configure dichotomous variables [9];
b) increasing statistical power; and c) compared to dichotomous approach, cMetS risk score is more sensitive and less error- prone [9-11]. Different statistical methods have been devised to determine a continuous score. Previous methods used to drive a comment's score include principal components [12], z-scores [13-15], and percentile rankings [16]. Few studies have examined the construct validity of cMetS value and its association with MetS in children and adolescence [17,18]. In a previous study, we assessed the validity of cMetS score in a nationally representative sample of Iranian children and identified the sex and age-specific optimal cutoff-points of cMetS associated with MetS.
Many studies have demonstrated that excess weight from early life as well as physical inactivity significantly contribute to the development of MetS during childhood and adolescence [19,20]. In adults, some evidence suggests that MetS is modified by physical activity. Although the association of body mass index (BMI) with MetS is well-documented, there is little knowledge on the independent and joint associations of BMI and physical activity with MetS risk based on a continuous scoring system [19]. Therefore, the aim of this study was to determine the associations of BMI percentiles and leisure time physical inactivity (LTPA) with cMetS risk score in a nationally representative sample of Iranian children and adolescents.
SUBJECTS AND METHODS Sample
Data for this study were collected from the third survey of the school-based surveillance system entitled “Childhood and Adolescence Surveillance and PreventIon of Adult Non- communicable Disease” (CASPIAN), which was conducted in 2009 and 2010. Descriptions of the method and operation of the survey have been described before [21]. The study was approved by the ethical committee and other relevant national regulatory organizations.
The present study was performed among 5,625 students aged 10-18 years. Data on some variables were missing in some students; therefore, students with available data were included in the statistical analysis. Students were selected via multistage random cluster sampling method from urban and rural areas of 27 provinces in Iran. Eligible schools in our study were stratified according to the information bank of the Ministry of Health and Medical Education, and they were selected randomly.
In selected schools, students were also selected randomly.
Sampling and examinations were begun after complete explanation of the study’s objectives and protocols for students and their parents by obtaining written informed consent from parents and also oral consent from students. A team of trained health care professionals recorded information in a checklist and carried out examinations according to standard protocols using calibrated instruments.
Clinical and laboratory measurements
Height (Ht) and weight (Wt) were measured to the nearest 0.1 kg and 0.1 cm, respectively, without shoes and with light clothing. Body mass index [BMI = weight (kg) ⁄height (m
2)] was
calculated, and waist circumference (WC) was measured midway between the lower border of the rib margin and the iliac crest at the end of normal expiration. WC and height were measured using a non-elastic tape.
Two measurements of systolic blood pressure (SBP) and diastolic blood pressure (DBP) were performed using a standar- dized mercury sphygmomanometer on the right arm after a 15-minute rest in a sitting position; the first and fifth Korotkoff sounds were recorded as systolic and diastolic BP, respectively.
The mean of the two measurements was considered as the subject’s blood pressure. Mean arterial pressure (MAP) was calculated using the following formula: MAP = [(SBP-DBP)/3] +
DBP.
Venous blood samples were drawn after 12 to 14 hours of overnight fasting from all study participants and delivered to the laboratory on the same day. Fasting blood glucose (FBG), total cholesterol (TC), high density lipoprotein-cholesterol (HDL- C), and triglycerides (TG) were measured enzymatically by auto-analyzers. HDL-C was determined after dextran sulfate- magnesium chloride precipitation of non-HDL-C [22]. Since collection of the highest quality data was critical to the success of our multi-center project, the Data and Safety Monitoring Board (DSMB) of the project considered different levels of quality assurance and control.
Definition of terms BMI categories
The BMI cutoffs were provided by the Centers of Disease Control and Prevention (CDC) [23]. Participants were divided into underweight (BMI < 5
thpercentile of the study population), normal (5-84
thpercentile), overweight (85-94
thpercentile), and obese (> 95
thpercentile) [24,25].
Screen time and physical activity
The screen time behavior of children was assessed by a questionnaire that asked the child to report the average number of hours per day spent watching TV/VCDs, personal computer (PC), and electronic games (EG). Screen time activity (STA) was categorized into two groups (less than 2 hours per day and equal or more than 2 hours) based on international screen time recommendations [26,27].
In this study, we collected the leisure time physical activity of participants in the prior week using a validated questionnaire [28]. Children reported their weekly frequency (None, 1-2 days, 3-6 days, everyday) of leisure time physical activity outside of school that lasted at least 30 minutes and caused heavy sweating or large increases in breathing or heart rate. For statistical analysis, each weekly frequency received a degree (0-2 days per week (Mild), 3-5 days per week (Moderate), and 6-7 days (Severe)) [20].
Continuous Mets (cMetS) score
We have previously published the methodology of the cMetS
score calculation in detail [29]. In brief, the cMetS score was
computed by standardizing the residuals (z-scores) of WC, MAP,
HDL-C, TG, and FBG by regressing them according to age and
sex to account for age and gender-related differences. HDL-C
Variables BMI levels
P-value
Underweight Normal weight Overweight Obese
N (%) 984 (17.5) 3689 (65.6) 451 (8.0) 501 (8.9)
Age (yrs) 14.2 ± 2.3 14.9 ± 2.4 14.7 ± 2.3 14.4 ± 2.3 < 0.0011)
Weight (kg) 34.1 ± 8.1 46.4 ± 12.1 58.9 ± 13.5 67.7 ± 16.7 < 0.0012)
Height (cm) 149.8 ± 13.3 155.0 ± 13.9 156.3 ± 12.9 154.9 ± 14.6 < 0.0013)
BMI (kg/m2) 14.9 ± 1.3 19.0 ± 2.4 23.7 ± 2.1 27.8 ± 3.5 < 0.0012)
Waist circumference (cm) 60.9 ± 24.5 67.7 ± 19.9 76.2 ± 10.7 84.6 ± 13.0 < 0.0012)
Waist to height ratio 0.4 ± 0.2 0.4 ± 0.1 0.5 ± 0.1 0.5 ± 0.1 < 0.0012)
Sex (%)
Male 498 (50.6) 1,775 (48.1) 265 (58.8) 286 (57.1) < 0.001
Female 486 (49.4) 1,914 (51.9) 186 (41.2) 215 (42.9)
Living Place (%)
Urban 612 (63.3) 2448 (68.3) 347 (80.5) 378 (78.8) < 0.001
Rural 355 (36.7) 1,136 (31.7) 84 (19.5) 102 (21.2)
Family history of (%)
Diabetes 229 (31.1) 992 (35.7) 148 (44.0) 179 (48.4) < 0.001
Obesity 244 (33.3) 1,043 (39.0) 156 (48.4) 180 (54.5) < 0.001
Hyperlipidemia 292 (39.1) 1,139 (40.6) 149 (44.3) 188 (50.3) 0.001
Hypertension 386 (50.4) 1,388 (48.2) 192 (54.1) 207 (53.4) 0.06
STA (%)
< 2 h/day 542 (57.6) 1,930 (53.9) 217 (49.2) 257 (52.8) 0.03
≥ 2h/day 399 (42.4) 1,649 (46.1) 224 (50.8) 230 (47.2)
Physical activity (%)
Mild 273 (30.9) 1,104 (33.1) 161 (39.2) 157 (34.3) 0.03
Moderate 283 (32.0) 1,109 (33.3) 128 (31.1) 161 (35.2)
severe 328 (37.1) 1,119 (33.6) 122 (29.7) 140 (30.6)
Father’s education (%)
< 6 yrs 454 (47.5) 1,567 (43.6) 132 (30.8) 138 (29.2) < 0.001
6-9 yrs 230 (24.1) 868 (24.1) 116 (27.1) 116 (24.5)
> 9-12 yrs 198 (20.7) 838 (23.3) 127 (29.7) 148 (31.3)
> 12 yrs 74 (7.7) 322 (9.0) 53 (12.4) 71 (15.0)
Mother’s education (%)
< 6 yrs 561 (58.0) 2,072 (57.2) 196 (45.0) 175 (36.7) < 0.001
6-9 yrs 216 (22.3) 701 (19.3) 96 (22.0) 115 (24.1)
> 9-12 yrs 163 (16.8) 670 (18.5) 115 (26.4) 156 (32.7)
> 12 yrs 28 (2.9) 181 (5.0) 29 (6.7) 31 (6.5)
Father’s occupation (%)
Employed/office work 217 (22.8) 782 (22.1) 119 (28.1) 127 (27.1) < 0.001
Agriculturist 107 (11.3) 478 (13.5) 33 (7.8) 24 (5.1)
Workman/labor 255 (26.8) 778 (22.0) 78 (18.4) 79 (16.8)
Self-employed 297 (31.3) 1,283 (36.3) 169 (40.0) 212 (45.2)
Workless 74 (7.8) 217 (6.1) 24 (5.7) 27 (5.8)
Mother’s occupation (%)
Employed/office work 33 (3.4) 213 (5.9) 31 (7.2) 41 (8.5) 0.006
Workwoman/labor 16 (1.7) 36 (1.0) 6 (1.4) 10 (2.1)
Housewife 900 (93.5) 3,294 (91.0) 389 (89.8) 419 (87.1)
Others 14 (1.4) 78 (2.1) 7 (1.6) 11 (2.3)
Type of home (%)
Personal home 745 (78.8) 2,876 (81.3) 328 (77.5) 363 (77.7) 0.06
Rented home 200 (21.2) 663 (18.7) 95 (22.5) 104 (22.3)
Personal car (%)
Yes 424 (44.4) 1,760 (48.9) 259 (59.7) 270 (57.2) < 0.001
No 532 (55.6) 1,839 (51.1) 175 (40.3) 202 (42.8)
n (%) or mean±SD
1)According to Tukey post hoc test, the difference between underweight with normal and overweight is significant.
2)According to Tukey post hoc test, all groups have significant differences with each other.
3)According to Tukey post hoc test, all groups have significant differences with the underweight group.
Table 1. Basic anthropometric and demographic characteristics according to BMI levels in Iranian adolescents : the CASPIAN III study
Variables BMI categories LTPA categories STA categories Underweight Normal weight Overweight Obese P-trend Mild Moderate Severe P-trend < 2 h/day ≥ 2 h/day P-trend Z_MAP -0.28 ± 1.00 -0.02 ± 0.97 0.21 ± 0.95 0.51 ± 0.99 < 0.001 0.05 ± 0.98 -0.03 ± 1.01 -0.03 ± 1.00 0.03 -0.02 ± 1.00 0.01 ± 0.98 0.17 Z_TG -0.22 ± 0.72 -0.07 ± 0.89 0.20 ± 1.10 0.76 ± 1.54 < 0.001 0.04 ± 1.06 -0.01 ± 0.97 -0.02 ± 0.97 0.08 -0.02 ± 0.97 0.03 ± 1.03 0.09 Z_FBG -0.01 ± 0.91 -0.01 ± 0.98 0.05 ± 1.42 0.08 ± 0.87 0.08 -0.04 ± 1.10 0.06 ± 0.94 0.003 ± 0.99 0.3 0.02 ± 0.97 -0.01 ± 1.05 0.36 Z_WC -0.34 ± 1.20 -0.07 ± 0.96 0.38 ± 0.46 0.82 ± 0.56 < 0.001 0.04 ± 1.01 -0.001 ± 1.08 -0.03 ± 1.00 0.03 -0.01 ± 1.11 0.02 ± 0.89 0.33 Z_HDL 0.09 ± 1.04 0.03 ± 1.02 -0.21 ± 0.82 -0.21 ± 0.81 < 0.001 -0.11 ± 1.01 0.07 ± 1.01 0.08 ± 1.01 < 0.001 0.05 ± 1.01 -0.05 ± 1.00 0.002 cMetS -1.05 ± 1.98 -0.25 ± 2.23 1.06 ± 2.42 2.30 ± 2.54 < 0.001 0.11 ± 2.64 -0.08 ± 2.34 -0.19 ± 2.32 0.004 -0.11 ± 2.35 0.03 ± 2.52 0.08 BMI: Body mass index; LTPA: leisure time physical activity; STA: screen time activity; MAP: mean arterial pressure; TG: triglyceride; FBS: fasting blood glucose; WC: waist circumference; HDL: high-density lipoprotein; cMetS: continuous metabolic syndrome; Z, standardized components of cMetS
Table 2. Mean values of standardized components of cMetS in Iranian adolescents according to BMI, LTPA, and STA categories in Iranian adolescents: the CASPIAN-III study
Variables Z_MAP Z_TG Z_FBG Z_WC Z_HDL-C cMetS
Model I1) BMI percentiles 0.26* 0.32* 0.03 0.39* -0.12* 1.13*
LTPA -0.04* -0.03 0.02 -0.04* 0.10* -0.15*
Model II2) BMI percentiles 0.26* 0.32* 0.03 0.39* -0.12* 1.14*
LTPA -0.04* -0.03 0.02 -0.04* 0.10* -0.17*
Model III3) BMI percentiles 0.27* 0.32* 0.02 0.36* -0.13* 1.11*
LTPA -0.05 -0.02 0.04 -0.02 0.10* -0.12
Model IV4) BMI percentiles 0.26* 0.32* 0.01 0.36* -0.13* 1.10*
LTPA -0.02 -0.02 0.05 -0.02 0.16* -0.18
Model V5) BMI percentiles 0.29* 0.39* < 0.001 0.45* -0.20* 1.07*
LTPA 0.001 0.05 0.04 0.06 0.10 -0.21
BMI percentiles*LTPA -0.01 -0.03 0.006 -0.04 0.03 0.02
1)Without adjusted (crude models)
2)Adjusted for age and sex
3)Additionally adjusted for living place, family history of chronic disease, mother’s education, father’s education, socioeconomic status, STA
4)In addition to Model III variables, BMI percentiles, and LTPA are simultaneously in the model
5)In addition to Model III variables, BMI percentiles, and LTPA interaction is in model
BMI: Body mass index; LTPA: leisure time physical activity; BMI percentiles * LTPA: Interaction term between BMI and LTPA; MAP, mean arterial pressure; TG: triglyceride;
FBS: fasting blood glucose; WC: waist circumference; HDL: high density lipoprotein; cMetS: continuous metabolic syndrome; Z, standardized components of cMetS Values are Betas. *P< 0.05
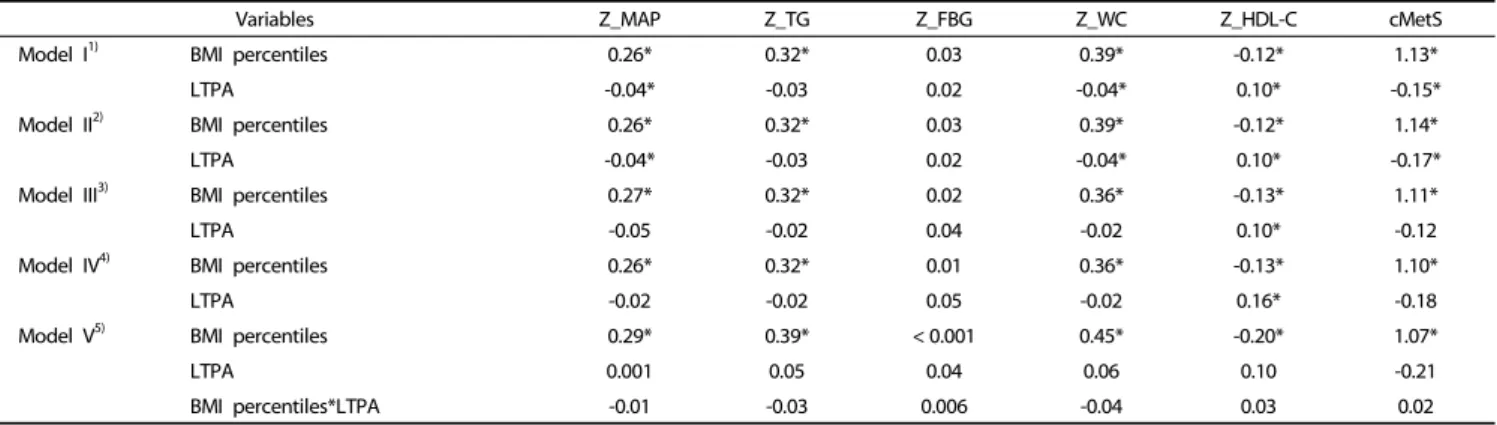
Table 3. Associations of BMIpercentiles and LTPA with standardized components of cMetS in Iranian adolescents in linear regression model: the CASPIAN-III study
was multiplied by -1, as it is inversely related to MetS risk. A higher cMetS score indicates a less favorable metabolic profile [30].
Statistical analysis
Data were analyzed by using SPSS software package (version 16.0; SPSS Inc., Chicago, IL, USA); P-values less than 0.05 were considered as statistically significant. All variables were checked for normality.
Findings on continuous variables were expressed as means
± standard deviation (SD), and categorical data were expressed as a percentage. The ANOVA test was applied to compare the mean differences of variables between BMI categories. Tukey’s post hoc method was used for pair wise comparisons. Student’s two-tailed t was used to compare the mean differences of cardiometabolic z-scores across the screen time activity categories. The association between categorical variables was assessed by the Chi square test.
Linear regression models were performed for each dependent variable (cMetS and its components). In model I, the crude association of BMI percentiles with cMetS and its components as well as the association of LTPA with cMetS and its com- ponents were analyzed. In models 2 and 3, the adjusted
association of BMI percentiles with cMetS and its components as well as the association of leisure time physical activity with cMetS and its components were tested. In model 4, addition to variables of model 3, BMI percentile and LTPA were simultaneously in the model. In model 5, BMI percentile and LTPA interaction term were added to the previous model.
We assessed the association between cMetS and BMI percen- tiles across LTPA and STA categories by using linear regression models. The results of the linear regression model were reported as β coefficient.
RESULTS
Anthropometric and demographic characteristics
The study participants included 5,624 students (50.2% boys,
mean age 14.7 ± 2.4 years). The numbers of students classified
as underweight, normal weight, overweight, and obese were
984 (17.5%), 3,689 (65.6%), 501 (8.9%), and 451 (8%), respec-
tively. The anthropometric and demographic characteristics of
the subjects across BMI percentiles are shown in Table 1. All
variables were statistically different between these BMI
categories, except for family history of hypertension and type
of home.
Variables LTPA STA Mild Moderate Sever < 2 h/day ≥ 2 h/day BMI percentiles
Model I1) 1.13* 1.04* 1.21* 1.17* 1.11*
Model R square 0.11 0.13 0.16 0.15 0.12
Model II2) 1.14* 1.05* 1.22* 1.17* 1.11*
Model R square 0.11 0.13 0.16 0.16 0.12
Model III3) 1.09* 1.04* 1.17* 1.14* 1.05*
Model R square 0.10 0.14 0.15 0.15 0.10
1)Without adjusted (crude models)
2)Adjusted for age and sex
3)Additionally adjusted for living place, family history of chronic disease, mother’s education, father’s education, socioeconomic status
BMI: Body mass index; cMetS: continuous metabolic syndrome; LTPA: leisure time physical activity; STA: screen time activity
*P< 0.05
Table 4. Associations of BMI percentiles with cMetS across LTPA and STA categories in Iranian adolescents: the CASPIAN-III study
Components of cMetS according to BMIpercentiles
Mean and standard deviation values of various components of cMetS across BMI percentiles, leisure time physical activity (LTPA), and screen time activity (STA) levels are presented in Table 2. The mean of all cMetS components increased linearly with higher BMI percentiles (P-trend < 0.001), except for FBG standardized residuals (Z-FBG). The mean of all cMetS compo- nents was linearly associated with LTPA (P-trend < 0.01), except for standardized residuals of FBG and TG. The average of standardized residuals of HDL (Z-HDL) was significantly higher among students who had less than 2 h/day of STA compared with those who had more than 2 h/day of STA.
Association of BMIpercentiles and LTPA with standardized components of cMetS
Table 3 illustrates the β values of BMI percentiles and LTPA for standardized components of cMetS in different linear regression models. As shown in the table, Z_MAP, Z_TG, Z_WC, Z_HDL, and cMetS increased from 0.26 to 0.29, 0.32 to 0.39, 0.39 to 0.45, -0.12 to -0.20, and 1.07 to 1.14, respectively, with increasing BMI percentiles in all models; these associations were independent from LTPA effect according to model IV. The association of BMI percentiles with Z_FBG was not statistically significant in all models. In the multivariate models (model IV), LTPA showed a significant association with only Z_HDL (β: 0.16).
According to model IV, the interaction term of BMI percentiles and LTPA with all components of cMetS was not statistically significant.
Association of BMI percentiles with cMetS across LTPA and STA categories
Associations of BMI percentiles with cMetS across LTPA and STA levels are shown in Table 4. The β values of BMI percentiles and cMetS associations in all LTPA and STA levels were approximately equal and statistically significant, which indicates that association of BMI percentiles with cMetS is independent from LTPA and STA levels.
DISCUSSION
The findings of this study demonstrate that BMI percentiles are associated with cMetS independent of leisure time physical activity (LTPA) and screen time activity (STA) levels. This finding contradicts previous studies in which high levels of LTPA were shown to be significantly associated with a lower MetS score at all BMI levels in children and adolescents [20,31]. On the other side, low levels of LTPA in overweight or obese subjects increases risk of developing metabolic syndrome or alteration of its components [20]. Although there are a number of studies analyzing the associations of LTPA and BMI with MetS risk [32-36], studies using cMetS risk score are scarce [20].
LTPA showed only a slight association with means of cMetS components (Table 3). Moreover, after adjustment for BMI percentile and other confounders such as STA, the relationship between activity and cMetS components was found to be weak or even non-existent.
Both increased body weight and inactivity have been shown to be predictors of cardiovascular disease, diabetes, and metabolic syndrome. This has led to some controversy over the relative contributions of each to cardiometabolic risk.
Physical activity has multiple beneficial effects that can improve insulin and glucose delivery to muscle. Epidemiological studies in children and adolescents have shown that aerobic exercise improves insulin dynamics in overweight or obese subjects [20].
However, physical activity may not totally stop the adverse effects of obesity [37,38]. In a large prospective cohort, the impact of obesity on risk of diabetes was shown to be greater than that of physical activity [39]. Another study showed that increasing physical activity in obese individuals is associated with reduced risk of diabetes [40]. Sullivan et al. also found that inactive normal weight subjects are at a lower risk of diabetes than obese and active subjects [41]. These findings are consis- tent with our study and suggest that obesity is more important than physical activity in cardiovascular disease.
It is well known that increased BMI is associated with inflam- matory and lipid markers.
Visceral adipose tissue is metabolically active, promoting a thrombotic and inflammatory state, as well as an atherogenic lipoprotein state [42,43]. It is clear that physical activity is associated with inflammatory or lipid biomarkers [44]. Mora et al. showed that a high BMI is more strongly related to adverse cardiovascular biomarker levels than physical inactivity [45]. In our study, BMI was associated with cMetS in all models within physical activity categories.
In our study, STA was not associated with cMetS score risk.
Indeed, previous studies revealed that STA is not associated with cardiometabolic risk factors in the abdominally obese [46,47]). We also observed that the association of BMI with cMetS is independent of STA. Therefore, BMI percentiles independently predict cardiometabolic risk in adolescents, whereas other factors such as LTPA and STA have no effect.
The main limitation of this study is its cross-sectional nature;
therefore, temporal and causal associations cannot be inferred
from these results, and prospective cohort studies are required
to test for causal relationships. In addition, the method for
assessment of LTPA pattern was simple and may not be a
sufficient representation of children’s physical activity. We also were unable to include dietary factors in our study as confoun- ding factors (dietary factors were not assessed in CASPIAN-III study), which may influence the cMetS score. The main strength of this study is the novelty in calculating cMetS.
To the best of our knowledge, this study is the first to evaluate the associations of cMetS with BMI percentile and LTPA in a large non-Western sample of children and adolescents.
The findings of this study demonstrate that BMI percentiles are associated with cMetS independent of LTPA and STA levels.
Although an active lifestyle has many beneficial effects, activity per se cannot prevent risk factors of chronic diseases, and emphasis on controlling childhood overweight and obesity is crucial for primordial/primary prevention of non-communicable diseases.
REFERENCES
1. Reppert A, Steiner BF, Chapman-Novakofski K. Prevalence of metabolic syndrome and associated risk factors in Illinois. Am J Health Promot 2008;23:130-8.
2. Day C. Metabolic syndrome, or What you will: definitions and epidemiology. Diab Vasc Dis Res 2007;4:32-8.
3. Nguyen NT, Magno CP, Lane KT, Hinojosa MW, Lane JS. Association of hypertension, diabetes, dyslipidemia, and metabolic syndrome with obesity: findings from the National Health and Nutrition Examination Survey, 1999 to 2004. J Am Coll Surg 2008;207:928-34.
4. Mehrkash M, Kelishadi R, Mohammadian S, Mousavinasab F, Qorbani M, Hashemi ME, Asayesh H, Poursafa P, Shafa N. Obesity and metabolic syndrome among a representative sample of Iranian adolescents. Southeast Asian J Trop Med Public Health 2012;43:
756-63.
5. Khashayar P, Heshmat R, Qorbani M, Motlagh ME, Aminaee T, Ardalan G, Farrokhi-Khajeh-Pasha Y, Taslimi M, Larijani B, Kelishadi R. Metabolic syndrome and cardiovascular risk factors in a national sample of adolescent population in the Middle East and North Africa: the CASPIAN III Study. Int J Endocrinol 2013;2013:702095.
6. Kahn R, Buse J, Ferrannini E, Stern M; American Diabetes Associa- tion; European Association for the Study of Diabetes. The metabolic syndrome: time for a critical appraisal: joint statement from the American Diabetes Association and the European Association for the Study of Diabetes. Diabetes Care 2005;28:2289-304.
7. Tentolouris N, Papazafiropoulou A, Moyssakis I, Liatis S, Perrea D, Kostakis M, Katsilambros N. Metabolic syndrome is not associated with reduction in aortic distensibility in subjects with type 2 diabetes mellitus. Cardiovasc Diabetol 2008;7:1.
8. Eisenmann JC. Aerobic fitness, fatness and the metabolic syndrome in children and adolescents. Acta Paediatr 2007;96:1723-9.
9. Wijndaele K, Beunen G, Duvigneaud N, Matton L, Duquet W, Thomis M, Lefevre J, Philippaerts RM. A continuous metabolic syndrome risk score: utility for epidemiological analyses. Diabetes Care 2006;
29:2329.
10. Ragland DR. Dichotomizing continuous outcome variables:
dependence of the magnitude of association and statistical power on the cutpoint. Epidemiology 1992;3:434-40.
11. Klein BE, Klein R, Lee KE. Components of the metabolic syndrome and risk of cardiovascular disease and diabetes in Beaver Dam.
Diabetes Care 2002;25:1790-4.
12. Katzmarzyk PT, Pérusse L, Malina RM, Bergeron J, Després JP, Bouchard C. Stability of indicators of the metabolic syndrome from childhood and adolescence to young adulthood: the Québec Family Study. J Clin Epidemiol 2001;54:190-5.
13. Andersen LB, Harro M, Sardinha LB, Froberg K, Ekelund U, Brage S, Anderssen SA. Physical activity and clustered cardiovascular risk in children: a cross-sectional study (The European Youth Heart Study). Lancet 2006;368:299-304.
14. Brage S, Wedderkopp N, Ekelund U, Franks PW, Wareham NJ, Andersen LB, Froberg K; European Youth Heart Study (EYHS).
Features of the metabolic syndrome are associated with objectively measured physical activity and fitness in Danish children: the European Youth Heart Study (EYHS). Diabetes Care 2004;27:2141-8.
15. Eisenmann JC, Katzmarzyk PT, Perusse L, Tremblay A, Després JP, Bouchard C. Aerobic fitness, body mass index, and CVD risk factors among adolescents: the Québec Family Study. Int J Obes (Lond) 2005;29:1077-83.
16. Raitakari OT, Porkka KV, Räsänen L, Rönnemaa T, Viikari JS. Clus- tering and six year cluster-tracking of serum total cholesterol, HDL-cholesterol and diastolic blood pressure in children and young adults. The Cardiovascular Risk in Young Finns Study. J Clin Epidemiol 1994;47:1085-93.
17. Okosun IS, Lyn R, Davis-Smith M, Eriksen M, Seale P. Validity of a continuous metabolic risk score as an index for modeling metabolic syndrome in adolescents. Ann Epidemiol 2010;20:843-51.
18. Eisenmann JC, Laurson KR, DuBose KD, Smith BK, Donnelly JE.
Construct validity of a continuous metabolic syndrome score in children. Diabetol Metab Syndr 2010;2:8.
19. Liu W, Lin R, Liu A, Du L, Chen Q. Prevalence and association between obesity and metabolic syndrome among Chinese elementary school children: a school-based survey. BMC Public Health 2010;10:780.
20. Okosun IS, Boltri JM, Lyn R, Davis-Smith M. Continuous metabolic syndrome risk score, body mass index percentile, and leisure time physical activity in American children. J Clin Hypertens (Greenwich) 2010;12:636-44.
21. Kelishadi R, Heshmat R, Motlagh ME, Majdzadeh R, Keramatian K, Qorbani M, Taslimi M, Aminaee T, Ardalan G, Poursafa P, Larijani B. Methodology and early findings of the third survey of CASPIAN Study: a national school-based surveillance of students' high risk behaviors. Int J Prev Med 2012;3:394-401.
22. McNamara JR, Schaefer EJ. Automated enzymatic standardized lipid analyses for plasma and lipoprotein fractions. Clin Chim Acta 1987;166:1-8.
23. Kuczmarski RJ, Ogden CL, Grummer-Strawn LM, Flegal KM, Guo SS, Wei R, Mei Z, Curtin LR, Roche AF, Johnson CL. CDC growth charts:
United States. Adv Data 2000:1-27.
24. Kelishadi R, Ardalan G, Gheiratmand R, Majdzadeh R, Hosseini M, Gouya MM, Razaghi EM, Delavari A, Motaghian M, Barekati H, Mahmoud-Arabi MS, Lock K; Caspian Study Group. Thinness, overweight and obesity in a national sample of Iranian children and adolescents: CASPIAN Study. Child Care Health Dev 2008;34:
44-54.
25. Ziaoddini H, Kelishadi R, Kamsari F, Mirmoghtadaee P, Poursafa P.
First nationwide survey of prevalence of weight disorders in Iranian children at school entry. World J Pediatr 2010;6:223-7.
26. The Australian College of Paediatrics. Policy statement. Children's television. J Paediatr Child Health 1994;30:6-8.
27. Strong WB, Malina RM, Blimkie CJ, Daniels SR, Dishman RK, Gutin B, Hergenroeder AC, Must A, Nixon PA, Pivarnik JM, Rowland T, Trost S, Trudeau F. Evidence based physical activity for school-age youth. J Pediatr 2005;146:732-7.
28. Kelishadi R, Majdzadeh R, Motlagh ME, Heshmat R, Aminaee T, Ardalan G, Esmaillzadeh A, Azadbakht L, Poursafa P, Movahedian M, Baraz S. Development and evaluation of a questionnaire for assessment of determinants of weight disorders among children and adolescents: the Caspian-IV Study. Int J Prev Med 2012;3:
699-705.
29. Shafiee G, Kelishadi R, Heshmat R, Qorbani M, Motlagh ME, Aminaee T, Ardalan G, Taslimi M, Poursafa P, Larijani B. First report on the validity of a continuous Metabolic syndrome score as an indicator for Metabolic syndrome in a national sample of paediatric population - the CASPIAN-III study. Endokrynol Pol 2013;64:278-84.
30. Alberti KG, Zimmet P, Shaw J; IDF Epidemiology Task Force Consensus Group. The metabolic syndrome--a new worldwide definition. Lancet 2005;366:1059-62.
31. Pahkala K, Heinonen OJ, Lagström H, Hakala P, Hakanen M, Hernelahti M, Ruottinen S, Sillanmäki L, Rönnemaa T, Viikari J, Raitakari OT, Simell O. Clustered metabolic risk and leisure-time physical activity in adolescents: effect of dose? Br J Sports Med 2012;46:131-7.
32. Pahkala K, Hernelahti M, Heinonen OJ, Raittinen P, Hakanen M, Lagström H, Viikari JS, Rönnemaa T, Raitakari OT, Simell O. Body mass index, fitness and physical activity from childhood through adolescence. Br J Sports Med 2013;47:71-7.
33. Guillaume M, Lapidus L, Björntorp P, Lambert A. Physical activity, obesity, and cardiovascular risk factors in children. The Belgian Luxembourg Child Study II. Obes Res 1997;5:549-56.
34. Hajian-Tilaki K, Heidari B. Prevalences of overweight and obesity and their association with physical activity pattern among Iranian adolescents aged 12-17 years. Public Health Nutr 2012;15:2246-52.
35. Liu J, Bennett KJ, Harun N, Probst JC. Urban-rural differences in overweight status and physical inactivity among US children aged 10-17 years. J Rural Health 2008;24:407-15.
36. Kelishadi R, Razaghi EM, Gouya MM, Ardalan G, Gheiratmand R, Delavari A, Motaghian M, Ziaee V, Siadat ZD, Majdzadeh R, Heshmat
R, Barekati H, Arabi MS, Heidarzadeh A, Shariatinejad K; CASPIAN Study Group. Association of physical activity and the metabolic syndrome in children and adolescents: CASPIAN Study. Horm Res 2007;67:46-52.
37. Holloszy JO, Hansen PA. Regulation of glucose transport into skeletal muscle. Rev Physiol Biochem Pharmacol 1996;128:99-193.
38. Goodyear LJ, Kahn BB. Exercise, glucose transport, and insulin sensitivity. Annu Rev Med 1998;49:235-61.
39. Rana JS, Li TY, Manson JE, Hu FB. Adiposity compared with physical inactivity and risk of type 2 diabetes in women. Diabetes Care 2007;30:53-8.
40. Hu G, Lindström J, Valle TT, Eriksson JG, Jousilahti P, Silventoinen K, Qiao Q, Tuomilehto J. Physical activity, body mass index, and risk of type 2 diabetes in patients with normal or impaired glucose regulation. Arch Intern Med 2004;164:892-6.
41. Sullivan PW, Morrato EH, Ghushchyan V, Wyatt HR, Hill JO. Obesity, inactivity, and the prevalence of diabetes and diabetes-related cardiovascular comorbidities in the U.S., 2000-2002. Diabetes Care 2005;28:1599-603.
42. Visser M, Bouter LM, McQuillan GM, Wener MH, Harris TB. Elevated C-reactive protein levels in overweight and obese adults. JAMA 1999;282:2131-5.
43. Grundy SM. Obesity, metabolic syndrome, and coronary athero- sclerosis. Circulation 2002;105:2696-8.
44. Kasapis C, Thompson PD. The effects of physical activity on serum C-reactive protein and inflammatory markers: a systematic review.
J Am Coll Cardiol 2005;45:1563-9.
45. Mora S, Lee IM, Buring JE, Ridker PM. Association of physical activity and body mass index with novel and traditional cardiovascular biomarkers in women. JAMA 2006;295:1412-9.
46. McGuire KA, Ross R. Sedentary behavior is not associated with cardiometabolic risk in adults with abdominal obesity. PLoS One 2011;6:e20503.
47. Ekelund U, Brage S, Griffin SJ, Wareham NJ; ProActive UK Research Group. Objectively measured moderate- and vigorous-intensity physical activity but not sedentary time predicts insulin resistance in high-risk individuals. Diabetes Care 2009;32:1081-6.