Endocrinol Metab 2020;35:416-424 https://doi.org/10.3803/EnM.2020.35.2.416 pISSN 2093-596X · eISSN 2093-5978
Original Article
Association of Body Mass Index with the Risk of Incident Type 2 Diabetes, Cardiovascular Disease, and All-Cause Mortality: A Community-Based Prospective Study
Ji Cheol Bae1,*, Nam H. Cho2,*, Jae Hyeon Kim3, Kyu Yeon Hur3, Sang-Man Jin3, Moon-Kyu Lee4
1Division of Endocrinology and Metabolism, Department of Internal Medicine, Samsung Changwon Hospital, Sungkyunkwan University School of Medicine, Changwon; 2Department of Preventive Medicine, Ajou University School of Medicine, Suwon;
3Division of Endocrinology and Metabolism, Department of Internal Medicine, Samsung Medical Center, Sungkyunkwan University School of Medicine, Seoul; 4Division of Endocrinology and Metabolism, Department of Internal Medicine, Soonchunhyang University Gumi Hospital, Soonchunhyang University College of Medicine, Gumi, Korea
Background: Type 2 diabetes and cardiovascular disease (CVD) are the most important sequelae of obesity and the leading cause of death. We evaluated the association between body mass index (BMI) and the risk of incident type 2 diabetes, CVD, and all-cause mortality in a prospective study of a Korean population.
Methods: The shapes of the associations were modeled by restricted cubic splines regression analysis. After categorizing all subjects (n=8,900) into octiles based on their BMI levels, we estimated the hazard ratio (HR) for the association of categorized BMI levels with the risk of incident CVD and type 2 diabetes using a Cox’s proportional hazard analysis.
Results: The mean age of participants was 52 years and 48% were men. Of the subjects at baseline, 39.0% of men and 45.6% of women were classified as obese (BMI ≥25 kg/m2). Over a mean follow-up of 8.1 years, CVD events occurred in 509 participants;
436 died; and 1,258 subjects developed type 2 diabetes. The increased risk of incident diabetes began to be significant at BMI 23 to 24 kg/m2 in both sexes (HR, 1.8). For CVD events, the risk began to increase significantly at BMI 26 to 28 kg/m2 (HR, 1.6). We found a reverse J-shaped relationship between BMI and all-cause mortality, with an increased risk among individuals with BMI val- ues in lower range (BMI <21 kg/m2).
Conclusion: These results suggest that the BMI cut-off points for observed risk were varied depending on the diseases and that the BMI classification of obesity need to be revised to reflect differential risk of obesity-related diseases.
Keywords: Body mass index; Obesity; Diabetes mellitus; Cardiovascular diseases
INTRODUCTION
Obesity can be defined as an excess of body fat. Obesity raises
the risk for cardiovascular disease (CVD) through other risk factors including dyslipidemia, hypertension, hyperglycemia, and insulin resistance indicating that obesity is an underlying
Received: 6 January 2020, Revised: 18 March 2020, Accepted: 14 May 2020 Corresponding author: Moon-Kyu Lee
Division of Endocrinology and Metabolism, Department of Internal Medicine, Soonchunhyang University Gumi Hospital, Soonchunhyang University College of Medicine, 179 1gongdan-ro, Gumi 39371, Korea
Tel: +82-54-468-9046, Fax: +82-54-468-9051, E-mail: [email protected]
*These authors contributed equally to this work.
Copyright © 2020 Korean Endocrine Society
This is an Open Access article distributed under the terms of the Creative Com- mons Attribution Non-Commercial License (https://creativecommons.org/
licenses/by-nc/4.0/) which permits unrestricted non-commercial use, distribu- tion, and reproduction in any medium, provided the original work is properly cited.
major risk factor for CVD [1]. The most widely used simple an- thropometric measurement to identify obesity in clinical prac- tice is body mass index (BMI) [2].
BMI is a simple index using person’s height and weight that is commonly used to identify overweight and obesity in adults.
The World Health Organization (WHO) BMI classifications of overweight (defined as BMI ≥25 kg/m2) and obesity (defined as BMI ≥30 kg/m2) are intended for international use; these classifications reflect increased risk for type 2 diabetes and CVD [3]. On the basis of the available data, Asians generally have a higher percentage of body fat than white Westerners with the same BMI, and have increased CVD risks at lower BMI val- ues [4]. There is also accumulating evidence of high prevalence of type 2 diabetes and other major cardiovascular risk factors at the BMI below the level of 25 kg/m2 that defines overweight in WHO classification [4-6]. For these reasons, the need for devel- oping different BMI cut-off points for different ethnic groups has emerged, but defining obesity for Asian has long been a subject of debate [4,7]. As such, the WHO consultation group decided not to define BMI cut point for Asians separately. In- stead, they identified potential public health action points along the BMI continuum ranging from 23.0 to 27.5 kg/m2 and pro- posed that each country make decisions regarding the defini- tions of increased risk for its population [4]. In China, BMIs of 24 and 28 kg/m2 are recommended as the cut-off points for overweight and obesity, respectively [8]. The Korean Society for the Study of Obesity (KSSO) has established the lower BMI thresholds of 25 kg/m2 for obesity and 23 kg/m2 for overweight in Koreans [9].
Type 2 diabetes and CVD are the most important sequelae of obesity and are the leading cause of death in adults [3,10]. We assessed prevalence of obesity and evaluated the association be- tween BMI levels and the risk of incident type 2 diabetes, CVD, and all-cause mortality in a prospective study of a Korean popu- lation. The results were also discussed in terms of obesity crite- ria for Koreans adults.
METHODS
The Korean Genome and Epidemiology Study-Ansan and Ansung study
The Korean Genome and Epidemiology Study (KoGES) is an ongoing prospective population-based cohort study with the support from the National Genome Research Institute. The re- cruitment of patients, study design, and methods for the KoGES Ansan and Ansung study have been reported previously [10].
Briefly, 10,038 subjects (aged 40 to 69 years) were enrolled in the two different cities of Ansung and Ansan from 2001 to 2002.
Since the baseline examination (2001 to 2002), biennial repeat- ed follow-up surveys have been continued. Recently, the eighth follow-up examination (2017 to 2018) has been completed.
Subjects
Initial data were obtained from 10,038 subjects who participated in the KoGES Ansan and Ansung Study. Among these subjects, those who had previous history of CVD (n=249) and those who did not undergo any follow-up surveys after the baseline recruit- ment (2001 to 2002) (n=908) were excluded. After applying the above exclusion criteria, the number of participants eligible for the study was 8,900 (4,243 men and 4,657 women with a mean age of 52.3 years). At each visit, investigator obtained informed written consent from all participants. The study protocol was ap- proved by the ethics committee of the Korean Center for Disease Control and Institutional Review Board of the Ajou University School of Medicine (IRB approval No. AJIRB-CRO-07-012).
Study design and statistical analyses
In this study, only data up to the fifth follow-up examination pe- riod (2011 to 2012) were analyzed. During a 12 years follow-up period, 9,130 (91%) subjects underwent one or more follow-up examinations, and 6,117 (61%) completed the fifth follow-up survey (2011 to 2012). The spline regression analyses were used to evaluate the association between BMI levels and the risk of incident type 2 diabetes, CVD, and all-cause mortality.
Analyses were performed in a separate model by sex. The shapes of the associations between BMI and CVD, and all- cause mortality were modeled by restricted cubic splines (ad- justed for age, smoking, alcohol intake, and regular exercise) with four knots set at the 5th, 25th, 75th, and 95th percentiles.
In males, knots were equivalent to BMI levels of 19.3, 22.2, 26.1, and 29.1 kg/m2, respectively, while the values for females were 20.0, 22.6, 26.9, and 30.8 kg/m2, respectively. We consid- ered the BMI value associated with the lowest risk as the refer- ence value; in the analysis of association with CVD, the BMI of 21.1 and 21.4 kg/m2 were the reference values for men and women, respectively; for association with all-cause mortality, the reference values were set as the BMI of 27.1 and 22.2 kg/m2, respectively. The plot was truncated at the 1st and the 99th per- centile. After further exclusion of participants with known dia- betes (n=1,250; 634 men and 616 women) at baseline, spline regression analyses for the association with development of type 2 diabetes was conducted in the same manner as the analy-
sis for the association with incident CVD. The BMI of 21.0 and 21.3 kg/m2 were the reference values for men and women, re- spectively. After categorizing all subjects into octiles based on their BMI levels, we also estimated the hazard ratio (HR) for the association of categorized BMI level with the risk of inci- dent CVD, type 2 diabetes, and all-cause mortality using a Cox’s proportional hazard analysis. Statistical data analysis was performed using STATA software version 15.1 (Stata Corp., College Station, TX, USA).
Definition
A CVD event was defined as acute myocardial infarction, coro- nary-bypass surgery, coronary angioplasty, coronary stent inser- tion, angina pectoris, acute stroke, and death due to coronary disease or stroke that occurred during the follow-up period. Data on CVD event occurrence were obtained through in-depth inter- views with the study participants. These interviews were repeat- ed biennially. There were continuous attempts to contact partici- pants who did not undergo follow-up examination by telephone
or by door-to-door visit. Information about the deaths including the dates, places, and causes was obtained from the participants’
family members through these contacts. The development of di- abetes was assessed from the biennial follow-up examinations and diagnosed according to the criteria of American Diabetes Association (ADA): (1) plasma glucose ≥126 mg/dL in the fasting state; (2) plasma glucose ≥200 mg/dL 2 hours after a 75g oral glucose load; or (3) glycated haemoglobin ≥6.5% [11].
Also, at an in-depth interview conducted at each visit, subjects who had a history of diabetes or currently used insulin or oral anti-diabetic drugs were considered to have developed diabetes.
Hypertension was defined as blood pressure greater than or equal to 140/90 mm Hg or use of antihypertensive medication.
We defined dyslipidemia as serum low density lipoprotein cho- lesterol ≥160 mg/dL, high density lipoprotein cholesterol <40 mg/dL, triglycerides ≥200 mg/dL, or use of any medication for dyslipidemia [12]. Regular exercise was defined as doing physi- cal exercise more than three times per week.
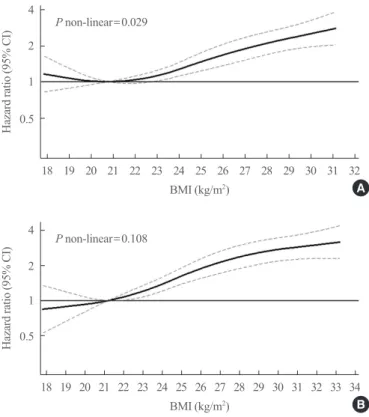
Table 1. Baseline Characteristics
Characteristic Male (n=4,243) Female (n=4,657) Total (n=8,900)
Age, yr 51.8±8.8 52.7±9.0 52.3±8.9
Weight, kg 67.4±9.8 58.9±8.6 63.0±10.1
BMI, kg/m2 24.2±2.9 24.9±3.3 24.6±3.1
BMI ≥25 kg/m2 1,656 (39.0) 2,123 (45.6) 3,779 (42.5)
BMI ≥30 kg/m2 121 (2.9) 331 (7.1) 452 (5.1)
Waist circumference, cm 83.6±7.6 81.9±9.7 82.7±8,8
Percentage of body fat, % 21.5±5.1 31.6±5.5 -
Diabetes 634 (14.9) 616 (13.2) 1,123 (12.6)
HbA1c, % 5.81±0.94 5.78±0.91 5.80±0.93
Fasting glucose, mg/dL 91.5±23.9 86.6±19.1 88.9±21.7
HOMA-IR 1.63±1.16 1.77±1.43 1.70±1.31
Hypertension 1,003 (23.6) 1,198 (25.7) 2,201 (24.7)
Systolic blood pressure, mm Hg 117.5±16.5 117.5±19.4 117.5±18.1
Dyslipidemia 2,262 (53.3) 2,187 (47.0) 4,449 (50.0)
LDL-C, mg/dL 118.0±37.5 119.1±33.3 118.6±35.3
Triglyceride, mg/dL 173.4±114.8 144.0±86.3 158.0±101.9
HDL-C, mg/dL 45.1±10.8 47.4±10.9 118.6±35.3
Regular exercise 762 (18.0) 869 (18.7) 1,631 (18.3)
Current drinker 3,005 (70.8) 1,192 (25.6) 4,197 (46.9)
Current smoker 2,082 (49.1) 162 (3.5) 2,244 (25.2)
Values are expressed as mean±standard deviation or number (%).
BMI, body mass index; HbA1c, glycated haemoglobin; HOMA-IR, homeostasis model assessment of insulin resistance; LDL-C, low density lipoprotein cholesterol; HDL-C, high density lipoprotein cholesterol.
RESULTS
The mean age of participants was 52 years and 48% were men.
The mean±SD BMI of participants were 24.6±3.1 kg/m2 (range, 14.4 to 40.2). Of the subjects at baseline, 39.0% of men and 45.6% of women were classified as obese as defined by the KSSO cut-off (BMI ≥25 kg/m2). The proportion of participants who had diabetes was 12.6% (1,123 of 8,900) (Table 1). Over a mean follow-up of 8.1±2.6 years, CVD events occurred in 509 participants (241 men and 268 women); 436 (293 men and 143 women) died; and 1,258 subjects (665 men and 593 women) developed type 2 diabetes. Restricted cubic spline regression analysis revealed a J-shaped association between BMI levels and incident CVD events (P value for nonlinearity=0.045 for men and 0.048 for women) (Fig. 1). The risk for development of CVD was lowest at BMI levels of 20 to 22 kg/m2 in men and 21 to 22 kg/m2 in women, and BMI levels higher than 26.0 kg/m2 in men and 26.5 kg/m2 in women were associated with a signifi- cantly increased risk. The overall shape of the association be- tween BMI levels and incident diabetes demonstrated an in- creased risk of incident diabetes at BMI levels higher than 23.7
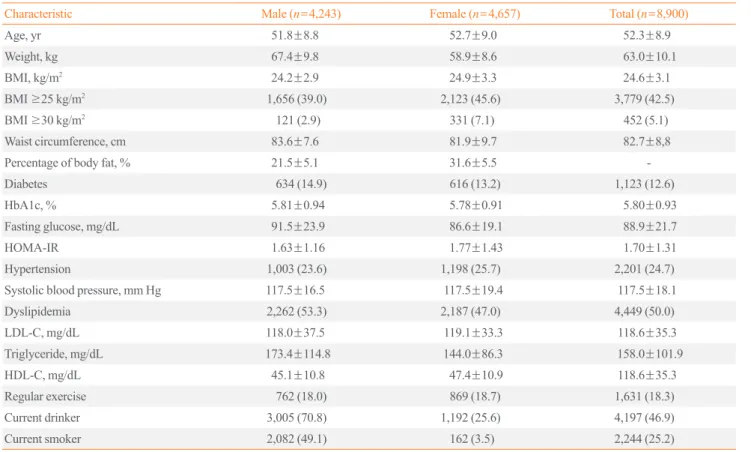
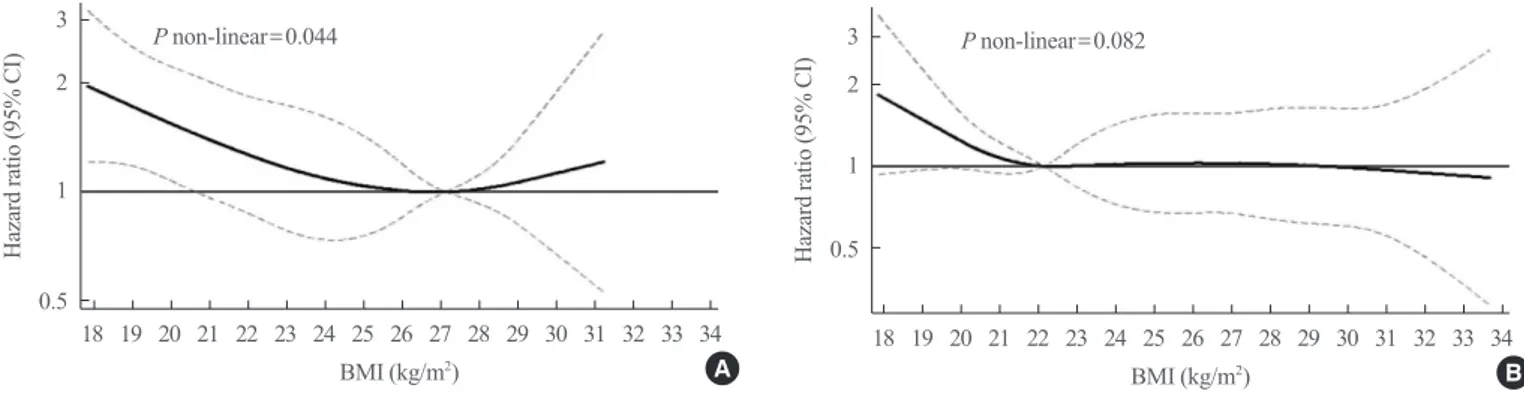
kg/m2, with lowest risk occurring around BMI of 21 kg/m2 in men (P value for nonlinearity=0.029) (Fig. 2A). On the other hand, the cubic restricted spline model has shown gradually in- creasing HRs for incident diabetes with increasing BMI levels in women (P value for nonlinearity=0.108) (Fig. 2B). Unlike the finding on CVD events, a reverse J-shaped association was seen between BMI and the risk of death from any cause (P val- ue for nonlinearity=0.044 for men and 0.082 for women) (Fig.
3). For men, the risk of mortality was lowest at BMI of 25 to 29 kg/m2, with inverse association below, and positive association above (Fig. 3A). An increased risk of mortality was more pro- nounced at lower BMIs than at higher BMIs (Table 2, Fig. 3A).
For women, we found inverse association below a BMI of 22.2 kg/m2, while there was little evidence of association at higher BMI values (Table 2, Fig. 3B).
In Cox proportional hazards models, as compared with men with a BMI of 20.8 to 22.1 kg/m2, men with a BMI of 26.2 to 27.4 kg/m2 had a HR for incident CVD of 1.63 (95% confidence interval [CI], 1.06 to 2.50). Among women, the risk of incident CVD increased at a BMI above 28.7 kg/m2 with HR of 1.56 (95% CI, 1.03 to 2.35) compared to women with a BMI of 21.3
3 2
1
0.5
4
2
1
0.5
3 2
1
0.5
4
2
1
0.5
Hazard ratio (95% CI) Hazard ratio (95% CI)
Hazard ratio (95% CI) Hazard ratio (95% CI)
BMI (kg/m2) BMI (kg/m2)
BMI (kg/m2) BMI (kg/m2)
P non-linear=0.045 P non-linear=0.029
P non-linear=0.048 P non-linear=0.108
18 19 20 21 22 23 24 25 26 27 28 29 30 31 32 18 19 20 21 22 23 24 25 26 27 28 29 30 31 32
18 19 20 21 22 23 24 25 26 27 28 29 30 31 32 33 34 18 19 20 21 22 23 24 25 26 27 28 29 30 31 32 33 34
Fig. 1. The association between body mass index (BMI) level and development of cardiovascular disease. (A) Men, (B) Women. The analyses were adjusted for age, smoking, alcohol intake, and regu- lar exercise. Dash line indicates 95% confidence interval (CI).
Fig. 2. The association between body mass index (BMI) level and development of type 2 diabetes. (A) Men, (B) Women. The analy- ses were adjusted for age, smoking, alcohol intake, and regular ex- ercise. Dash line indicates 95% confidence interval (CI).
A A
B B
to 22.5 kg/m2 (Table 3). The risk of developing type 2 diabetes began to increase significantly at the BMI category of 24.2 to 25.0 kg/m2 for men and 23.6 to 24.5 kg/m2 for women, com- pared to the subjects in the lowest risk group, with HR of 1.81 (95% CI, 1.31 to 2.52) and 1.74 (95% CI, 1.21 to 2.51), respec- tively (Table 4).
DISCUSSION
Currently, obesity is defined as a BMI ≥25 kg/m2 in the Korean population; this criterion was set by the KSSO and recommend- ed by the Western Pacific Regional Office (WPRO) of the WHO in 2000 [7,9]. Applying this criterion, our cohort popula- tion had an unexpectedly higher prevalence of obesity, which is close to that of United States adults. In our cohort, 39.0% of
3 2
1
0.5
3 2
1
Hazard ratio (95% CI) Hazard ratio (95% CI) 0.5
BMI (kg/m2) BMI (kg/m2)
P non-linear=0.044 P non-linear=0.082
18 19 20 21 22 23 24 25 26 27 28 29 30 31 32 33 34 18 19 20 21 22 23 24 25 26 27 28 29 30 31 32 33 34
Fig. 3. The association between body mass index (BMI) level and all-cause mortality. (A) Men, (B) Women. The analyses were adjusted for age, smoking, alcohol intake, and regular exercise. Dash line indicates 95% confidence interval (CI).
A B
Table 2. Hazard Ratios for All-Cause Mortality Based on Categorized BMI Levels BMI categories, kg/m2 Number No. of subjects who
developed diabetes Incidence rate, % Hazard ratio (95% CI)a P valueb
Men 4,243 293 6.9
≤20.7 528 74 14.0 1.66 (1.06–2.59) 0.026
20.8–22.1 534 50 9.4 1.39 (0.87–2.22) 0.175
22.2–23.2 530 32 6.0 0.98 (0.57–1.60) 0.871
23.3–24.1 531 31 5.8 1.02 (0.61–1.71) 0.944
24.2–25.0 529 30 5.7 1.01 (0.60–1.70) 0.976
25.1–26.1 532 29 5.5 1.02 (0.60–1.72) 0.953
26.2–27.4 532 27 5.1 1
≥27.5 527 20 3.8 0.87 (0.41–1.34) 0.380
Women 4,657 143 3.1
≤21.2 583 24 4.1 1.55 (0.81–2.96) 0.182
21.3–22.5 581 15 2.6 1
22.6–23.5 583 16 2.7 1.05 (0.52–2.12) 0.891
23.6–24.5 584 16 2.7 1.02 (0.50–2.07) 0.952
24.6–25.5 580 17 2.9 1.12 (0.56–2.23) 0.761
25.6–26.6 580 17 2.9 0.98 (0.49–1.95) 0.936
26.7–28.4 584 22 3.8 1.26 (0.69–2.57) 0.396
≥28.5 582 16 2.7 0.99 (0.49–2.04) 0.977
BMI, body mass index; CI, confidence interval.
aAdjusted for age, smoking, alcohol intake, and regular exercise; bEstimated from Cox proportional-hazard regression model.
men and 45.6% of women were classified as obese as defined by the KSSO cut-off (BMI ≥25 kg/m2) (Supplemental Table S1); in the USA National Health and Nutrition Examination Survey (2015 to 2016), among adults aged 40 to 59 years, 40.8% of men and 44.7% of women were classified as obese based on the global WHO BMI cut-off ≥30 kg/m2 [13]. Based on an analysis of nationally representative data from the Korea National Health and Nutrition Examination Survey (2016), the proportion of obese subjects (BMI ≥25 kg/m2) was 34.8%
(42.3% of men, 26.4% of women). In particular, the prevalence of obesity among those aged 40 to 59 years was 44% for men and 30% for women [14]. For the European population, the prevalence of obesity (BMI ≥30 kg/m2) was 10% to 27% de- pending on the country, and the prevalence of obesity was high- er in Koreans than in Europeans [15]. Scientific evidence sug- gests that Asians generally have a higher percentage of body fat than Westerners with the same BMI, and the risk of having CVD increases at a lower BMI value than Westerners [4]. Even so, considering the comparison with prevalence of obesity among United States and European adults, it is worth contem- plating whether the current BMI cut-off point for Korean obesi-
ty is too low.
In 2004, the WHO convened an expert consultation on BMI classification for the Asian population as the controversy over whether to develop different BMI cut-off points for different ethnic groups increased [4]. This consultation decided not to de- fine cut-off points for each population separately because the available data did not indicate one clear BMI cut-off point for all Asians [4,6,16]. Instead, the expert consultation group desig- nated BMI levels ≥23 and ≥27.5 kg/m2 as potential public health action points along the BMI continuum for Asian popula- tions and proposed that each country define levels of increased risk for its population [4]. In general, BMI ≥25 kg/m2 (defined as overweight) is considered a risk factor for diabetes, and therefore the ADA recommends testing for type 2 diabetes in adults of any age with BMI ≥25 kg/m2 and who have additional risk factors [11]. However, for Asian American, these BMI val- ues are lower to ≥23 kg/m2 because BMI cut points with a sen- sitivity of 80% fall consistently between 23 and 24 kg/m2 for nearly all Asian American subgroups [11,17]. In our study, the increased risk of incident diabetes began to be significant at around BMI 23 to 24 kg/m2 in both men and women. These val- Table 3. Hazard Ratios for Development of Cardiovascular Disease Based on Categorized BMI Levels
BMI categories, kg/m2 Number No. of subjects who
developed diabetes Incidence rate, % Hazard ratio (95% CI)a P valueb
Men 4,243 337 7.9
≤20.7 528 41 7.8 0.87 (0.56–1.35) 0.526
20.8–22.1 534 38 7.1 1
22.2–23.2 530 46 8.7 1.28 (0.83–1.97) 0.263
23.3–24.2 531 30 5.6 0.92 (0.57–1.48) 0.718
24.3–25.1 529 42 7.9 1.34 (0.86–2.08) 0.195
25.2–26.1 532 40 7.5 1.29 (0.83–2.02) 0.262
26.2–27.4 532 49 9.2 1.63 (1.06–2.50) 0.026
≥27.5 527 51 9.7 1.80 (1.17–2.77) 0.007
Women 4,657 356 7.6
≤21.2 583 36 6.2 0.90 (0.57–1.43) 0.653
21.3–22.5 581 37 6.4 1
22.6–23.6 583 40 6.9 1.09 (0.69–1.70) 0.708
23.7–24.6 584 38 6.5 1.05 (0.67–1.65) 0.839
24.7–25.6 580 54 9.3 1.43 (0.94–2.18) 0.089
25.7–26.8 580 43 7.4 1.04 (0.67–1.61) 0.861
26.9–28.6 584 49 8.4 1.29 (0.84–1.98) 0.243
≥28.7 582 59 10.1 1.56 (1.03–2.35) 0.035
BMI, body mass index; CI, confidence interval.
aAdjusted for age, smoking, alcohol intake, and regular exercise; bEstimated from Cox proportional-hazard regression model.
ues are close to the 23 kg/m2 of BMI suggested by the WHO as a potential public health action point representing increased risk for Asian populations [4] and are also close to the level given by the KSSO and the ADA as overweight (≥23 kg/m2) [9,11].
Meanwhile, the risk of CVD events began to increase signifi- cantly at around BMI 26 to 28 kg/m2 in both men and women;
these values are above the current BMI cut-off (≥25 kg/m2) for obesity in Koreans. Also, our subjects with 25% and 35% body fat (thresholds for obesity among men and women, respective- ly) [1,18] had a BMI consistent with the median of 25.9 kg/m2 (interquartile range, 24.7 to 27.0) in men and 26.7 kg/m2 (inter- quartile range, 25.5 to 28.2) in women, respectively (Supple- mental Table S2). In China, BMIs of 28 kg/m2 are recommend- ed as the cut-off points for obesity [8]. The Joint Statement by international diabetes organizations recommend that metabolic surgery could be an option to treat type 2 diabetes in patients with class I obesity (BMI 30.0 to 34.9 kg/m2). In this guideline, a public health action point is applied to diabetic patients with obesity in Asian populations, recommending that a BMI value for class I obesity be reduced by 2.5 kg/m2 for Asian patients to 27.5 to 32.4 kg/m2 [19,20]. Taken together, it may be necessary
to consider raising the BMI cut-off point for Korean obesity to the international criteria of obesity for Asian population.
In our study, we found a reverse J-shaped relationship between BMI and all-cause mortality, with an increased risk among in- dividuals with BMI values in the healthy range (BMI 18.5 to 22.9 kg/m2). This relationship was affected by sex. For men, in particular, BMI was inversely associated with mortality up to 27 kg/m2, while there was little association above 22.2 kg/m2 in women. Our finding was consistent with those from the general Korean population [21-23]. In a longitudinal analysis of ap- proximately 1.2 million Koreans, the BMI range associated with lowest mortality risk was 21.5 to 27.9 kg/m2 [21]. The re- sults from the National Health Insurance Service (NHIS) data has shown that the all-cause mortality of adults aged 45 to75 was lowest at BMI of 24 to 28 kg/m2 [22]. A reduced all-cause mortality risk was also found in a large meta-analysis of 141 studies in relation to being overweight (BMI 25 to 30 kg/m2) and being modestly obese (BMI 30 to 35 kg/m2) when com- pared with normal weight (BMI 18 to 25 kg/m2) [24]. These findings from Korean population and meta-analysis suggest that overweight might be rather protective, indicating that current Table 4. Hazard Ratios for Development of Type 2 Diabetes Mellitus Based on Categorized BMI Levels
BMI categories, kg/m2 Number No. of subjects who
developed diabetes Incidence rate, % Hazard ratio (95% CI)a P valueb
Men 3,609 665 18.4
≤20.7 465 68 14.6 1.08 (0.76–1.54) 0.660
20.8–22.1 469 58 12.4 1
22.2–23.2 462 74 16.0 1.29 (0.91–1.81) 0.141
23.3–24.1 438 69 15.8 1.29 (0.92–1.82) 0.153
24.2–25.0 438 89 20.3 1.81 (1.31–2.52) <0.001
25.1–26.1 491 105 21.4 1.83 (1.33–2.51) <0.001
26.2–27.4 414 92 22.2 1.98 (1.43–2.73) <0.001
≥27.5 432 110 25.5 2.30 (1.67–3.16) <0.001
Women 4,041 593 14.7
≤21.2 517 46 8.9 1
21.3–22.5 502 43 8.6 0.97 (0.63–1.45) 0.834
22.6–23.5 507 50 9.9 1.16 (0.78–1.72) 0.463
23.6–24.5 504 73 14.5 1.74 (1.21–2.51) 0.003
24.6–25.5 502 80 15.9 1.86 (1.30–2.67) 0.001
25.6–26.6 503 88 17.5 1.99 (1.40–2.83) <0.001
26.7–28.4 502 90 17.9 2.20 (1.55–3.13) <0.001
≥28.5 504 123 24.4 3.02 (2.16–4.23) <0.001
BMI, body mass index; CI, confidence interval.
aAdjusted for age, smoking, alcohol intake, and regular exercise; bEstimated from Cox proportional-hazard regression model.
classification of obesity by BMI does not reflect the risk of all- cause mortality. Further studies are needed to assess the associa- tion with cause-specific mortality.
Self-reported information on CVD events may have been prone to recall bias despite the in-depth nature of interview.
Since all participants in our study were aged 40 to 69 years (mean 52.3±8.9) and the KoGES was conducted in two areas in South Korea, the generalizability of our results may be limit- ed. Thus, our findings may not apply to young ages. Indeed, previous studies have shown that the BMI associated with low- est mortality risk was lower in younger individuals than in older individuals [22,23]. We did not consider abdominal adiposity which cannot be sufficiently assessed by BMI measurement.
Even with subjects with the same BMI value, those with higher waist circumference may be at higher risk [25]. In addition, the medication data in this group of participants was not reflected in our analysis. The use of statin or antiplatelet drugs may have af- fected incident CVD events. Similarly, we do not have sufficient behavior data including physical activity and diet because these factors may change during the observation period.
Type 2 diabetes and CVD are the most important sequelae of obesity and the leading cause of death in adults [3,10]. In our study, the risk of incident diabetes increased significantly at BMI 23 to 24 kg/m2. For CVD events, the risk began to increase significantly at BMI 26 to 28 kg/m2. An increased risk of mor- tality was more evident at lower BMI range than current cut- point for obesity and this association was sex-specific. The BMI cut-off points for observed risk were varied depending on the diseases and not consistent with universal cut-off values for obesity. These results suggest that the BMI classification of obe- sity need to be revised to reflect differential risk of obesity-relat- ed diseases.
CONFLICTS OF INTEREST
No potential conflict of interest relevant to this article was re- ported.
ACKNOWLEDGMENTS
This work was supported by the Research Program funded by the Korea Centers for Disease Control and Prevention (found 2001-347-6111-221, 2002-347-6111-221, 2003-347-6111-221, 2004-E71001-00, 2005-E71001-00, 2006-E71005-00, 2006- E71006-00, 2007-E71001-00, 2007-E71003-00, 2008-E71001- 00, 2008-E71005-00, 2009-E71002-00, 2009-E71007-00, 2010-
E71001-00, 2010-E71004-00, 2011-E71004-00, 2011-E71008- 00, 2012-E71008-00, 2012-E71005-00). This work was partial- ly supported by the Soonchunhyang University Research Fund.
The funding source had no role in the design and conduct of the study; in the collection, management, analysis, and interpreta- tion of the data; or in the decision to submit the manuscript for publication. The authors thank all the staff who made this study possible.
AUTHOR CONTRIBUTIONS
Conception or design: J.C.B. Acquisition, analysis, or interpre- tation of data: J.C.B., N.H.C., J.H.K., K.Y.H., S.M.J. Drafting the work or revising: J.C.B. Final approval of the manuscript:
N.H.C., J.H.K., K.Y.H., S.M.J., M.K.L.
ORCID
Ji Cheol Bae https://orcid.org/0000-0002-4763-5797 Nam H. Cho https://orcid.org/0000-0003-4187-0929 Moon-Kyu Lee https://orcid.org/0000-0002-8728-7184
REFERENCES
1. Grundy SM. Obesity, metabolic syndrome, and cardiovas- cular disease. J Clin Endocrinol Metab 2004;89:2595-600.
2. Rao G, Powell-Wiley TM, Ancheta I, Hairston K, Kirley K, Lear SA, et al. Identification of obesity and cardiovascular risk in ethnically and racially diverse populations: a scientif- ic statement from the American Heart Association. Circula- tion 2015;132:457-72.
3. Seidell JC, Kahn HS, Williamson DF, Lissner L, Valdez R.
Report from a Centers for Disease Control and Prevention Workshop on use of adult anthropometry for public health and primary health care. Am J Clin Nutr 2001;73:123-6.
4. WHO Expert Consultation. Appropriate body-mass index for Asian populations and its implications for policy and in- tervention strategies. Lancet 2004;363:157-63.
5. Ko GT, Chan JC, Cockram CS, Woo J. Prediction of hyper- tension, diabetes, dyslipidaemia or albuminuria using simple anthropometric indexes in Hong Kong Chinese. Int J Obes Relat Metab Disord 1999;23:1136-42.
6. Deurenberg-Yap M, Chew SK, Lin VF, Tan BY, van Sta- veren WA, Deurenberg P. Relationships between indices of obesity and its co-morbidities in multi-ethnic Singapore. Int J Obes Relat Metab Disord 2001;25:1554-62.
7. World Health Organization. Regional Office for the Western Pacific. The Asia-Pacific perspective: redefining obesity and its treatment. Sydney: Health Communications Australia;
2000. https://apps.who.int/iris/handle/10665/206936.
8. Chen C, Lu FC; Department of Disease Control Ministry of Health, PR China. The guidelines for prevention and control of overweight and obesity in Chinese adults. Biomed Envi- ron Sci 2004;17 Suppl:1-36.
9. Kim MK, Lee WY, Kang JH, Kang JH, Kim BT, Kim SM, et al. 2014 Clinical practice guidelines for overweight and obesity in Korea. Endocrinol Metab (Seoul) 2014;29:405-9.
10. Bae JC, Cho NH, Suh S, Kim JH, Hur KY, Jin SM, et al.
Cardiovascular disease incidence, mortality and case fatality related to diabetes and metabolic syndrome: a community- based prospective study (Ansung-Ansan cohort 2001-12). J Diabetes 2015;7:791-9.
11. American Diabetes Association. 2. Classification and diag- nosis of diabetes: standards of medical care in diabetes- 2019. Diabetes Care 2019;42(Suppl 1):S13-28.
12. Korean Society of Lipidology and Atherosclerosis. Dyslip- idemia fact sheets in Korea, 2018 [Internet]. Seoul: Korean So- ciety of Lipidology and Atherosclerosis; 2018 [cited 2020 May 27]. Available from: https://www.lipid.or.kr/bbs/?code=fact_
sheet.
13. Hales CM, Carroll MD, Fryar CD, Ogden CL. Prevalence of obesity among adults and youth: United States, 2015- 2016 [Internet]. Atlanta: Centers for Disease Control and Prevention; 2017 [cited 2020 May 27]. Available from:
https://www.cdc.gov/nchs/data/databriefs/db288.pdf.
14. Division of Chronic Disease Control, Korea Centers for Dis- ease Control and Prevention. Korea Health Statistics 2016:
Korea National Health and Nutrition Examination Survey [Internet]. Cheongju: KCDC; c2018 [cited 2020 May 27].
Available from: https://knhanes.cdc.go.kr/knhanes/sub04/
sub04_03.do.
15. Organization for Economic Cooperation and Development.
Obesity update 2017 [Internet]. Paris: OECD; 2017 [cited 2020 May 27]. Available from: http://www.oecd.org/els/
health-systems/Obesity-Update-2017.pdf.
16. Deurenberg P, Deurenberg-Yap M. Validity of body compo- sition methods across ethnic population groups. Forum Nutr 2003;56:299-301.
17. Hsu WC, Araneta MR, Kanaya AM, Chiang JL, Fujimoto W.
BMI cut points to identify at-risk Asian Americans for type 2 diabetes screening. Diabetes Care 2015;38:150-8.
18. Dickey RA, Bartuska DG, Bray GW, Callaway CW, David- son ET, Feld S, et al. AACE/ACE position statement on the prevention, diagnosis, and treatment of obesity. Endocr Pract 1998;4:297-350.
19. American Diabetes Association. 8. Obesity management for the treatment of type 2 diabetes: standards of medical care in diabetes-2019. Diabetes Care 2019;42(Suppl 1):S81-9.
20. Rubino F, Nathan DM, Eckel RH, Schauer PR, Alberti KG, Zimmet PZ, et al. Metabolic surgery in the treatment algo- rithm for type 2 diabetes: a joint statement by international diabetes organizations. Diabetes Care 2016;39:861-77.
21. Jee SH, Sull JW, Park J, Lee SY, Ohrr H, Guallar E, et al.
Body-mass index and mortality in Korean men and women.
N Engl J Med 2006;355:779-87.
22. Yi SW, Ohrr H, Shin SA, Yi JJ. Sex-age-specific association of body mass index with all-cause mortality among 12.8 million Korean adults: a prospective cohort study. Int J Epi- demiol 2015;44:1696-705.
23. Lee EY, Lee YH, Yi SW, Shin SA, Yi JJ. BMI and all-cause mortality in normoglycemia, impaired fasting glucose, new- ly diagnosed diabetes, and prevalent diabetes: a cohort study. Diabetes Care 2017;40:1026-33.
24. Flegal KM, Kit BK, Orpana H, Graubard BI. Association of all-cause mortality with overweight and obesity using stan- dard body mass index categories: a systematic review and meta-analysis. JAMA 2013;309:71-82.
25. Sahakyan KR, Somers VK, Rodriguez-Escudero JP, Hodge DO, Carter RE, Sochor O, et al. Normal-weight central obe- sity: implications for total and cardiovascular mortality. Ann Intern Med 2015;163:827-35.