Comparison of QEEG Findings between Adolescents with Attention Deficit Hyperactivity Disorder (ADHD) without Comorbidity and ADHD Comorbid with Internet Gaming Disorder
Internet gaming disorder (IGD) is often comorbid with attention deficit hyperactivity disorder (ADHD). In this study, we compared the neurobiological differences between ADHD comorbid with IGD (ADHD+IGD group) and ADHD without comorbidity (ADHD-only group) by analyzing quantitative electroencephalogram (QEEG) findings. We recruited 16 male ADHD+IGD, 15 male ADHD-only adolescent patients, and 15 male healthy controls (HC group). Participants were assessed using Young’s Internet Addiction Scale and ADHD Rating Scale. Relative power and inter- and intra-hemispheric coherences of brain waves were measured using a digital electroencephalography (EEG) system. Compared to the ADHD-only group, the ADHD+IGD group showed lower relative delta power and greater relative beta power in temporal regions. The relative theta power in frontal regions were higher in ADHD-only group compared to HC group. Inter-hemispheric coherence values for the theta band between F3–F4 and C3–C4 electrodes were higher in ADHD-only group compared to HC group. Intra-hemispheric coherence values for the delta, theta, alpha, and beta bands between P4–O2 electrodes and intra-hemispheric coherence values for the theta band between Fz–Cz and T4–T6 electrodes were higher in ADHD+IGD group compared to ADHD-only group. Adolescents who show greater vulnerability to ADHD seem to continuously play Internet games to unconsciously enhance attentional ability. In turn, relative beta power in attention deficit in ADHD+IGD group may become similar to that in HC group. Repetitive activation of brain reward and working memory systems during continuous gaming may result in an increase in neuronal connectivity within the parieto-occipital and temporal regions for the ADHD+IGD group.
Keywords: Internet Gaming Disorder; Attention Deficit Hyperactivity Disorder;
Quantitative Electroencephalogram; Spectral Analysis; Coherence Analysis Jeong Ha Park,* Ji Sun Hong,*
Doug Hyun Han, Kyoung Joon Min, Young Sik Lee, Baik Seok Kee, and Sun Mi Kim
Department of Psychiatry, Chung-Ang University Medical Center, Seoul, Korea
* Jeong Ha Park and Ji Sun Hong contributed equally to this work.
Received: 14 October 2016 Accepted: 26 November 2016 Address for Correspondence:
Sun Mi Kim, MD
Department of Psychiatry, Chung-Ang University Medical Center, 102 Heukseok-ro, Dongjak-gu, Seoul 06973, Korea E-mail: [email protected]
Funding: This study was supported by a grant from the Korean Health Technology R&D Project, Ministry of Health and Welfare, Republic of Korea (A120013) and a grant from the Korea Creative Content Agency (R2014040055).
https://doi.org/10.3346/jkms.2017.32.3.514 • J Korean Med Sci 2017; 32: 514-521
INTRODUCTION
Today, Internet access is available almost everywhere in daily life. Internet game playing is inextricably linked to Internet en- tertainment activities. Thus, excessive Internet game play has arisen as a meaningful issue influencing daily life (1,2). Due to these concerns, the Diagnostic and Statistical Manual of Mental Disorders, Fifth Edition (DSM-5) defined losing control over In- ternet game playing as internet gaming disorder (IGD), a new psychiatric disorder requiring further research, as explained in section III (3).
A number of psychiatric comorbidities have been consistent- ly associated with IGD, such as attention deficit hyperactivity disorder (ADHD), major depressive disorder, and social anxiety disorders (4,5). ADHD seems to be a factor predicting loss of self-control associated with excessive internet game play, which
may disturb an individual’s daily life (6,7). Ha et al. (8) reported high psychiatric IGD and ADHD comorbidity in Korean children.
Quantitative electroencephalography (QEEG) has been wide- ly used to identify distinctive electrophysiological signatures as- sociated with various psychiatric disorders (8). These measures are divided into 2 types. One is spectral analysis of absolute and relative electroencephalography (EEG) signal power. This pro- vides information regarding amount of brain activity in differ- ent frequency bands, including delta (0.5–3.5 Hz), theta (3.5–7.5 Hz), alpha (7.5–12.5 Hz), and beta (12.5–35 Hz). The other is co- herence analysis, which quantifies the inter-dependence or sta- tistical correlation between different EEG channels to estimate functional connectivity between different cortical areas in the time domain (9).
Various studies have investigated QEEG features to discrimi- nate between ADHD and healthy controls (HCs). In ADHD, an
increase in the absolute and relative power values of the theta band, especially in frontocentral regions, is the most replicated result in QEEG spectral analysis (10-12). In addition, increased spectral power value for the delta band in ADHD is commonly reported in ADHD (10-12). Otherwise, spectral power of the al- pha and beta bands is reduced in ADHD patients compared to HCs (12). Lastly, increased theta and decreased beta power, which is summarized by the theta/beta ratio, is the most widely repli- cated QEEG finding in ADHD patients (10,13). The theta/beta ratio for clinical assessment in ADHD patients has been com- prehensively investigated (12,13). One of the most replicated EEG coherence findings in ADHD patients is an increase in the inter-hemispheric coherence of the theta band in entire brain regions (14,15). In terms of intra-hemispheric coherence, re- searchers have discovered meaningful left-hemisphere func- tional connectivity deficits in ADHD patients in low-frequency bands, including theta and delta (16,17).
Recently, studies have investigated IGD neurophysiological features using QEEG spectral analysis (18,19). Compared to HCs, decreased absolute beta power and increased absolute gamma power were seen in IGD participants (18,19). Greater absolute gamma power was significantly correlated with IGD symptom level (19). To date, there have been few studies on QEEG coher- ence analysis in IGD.
So far, neurobiological characteristics of IGD has not been well studied. In addition, there have been few studies to investi- gate QEEG findings to differentiate between ADHD adolescents and those with comorbid IGD, despite the high comorbidity between IGD and ADHD. Therefore, in this study, we aimed to investigate whether ADHD comorbid with IGD (ADHD+IGD group) or ADHD without comorbidity (ADHD-only group) show- ed any QEEG profile differences. We wanted to identify neuro- physiological features supplying significant clues to the neuro- physiological mechanism of IGD per se as well as IGD+ADHD comorbidity.
MATERIALS AND METHODS Study participants
ADHD+IGD group (16 male patients; mean age, 14.6 ± 1.9) and ADHD-only group (15 male patients; 13.7 ± 0.8) agreed to par- ticipate in this study. All patients visited the Department of Psy- chiatry at Chung-Ang University Medical Center. All participants were screened through an interview assessing their attention, impulsivity, and hyperactivity, as well as Internet game playing patterns. All participants completed the Korean ADHD Rating Scale (K-ARS) (20,21) and Young’s Internet Addiction Scale (YIAS) (22). A structured clinical interview was conducted by psychia- trists based on the Structured Clinical Interview for DSM-5, Pa- tient Edition, Clinician version (SCID-5-CV) (23). In addition, incorporated information from as many sources as were avail-
able. The interview included a description of the presenting problem and a medical history given by a parent or guardian, a physical examination, assessment for neurological soft signs, review of school reports for the past 12 months seeking behav- ioral/learning problems, reports from any other health profes- sionals, and behavioral observations during the assessment.
The inclusion criteria for the ADHD+IGD group were as fol- low: 1) Children and adolescents aged 10–17 years; 2) Diagnosis of ADHD-combined type, which included hyperactive, inatten- tive, and impulsive behaviors based on the SCID-5-CV (23); and 3) Satisfied the criteria for IGD based on DSM-5 section III (3).
Inclusion criteria for the ADHD-only group were as follow: 1) Children and adolescents aged 10–17 years; and 2) Diagnosis of ADHD-combined type based on the SCID-5-CV (23).
The exclusion criterion for the ADHD-only group was YIAS score > 50, which indicates comorbid problematic game play- ing. Exclusion criteria for all groups were as follow: 1) K-ARS score < 18; 2) A history or current episodes of any SCID-5-CV- based psychiatric diagnosis including major depressive disor- der and anxiety disorder, commonly comorbid with IGD, or in addition to ADHD; 3) Severe medical illness; 4) Past or current substance use disorders; 5) Psychotropic medication including psychostimulants during the last month; 6) History of problem- atic prenatal, perinatal, or neonatal period, consciousness dis- order, head injury with cerebral symptoms, history of central nervous system diseases, convulsions or history of convulsive disorders, paroxysmal headaches or tics; or 7) A low IQ (Kore- an-Wechsler Intelligence Scale for Children IV score < 70, Ko- rean-Wechsler Adult Intelligence Scale IV score < 70).
HC group (mean age, 14.4 ± 1.7) included 14 male partici- pants between the ages of 13 and 19 years who were age matched with the ADHD+IGD group and ADHD-only group. The HC group consisted of children and adolescents from local schools and community groups. All participants in the HC group were free of neurological or medical disease/history, had no history of head injury or drug or alcohol abuse, were of normal IQ, show- ed evidence of adequate functioning at home/school for the past 2 years, and had not taken any prescribed medication for at least 90 days prior to evaluation. Children were also excluded if spike wave activity was present in the EEG.
Measures
Participants were assessed with YIAS, K-ARS, and QEEG using a 21-channel digital EEG system.
Clinical symptom measures
The YIAS consists of 20 self-evaluating questions, each scored on a 1 to 5 (“rarely” to “always”) scale. YIAS scores above 50 were considered to reflect problematic Internet use (22). The K-ARS is a scale for ADHD symptom severity composed of 18 items (9 items for assessing inattention and 9 items for assessing hyper-
activity) scored by interviewees as 0 to 3 (“never or rarely” to “very often”) (20,21).
EEG measurement
EEG data was collected using a 21-channel CMXL-P230 EEG system (Grass-Telefactor, West Warwick, RI, USA). Data were acquired from 19 electrodes placed on the scalp based on the International 10/20 system: Fp1, Fp2, F3, F4, F7, F8, Fz, T3, T4, C3, C4, Cz, T5, T6, P3, P4, Pz, O1, and O2. Two additional elec- trodes were placed on the ear lobes: A1 was the ground elec- trode, and A2 was the reference electrode. EEG amplifiers were bandpass filtered from 0.5 to 46 Hz, with a 60 Hz notch filter.
Electrode impedance was maintained below 5 kΩ. Data sam- pling frequency was 256 Hz.
All EEG acquisitions were conducted by 1 technician in an electrically shielded EEG room in the Department of Neurology at Chung-Ang University Medical Center. Participants sat on a comfortable chair with closed eyes and were instructed to re- main awake during EEG acquisition. EEG recording lasted for 10 minutes.
EEG data processing
First, epileptic discharges and other abnormal findings were evaluated by a neurologist, and the applicable participants were excluded. For analyses, 300-second EEG data periods with arti- facts removed were extracted from raw data. EEG data analysis was performed with NeuroSpeed software (Alpha Trace Medi- cal systems, Vienna, Austria). Relative power was calculated for delta (0.5–3.5 Hz), theta (3.5–7.5 Hz), alpha (7.5–12.5 Hz), and beta (12.5–35.0 Hz) bandwidths. Inter-hemispheric coherences for each frequency band between right and left hemisphere ho- mologous sites were calculated for the following 8 pairs: Fp1–
Fp2, F3–F4, F7–F8, C3–C4, T3–T4, T5–T6, P3–P4, and O1–O2.
Intra-hemispheric coherence for each frequency band was also evaluated between the following 18 pairs: Fp1–F3, F3–C3, C3–
P3, P3–O1, Fp1–F7, F7–T3, T3–T5, T5–O1, Fp2–F4, F4–C4, C4–
P4, P4–O2, Fp2–F8, F8–T4, T4–T6, T6–O2, Fz–Cz, and Cz–Pz.
Statistical analysis
Demographic characteristics including age, education years,
illness duration, YIAS score, and K-ARS score for the three groups were analyzed using one-way analysis of variance (ANOVA).
Differences in inter- and intra-hemispheric frequency band co- herence between groups were also analyzed with a one-way ANOVA. When at least 1 group showed statistically significant differences, pairwise comparisons were conducted. The Bon- ferroni correction was used for these post hoc analyses. Finally, correlation analyses were conducted to assess associations be- tween each clinical scale score (YIAS and K-ARS) and QEEG values (relative power values, inter-hemispheric coherence val- ues, and intra-hemispheric coherence values). All analyses were performed with SPSS 23.0 software (SPSS Inc., Chicago, IL, USA) and statistical significance was set at P < 0.05.
Ethics statement
The present study protocol was approved by the Chung-Ang University Hospital Institutional Review Board (C2014159). In- formed consent was submitted by all subjects when they were enrolled.
RESULTS
Demographic characteristics
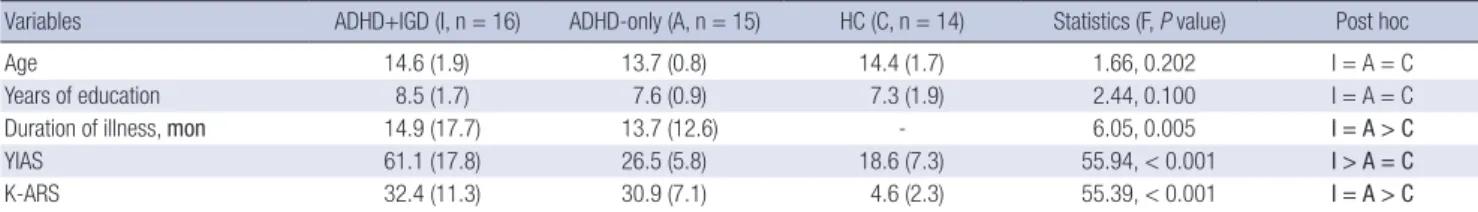
There were no significant differences in age or education years between the ADHD+IGD group, ADHD-only group, and HC group (Table 1). The mean YIAS score in the ADHD+IGD group (mean ± standard deviation [SD], 61.1 ± 17.8) was higher than that in the ADHD-only group (26.5 ± 5.8) and that in the HC group (18.6 ± 7.3; F = 55.94, P < 0.001). Mean K-ARS scores for the ADHD+IGD group (mean ± SD, 32.4 ± 11.3) and ADHD- only group (30.9 ± 7.1) were significantly higher than for the HC group (4.6 ± 2.3; F = 55.39, P < 0.001) (Table 1). There were no significant differences in mean K-ARS score between the ADHD+IGD group and ADHD-only group.
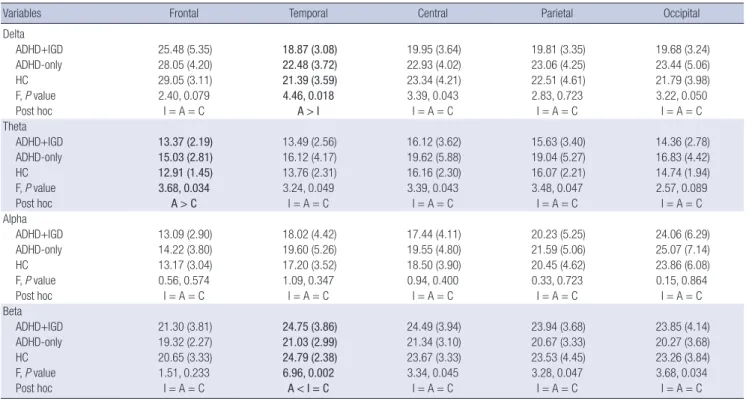
Spectral analysis for relative power by band
The relative power values of the delta band in temporal regions were significantly greater in the ADHD-only group compared to the ADHD+IGD group (F = 4.46, P = 0.018; Table 2). The rela- tive power values of the theta band in frontal regions were signi-
Table 1. Demographic characteristics of the study population
Variables ADHD+IGD (I, n = 16) ADHD-only (A, n = 15) HC (C, n = 14) Statistics (F, P value) Post hoc
Age 14.6 (1.9) 13.7 (0.8) 14.4 (1.7) 1.66, 0.202 I = A = C
Years of education 8.5 (1.7) 7.6 (0.9) 7.3 (1.9) 2.44, 0.100 I = A = C
Duration of illness, mon 14.9 (17.7) 13.7 (12.6) - 6.05, 0.005 I = A > C
YIAS 61.1 (17.8) 26.5 (5.8) 18.6 (7.3) 55.94, < 0.001 I > A = C
K-ARS 32.4 (11.3) 30.9 (7.1) 4.6 (2.3) 55.39, < 0.001 I = A > C
Demographic and clinical characteristics were analyzed using ANOVA and independent t-test; Post hoc comparisons were carried out using Bonferroni correction; Data are pre- sented as mean (SD); Bold font indicates statistically significant group differences.
ADHD = attention deficit hyperactivity disorder, IGD = internet gaming disorder, ADHD+IGD = ADHD comorbid with IGD group, ADHD-only = ADHD without comorbidity group, HC = healthy control group, YIAS = Young’s Internet Addiction Scale, K-ARS = Korean ADHD Rating Scale, ANOVA = analysis of variance, SD = standard deviation.
Table 2. Relative power comparisons for EEG frequency bands between ADHD+IGD (I) and ADHD-only (A) and HC (C) groups
Variables Frontal Temporal Central Parietal Occipital
Delta
ADHD+IGD 25.48 (5.35) 18.87 (3.08) 19.95 (3.64) 19.81 (3.35) 19.68 (3.24)
ADHD-only 28.05 (4.20) 22.48 (3.72) 22.93 (4.02) 23.06 (4.25) 23.44 (5.06)
HC 29.05 (3.11) 21.39 (3.59) 23.34 (4.21) 22.51 (4.61) 21.79 (3.98)
F, P value 2.40, 0.079 4.46, 0.018 3.39, 0.043 2.83, 0.723 3.22, 0.050
Post hoc I = A = C A > I I = A = C I = A = C I = A = C
Theta
ADHD+IGD 13.37 (2.19) 13.49 (2.56) 16.12 (3.62) 15.63 (3.40) 14.36 (2.78)
ADHD-only 15.03 (2.81) 16.12 (4.17) 19.62 (5.88) 19.04 (5.27) 16.83 (4.42)
HC 12.91 (1.45) 13.76 (2.31) 16.16 (2.30) 16.07 (2.21) 14.74 (1.94)
F, P value 3.68, 0.034 3.24, 0.049 3.39, 0.043 3.48, 0.047 2.57, 0.089
Post hoc A > C I = A = C I = A = C I = A = C I = A = C
Alpha
ADHD+IGD 13.09 (2.90) 18.02 (4.42) 17.44 (4.11) 20.23 (5.25) 24.06 (6.29)
ADHD-only 14.22 (3.80) 19.60 (5.26) 19.55 (4.80) 21.59 (5.06) 25.07 (7.14)
HC 13.17 (3.04) 17.20 (3.52) 18.50 (3.90) 20.45 (4.62) 23.86 (6.08)
F, P value 0.56, 0.574 1.09, 0.347 0.94, 0.400 0.33, 0.723 0.15, 0.864
Post hoc I = A = C I = A = C I = A = C I = A = C I = A = C
Beta
ADHD+IGD 21.30 (3.81) 24.75 (3.86) 24.49 (3.94) 23.94 (3.68) 23.85 (4.14)
ADHD-only 19.32 (2.27) 21.03 (2.99) 21.34 (3.10) 20.67 (3.33) 20.27 (3.68)
HC 20.65 (3.33) 24.79 (2.38) 23.67 (3.33) 23.53 (4.45) 23.26 (3.84)
F, P value 1.51, 0.233 6.96, 0.002 3.34, 0.045 3.28, 0.047 3.68, 0.034
Post hoc I = A = C A < I = C I = A = C I = A = C I = A = C
Relative power values were analyzed using ANOVA; Post hoc comparisons were carried out using Bonferroni correction; Data are presented as mean (SD); Bold font indicates statistically significant group differences.
EEG = electroencephalography, ADHD = attention deficit hyperactivity disorder, IGD = internet gaming disorder, ADHD+IGD = ADHD comorbid with IGD group, ADHD-only = ADHD without comorbidity group, HC = healthy control group, ANOVA = analysis of variance, SD = standard deviation.
Table 3. Inter-hemispheric coherence differences among ADHD+IGD (I), ADHD-only (A), and HC (C) groups
Variables ADHD+IGD ADHD-only HC F, P value Post
hoc Theta coherence
F3–F4 0.441 (0.129) 0.505 (0.103) 0.375 (0.060) 5.86, 0.006 A > C C3–C4 0.495 (0.169) 0.563 (0.107) 0.413 (0.111) 4.94, 0.012 A > C Iinter-hemispheric coherence values were ANOVA; Post hoc comparisons were car- ried out using Bonferroni correction; Data are presented as mean (SD); Bold font indi- cates statistically significant group differences.
ADHD = attention deficit hyperactivity disorder, IGD = internet gaming disorder, ADHD +IGD = ADHD comorbid with IGD group, ADHD-only = ADHD without comorbidity group, HC = healthy control group, ANOVA = analysis of variance, SD = standard deviation.
ficantly higher in the ADHD-only group compared to HC group (F = 3.68, P = 0.034). The relative power values of the beta band in temporal regions were significantly lower in the ADHD-only group compared to the ADHD+IGD group and HC group (F = 6.96, P = 0.002). In addition, the relative power value of the beta band in the temporal area was positively correlated with K-ARS score in the ADHD+IGD group (Pearson’s r = 0.556, P = 0.025).
There were no significant relative delta, theta, or alpha power differences between the 3 groups in the whole brain.
Coherence analysis Inter-hemispheric coherence
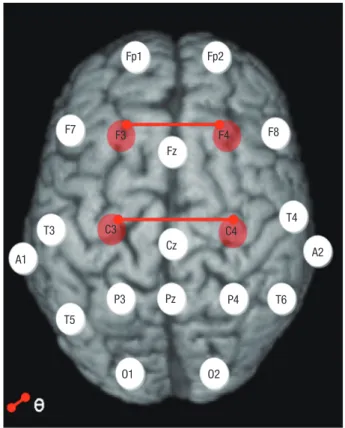
Theta band inter-hemispheric coherence between F3–F4 (F = 5.86, P = 0.006) and C3–C4 electrodes (F = 4.94, P = 0.012) was sig- nificantly higher in the ADHD-only group compared to the HC group (Table 3, Fig. 1). There were no significant associations between YIAS and K-ARS scores and inter-hemispheric coher- ence for any EEG frequency band in each group.
Intra-hemispheric coherence
Intra-hemispheric coherence values of the delta band between P4–O2 electrodes were higher for the ADHD+IGD group com- pared to the ADHD-only group (F = 8.29, P = 0.001; Table 4, Fig.
2). Intra-hemispheric coherence values of the theta band be- tween P4–O2 (F = 10.09, P < 0.001) and T4–T6 (F = 6.63, P = 0.003)
electrodes, of the alpha band between P4–O2 (F = 12.39, P < 0.001) electrodes, and of the beta band between P4–O2 (F = 9.76, P <
0.001) electrodes were significantly higher in the ADHD+IGD group compared to the ADHD-only group and HC group. Intra- hemispheric coherence values of the theta band between Fz–
Cz electrodes were higher in the ADHD+IGD group and AD- HD-only group compared to the HC group (F = 6.30, P = 0.004).
Intra-hemispheric coherence values of the theta band between F4–C4 electrodes were higher in the ADHD+IGD group com- pared to HC group (F = 6.06, P = 0.005).
In the ADHD+IGD group, YIAS score was positively correlat- ed with intra-hemispheric theta coherence (Pearson’s r = 0.677, P = 0.004) between Fz–Cz electrodes. In the ADHD-only group,
Table 4. Intra-hemispheric coherence comparisons among ADHD+IGD (I), ADHD-only (A), and HC (C) groups
Variables ADHD+IGD ADHD-only HC F, P value Post hoc
Delta coherence
P4–O2 0.723 (0.139) 0.504 (0.167) 0.596 (0.144) 8.29, 0.001 I > A
Theta coherence
Fz–Cz 0.726 (0.077) 0.722 (0.067) 0.579 (0.200) 6.30, 0.004 I = A > C
F4–C4 0.670 (0.077) 0.600 (0.095) 0.524 (0.162) 6.06, 0.005 I > C
P4–O2 0.754 (0.096) 0.543 (0.163) 0.608 (0.138) 10.09, < 0.001 I > A = C
T4–T6 0.534 (0.122) 0.410 (0.121) 0.364 (0.159) 6.63, 0.003 I > A = C
Alpha coherence
P4–O2 0.709 (0.109) 0.493 (0.156) 0.509 (0.137) 12.39, < 0.001 I > A = C
Beta coherence
P4–O2 0.688 (0.097) 0.490 (0.150) 0.570 (0.125) 9.76, < 0.001 I > A = C
The intra-hemispheric coherence values were analyzed using ANOVA; Post hoc comparisons were carried out using Bonferroni correction; Data are presented as mean (SD);
Bold font indicates statistically significant group differences.
ADHD = attention deficit hyperactivity disorder, IGD = internet gaming disorder, ADHD+IGD = ADHD comorbid with IGD group, ADHD-only = ADHD without comorbidity group, HC = healthy control group, ANOVA = analysis of variance, SD = standard deviation.
Fig. 1. Interhemispheric coherence comparisons between ADHD-only and HC groups.
Inter-hemispheric coherence values for the theta band between F3–F4 (F = 5.86, P = 0.006) and C3–C4 electrodes (F = 4.94, P = 0.012) were significantly higher in the ADHD-only compared to HC group (see Table 3).
ADHD-only = attention deficit hyperactivity disorder without comorbidity, HC = healthy control.
Fp1 Fp2
F7
T3 A1
T5
T6
O1 O2
P3 Pz P4
Cz
T4
A2
C3 C4
F3 F4
Fz
F8
Fig. 2. Intra-hemispheric coherence comparisons between ADHD+IGD and ADHD- only groups. Intra-hemispheric coherence values for the delta band between P4–O2 electrodes were higher in the ADHD+IGD group compared to the ADHD-only group (F
= 8.29, P = 0.001, solid line). Intra-hemispheric theta band coherence values be- tween P4–O2 (F = 10.09, P < 0.001) and T4–T6 (F = a6.63, P = 0.003) electrodes, for the alpha band between P4–O2 (F = 12.39, P < 0.001) electrodes, and for the beta band between P4–O2 (F = 9.76, P < 0.001) electrodes were significantly higher in the ADHD+IGD group compared to the ADHD-only and HC groups (dotted lines) (see Table 4).
ADHD+IGD = attention deficit hyperactivity disorder comorbid with internet gaming disorder, ADHD-only = attention deficit hyperactivity disorder without comorbidity, HC
= healthy control.
Fp1 Fp2
F7
T3 A1
T5
T6
O1 O2
P3 Pz P4
Cz
T4 A2
C3 C4
F3 F4
Fz
F8 YIAS score was positively correlated with intra-hemispheric beta
coherence values (Pearson’s r = 0.519, P = 0.047) between P4–
O2 electrodes. Lastly, both ADHD+IGD group and ADHD-only group YIAS scores were positively correlated with intra-hemi- spheric delta coherence (Pearson’s r = 0.468, P = 0.008) between P4–O2 electrodes, for theta between P4–O2 (Pearson’s r = 0.546, P = 0.001) and T4–T6 (Pearson’s r = 0.406, P = 0.023) electrodes,
for alpha (Pearson’s r = 0.535, P = 0.002) between P4–O2 elec- trodes, and for beta (Pearson’s r = 0.636, P < 0.001) between P4–
O2 electrodes.
DISCUSSION
In this study, differences in QEEG features were evaluated be- tween ADHD+IGD group, ADHD-only group, and HC group by analyzing relative power and inter-hemispheric and intra-hemi- spheric coherence to find whether IGD comorbidity with ADHD was distinguishable from pure ADHD and cognitively healthy adolescents. In this study, ADHD+IGD group showed lower rel- ative delta band power and greater relative beta band power values in temporal regions compared to ADHD-only group. Rel- ative theta power in frontal regions was significantly higher in the ADHD-only group compared to the HC group in this study.
In previous ADHD studies, an increase in relative theta and delta power as well as theta/beta ratio has been commonly re- ported (9). In addition, a decrease in relative alpha and beta pow- er has been also reported (11,24,25). In addition to the increase in theta/beta ratio (15), a decrease in beta activity (26) and an increase in delta activity (27,28) have been interpreted as corti- cal hypoarousal during information processing, particularly in cognitive and attentional tasks. However, in this study, there was no significant difference in relative beta power between the ADHD+IGD and HC groups. In addition, in contrast to the AD- HD-only group, relative theta power was not significantly dif- ferent between the ADHD+IGD group and HC group in this study.
Beta activity increase tends to reflect brain cortical activity enhancement (29). In a previous QEEG study, methylphenidate treatment resulted in an increase in beta power in centro-pari- etal regions, which was correlated with behavioral and cogni- tive symptom improvement (30). It has been suggested that vid- eo game playing might stimulate synaptic dopaminergic trans- mission similar to methylphenidate stimulation in ADHD, which could result in attentional capacity enhancement (31). There- fore, Internet video game playing might be a means of self-med- ication in IGD patients with attentional problems (31). In fact, in this study, relative beta power in temporal regions was posi- tively correlated with ADHD symptoms severity in the ADHD+
IGD group.
Taken together, these results cautiously suggest that greater vulnerability to attention difficulties seems to be correlated with Internet game play to enhance attentional ability. In turn, rela- tive beta power in attention deficit was similar to that in healthy adolescents. In this study, theta band inter-hemispheric coher- ence values in frontal and central regions were significantly great- er in the ADHD-only group compared to the HC group in this study.
In spite of the inconsistent results of previous studies, one of the most common findings is that ADHD children show increas- ed inter-hemispheric coherence in theta bands throughout en- tire brain regions (14,32). This is thought to reflect widespread ADHD deficits in hemispheric specialization (14). Barry et al.
(14) have suggested that density increase in short neuronal fi- bers during normal brain maturation might result in coherence decrease between right and left hemispheres. The reason for coherence reduction seems to be complexity and competition between neurons during maturational processes (14). A recent fMRI study has reported that atypical default mode network con- nectivity in ADHD patients, including both greater and lesser functional connectivity, might indicate failure of the maturation- al processes (33). In the present study, the ADHD+IGD group showed no theta band inter-hemispheric coherence differenc- es in frontal and central regions compared to the HC group. This suggests that continuous game playing induces complex com- petitions and interactions between inter-hemispheric neurons.
A previous functional neuroimaging study has reported that IGD severity was positively correlated with reactivity in right medial frontal and right parahippocampal areas in response to gaming cues (34). These regions showed high reactivity in re- sponse to gaming cues related to the brain dopaminergic reward system (34,35). In addition, several functional neuroimaging studies have suggested that Internet gaming stimulates cortico- striatal-limbic circuitry in participants with or without IGD (34, 36). The dorsolateral prefrontal cortex and temporoparietal junc- tion, which play main roles in working memory, are significant- ly stimulated by gaming cues (34).
Taken together, these results indicate that repetitive activation of the brain dopaminergic reward system and working memory system during gaming induce complex competitions and inter- actions between inter-hemispheric neurons, which is reflected in a decrease in theta band inter-hemispheric coherence in fron- tal and central regions.
In this study, delta, theta, alpha, and beta band intra-hemi- spheric coherence in parieto-occipital regions were significant- ly higher in the ADHD+IGD group compared to the ADHD-on- ly group. Increased right medial parieto-occipital intra-hemi- spheric coherence in the ADHD+IGD group might be associat- ed with a continuous gaming stimulus. In the same context, IGD symptom severity evaluated by YIAS was positively correlated with delta, theta, alpha, and beta band intra-hemispheric co- herence in parieto-occipital regions in the ADHD+IGD group in this study. Visual information from the occipital cortex dur- ing Internet gaming is sent to parietal association areas, includ- ing the parieto-occipital junction, where cognitive memory pro- cessing and motor activity are integrated (37). During this pro- cess, the medial parieto-occipital junction plays a central role in visuomotor information processing (38). Therefore, consis- tent activation of visuospatial working memory during Internet gaming can increase intra-hemispheric coherence in the right medial parieto-occipital area.
Intra-hemispheric theta band coherence in temporal elec- trodes was higher in the ADHD+IGD group compared to the HC group. As stated above in the inter-hemispheric coherence
section, Internet game play stimulates the working memory cir- cuit including connectivity between the dorsolateral prefrontal cortex and temporo-parietal junction (5).
In summary, repetitive visuospatial working memory and executive function activation during Internet gaming can cause an increase in neuronal connectivity among the parieto-occipi- tal, fronto-central and temporal regions, which is reflected in an increase in inter-hemispheric coherence in those regions.
There are possible limitations in this study. First, sample size was quite small. Second, the cross-sectional design cannot es- tablish whether altered connectivity in ADHD+IGD group com- pared to ADHD-only group is an IGD state or trait marker. Third, clinical symptom severity was established via self-reports scales, not by clinicians. Finally, although there has been solid evidence of their correlation with real neuronal activity, signals from each EEG scalp electrode might reflect summed brain activity from various cortical regions beneath the electrode (39,40).
In conclusion, the ADHD+IGD group and ADHD-only group showed QEEG profile differences providing clues to understand the neurophysiological mechanisms of IGD per se and IGD co- morbidity in ADHD patients. We cautiously suggest that those who have greater vulnerability to attention difficulties seem to continuously play Internet games as a subconscious means to enhance attentional ability. Repetitive activation of the brain’s dopaminergic reward and working memory systems during con- tinuous game play might induce complex competitions and in- teractions between inter-hemispheric neurons, which is reflect- ed by a decrease in inter-hemispheric theta band coherence in frontal and central regions. Additionally, repetitive visuospatial working memory and executive function activation during con- tinuous Internet gaming might cause an increase in neuronal connectivity within the parieto-occipital and temporal regions.
DISCLOSURE
The authors have no potential conflicts of interest to disclose.
AUTHOR CONTRIBUTION
Conceptualization: Park JH, Hong JS, Kim SM. Data curation:
Park JH, Hong JS, Han DH, Min KJ, Lee YS, Kim SM. Formal anal- ysis: Han DH, Kim SM. Funding acquisition: Kim SM. Investiga- tion: Park JH, Hong JS, Kim SM. Writing - original draft: Park JH, Hong JS. Writing - review & editing: Han DH, Min KJ, Lee YS, Kim SM.
ORCID
Jeong Ha Park http://orcid.org/0000-0001-6983-9566 Ji Sun Hong http://orcid.org/0000-0002-3898-8427 Doug Hyun Han http://orcid.org/0000-0001-5888-0686
Kyoung Joon Min http://orcid.org/0000-0003-2866-0273 Young Sik Lee http://orcid.org/0000-0003-2161-8232 Baik Seok Kee http://orcid.org/0000-0001-5618-7546 Sun Mi Kim http://orcid.org/0000-0003-4131-0542
REFERENCES
1. Schou Andreassen C, Billieux J, Griffiths MD, Kuss DJ, Demetrovics Z, Maz- zoni E, Pallesen S. The relationship between addictive use of social media and video games and symptoms of psychiatric disorders: a large-scale cross-sectional study. Psychol Addict Behav 2016; 30: 252-62.
2. Kuss DJ, Griffiths MD, Karila L, Billieux J. Internet addiction: a systematic review of epidemiological research for the last decade. Curr Pharm Des 2014; 20: 4026-52.
3. American Psychiatric Association. Diagnostic and Statistical Manual of Mental Disorders: DSM-5. 5th ed. Washington, D.C.: American Psychiat- ric Association, 2013.
4. Dalbudak E, Evren C, Aldemir S, Coskun KS, Ugurlu H, Yildirim FG. Rela- tionship of Internet addiction severity with depression, anxiety, and alex- ithymia, temperament and character in university students. Cyberpsychol Behav Soc Netw 2013; 16: 272-8.
5. Han DH, Kim SM, Bae S, Renshaw PF, Anderson JS. Brain connectivity and psychiatric comorbidity in adolescents with Internet gaming disor- der. Addict Biol Forthcoming 2015.
6. Bioulac S, Arfi L, Bouvard MP. Attention deficit/hyperactivity disorder and video games: a comparative study of hyperactive and control children.
Eur Psychiatry 2008; 23: 134-41.
7. Weinstein A, Weizman A. Emerging association between addictive gam- ing and attention-deficit/hyperactivity disorder. Curr Psychiatry Rep 2012;
14: 590-7.
8. Ha JH, Yoo HJ, Cho IH, Chin B, Shin D, Kim JH. Psychiatric comorbidity assessed in Korean children and adolescents who screen positive for In- ternet addiction. J Clin Psychiatry 2006; 67: 821-6.
9. Alba G, Pereda E, Mañas S, Méndez LD, González A, González JJ. Electro- encephalography signatures of attention-deficit/hyperactivity disorder:
clinical utility. Neuropsychiatr Dis Treat 2015; 11: 2755-69.
10. Bresnahan SM, Barry RJ. Specificity of quantitative EEG analysis in adults with attention deficit hyperactivity disorder. Psychiatry Res 2002; 112: 133- 44.
11. Clarke AR, Barry RJ, Dupuy FE, Heckel LD, McCarthy R, Selikowitz M, John- stone SJ. Behavioural differences between EEG-defined subgroups of chil- dren with attention-deficit/hyperactivity disorder. Clin Neurophysiol 2011;
122: 1333-41.
12. Koehler S, Lauer P, Schreppel T, Jacob C, Heine M, Boreatti-Hümmer A, Fallgatter AJ, Herrmann MJ. Increased EEG power density in alpha and theta bands in adult ADHD patients. J Neural Transm (Vienna) 2009; 116:
97-104.
13. Snyder SM, Hall JR. A meta-analysis of quantitative EEG power associat- ed with attention-deficit hyperactivity disorder. J Clin Neurophysiol 2006;
23: 440-55.
14. Barry RJ, Clarke AR, McCarthy R, Selikowitz M. EEG coherence in atten- tion-deficit/hyperactivity disorder: a comparative study of two DSM-IV types. Clin Neurophysiol 2002; 113: 579-85.
15. Barry RJ, Clarke AR, McCarthy R, Selikowitz M, Rushby JA, Ploskova E.
EEG differences in children as a function of resting-state arousal level.
Clin Neurophysiol 2004; 115: 402-8.
16. Ahmadlou M, Adeli H. Wavelet-synchronization methodology: a new ap- proach for EEG-based diagnosis of ADHD. Clin EEG Neurosci 2010; 41:
1-10.
17. Ahmadlou M, Adeli H. Fuzzy synchronization likelihood with application to attention-deficit/hyperactivity disorder. Clin EEG Neurosci 2011; 42:
6-13.
18. Son KL, Choi JS, Lee J, Park SM, Lim JA, Lee JY, Kim SN, Oh S, Kim DJ, Kwon JS. Neurophysiological features of Internet gaming disorder and alcohol use disorder: a resting-state EEG study. Transl Psychiatry 2015; 5: e628.
19. Choi JS, Park SM, Lee J, Hwang JY, Jung HY, Choi SW, Kim DJ, Oh S, Lee JY. Resting-state beta and gamma activity in Internet addiction. Int J Psy- chophysiol 2013; 89: 328-33.
20. DuPaul GJ. Parent and teacher ratings of ADHD symptoms: psychomet- ric properties in a community-based sample. J Clin Child Psychol 1991;
20: 245-53.
21. So YK, Noh JS, Kim YS, Ko SG, Koh YJ. The reliability and validity of Kore- an parent and teacher ADHD rating scale. J Korean Neuropsychiatr As- soc 2002; 41: 283-9.
22. Young KS. Internet addiction: the emergence of a new clinical disorder.
Cyberpsychol Behav 1998; 1: 237-44.
23. First M, Williams J, Karg R, Spitzer R. User’s Guide for the SCID-5-CV Struc- tured Clinical Interview for DSM-5 Disorders: Clinician Version. Arling- ton, VA: American Psychiatric Association, 2016.
24. Clarke AR, Barry RJ, McCarthy R, Selikowitz M, Johnstone SJ. Effects of imipramine hydrochloride on the EEG of children with attention-deficit/
hyperactivity disorder who are non-responsive to stimulants. Int J Psy- chophysiol 2008; 68: 186-92.
25. Barry RJ, Clarke AR, Johnstone SJ. A review of electrophysiology in atten- tion-deficit/hyperactivity disorder: I. Qualitative and quantitative electro- encephalography. Clin Neurophysiol 2003; 114: 171-83.
26. Lubar JF. Discourse on the development of EEG diagnostics and biofeed- back for attention-deficit/hyperactivity disorders. Biofeedback Self Regul 1991; 16: 201-25.
27. González JJ, Méndez LD, Mañas S, Duque MR, Pereda E, De Vera L. Per- formance analysis of univariate and multivariate EEG measurements in the diagnosis of ADHD. Clin Neurophysiol 2013; 124: 1139-50.
28. Nazari MA, Wallois F, Aarabi A, Berquin P. Dynamic changes in quantita- tive electroencephalogram during continuous performance test in chil- dren with attention-deficit/hyperactivity disorder. Int J Psychophysiol 2011;
81: 230-6.
29. Jaworska N, Berrigan L, Ahmed AG, Gray J, Korovessis A, Fisher DJ, Brad- ford J, Federoff P, Knott VJ. The resting electrophysiological profile in adults with ADHD and comorbid dysfunctional anger: a pilot study. Clin EEG Neurosci 2013; 44: 95-104.
30. Loo SK, Bilder RM, Cho AL, Sturm A, Cowen J, Walshaw P, Levitt J, Del’H- omme M, Piacentini J, McGough JJ, et al. Effects of d-methylphenidate, guanfacine, and their combination on electroencephalogram resting state spectral power in attention-deficit/hyperactivity disorder. J Am Acad Child Adolesc Psychiatry 2016; 55: 674-682.e1.
31. Han DH, Lee YS, Na C, Ahn JY, Chung US, Daniels MA, Haws CA, Ren- shaw PF. The effect of methylphenidate on Internet video game play in children with attention-deficit/hyperactivity disorder. Compr Psychiatry 2009; 50: 251-6.
32. Clarke AR, Barry RJ, McCarthy R, Selikowitz M, Johnstone SJ, Hsu CI, Ma- gee CA, Lawrence CA, Croft RJ. Coherence in children with attention-def- icit/hyperactivity disorder and excess beta activity in their EEG. Clin Neu- rophysiol 2007; 118: 1472-9.
33. Fair DA, Posner J, Nagel BJ, Bathula D, Dias TG, Mills KL, Blythe MS, Giwa A, Schmitt CF, Nigg JT. Atypical default network connectivity in youth with attention-deficit/hyperactivity disorder. Biol Psychiatry 2010; 68: 1084-91.
34. Han DH, Bolo N, Daniels MA, Arenella L, Lyoo IK, Renshaw PF. Brain ac- tivity and desire for Internet video game play. Compr Psychiatry 2011; 52:
88-95.
35. Ko CH, Liu GC, Hsiao S, Yen JY, Yang MJ, Lin WC, Yen CF, Chen CS. Brain activities associated with gaming urge of online gaming addiction. J Psy- chiatr Res 2009; 43: 739-47.
36. Sun Y, Ying H, Seetohul RM, Xuemei W, Ya Z, Qian L, Guoqing X, Ye S. Brain fMRI study of crave induced by cue pictures in online game addicts (male adolescents). Behav Brain Res 2012; 233: 563-76.
37. Galletti C, Kutz DF, Gamberini M, Breveglieri R, Fattori P. Role of the me- dial parieto-occipital cortex in the control of reaching and grasping move- ments. Exp Brain Res 2003; 153: 158-70.
38. Rizzolatti G, Fogassi L. The mirror mechanism: recent findings and per- spectives. Philos Trans R Soc Lond B Biol Sci 2014; 369: 20130420.
39. Britz J, Van De Ville D, Michel CM. BOLD correlates of EEG topography reveal rapid resting-state network dynamics. Neuroimage 2010; 52: 1162- 70.
40. Musso F, Brinkmeyer J, Mobascher A, Warbrick T, Winterer G. Spontane- ous brain activity and EEG microstates. A novel EEG/fMRI analysis ap- proach to explore resting-state networks. Neuroimage 2010; 52: 1149-61.