Prevalence and Trends of Dementia in Korea: A Systematic Review and Meta-Analysis
Through a systematic review and meta-analysis of epidemiological studies on dementia, we assessed the prevalence of dementia and its subtypes—Alzheimer’ disease (AD) and vascular dementia (VaD)—in Korea. We searched for epidemiological studies on dementia published in 1990-2013 using PubMed, Scopus, EMBASE, KoreaMed, KISS, and RiCH.
Dementia prevalence in elderly patients (aged ≥ 65 yr) was 9.2% (95% confidence interval [CI], 8.2%-10.4%) from 11 studies, which was higher than those from Western and other Asian countries. AD was the most prevalent dementia type, with a prevalence of 5.7%
(95% CI, 5.0%-6.4%) from 10 studies compared with 2.1% (95% CI, 1.6%-2.7%) for VaD from 9 studies. The age-specific prevalence of dementia approximately doubled with each 5.8-yr increase of age. Although a significant increasing trend of dementia prevalence was not observed, it increased slightly from 7.3% to 8.7% after 2005; AD prevalence increased after 1995 and VaD prevalence decreased after the early 2000s. The AD/VaD ratio increased from 1.96 in the early 1990s to 4.13 in the 2010s, similar to the worldwide ratio. Owing to this high prevalence in the aging population, dementia will impose significant economic burdens to Korean society.
Keywords: Dementia; Prevalence; Trends; Meta-Analysis; Korea You Joung Kim,1 Ji Won Han,2
Yoon Seop So,2 Ji Young Seo,2 Ka Young Kim,2 and Ki Woong Kim1,2,3,4
1National Institute of Dementia, Seongnam;
2Department of Neuropsychiatry, Seoul National University Bundang Hospital, Seongnam;
3Department of Psychiatry, Seoul National University College of Medicine, Seoul; 4Department of Brain and Cognitive Science, Seoul National University College of Natural Sciences, Seoul, Korea Received: 14 March 2014
Accepted: 24 April 2014 Address for Correspondence:
Ki Woong Kim, MD
Department of Neuropsychiatry, Seoul National University College of Medicine and Seoul National University Bundang Hospital, 166 Gumi-ro, Bundang-gu, Seongnam 463-707, Korea Tel: +82.31-787-7432, Fax: +82.31-787-4058
E-mail: [email protected]
Funding: This study was supported by a grant from the Korean Health Technology R&D Project, Ministry of Health, Welfare and Family Affairs, Republic of Korea (Grant No. A092077).
http://dx.doi.org/10.3346/jkms.2014.29.7.903 • J Korean Med Sci 2014; 29: 903-912
INTRODUCTION
Although a rapid increase in the number of patients with de- mentia is a worldwide problem with significant health and eco- nomic consequences, the rates of increase is not uniform. The numbers in developed countries are expected to increase by 100% between 2001 and 2040 and by > 300% in Asian and South American countries (1). The rate of growth of the aged popula- tion in the Republic of Korea (hereafter, Korea) is known to be one of the fastest in the world (2). Korea is expected to move from an aging society to a “super-aged” society in only 26 yr (2000-2026), and 37.6% (17.9 million) of the population is ex- pected to be of the age > 65 yr by 2050 (2). In addition, the rapid industrialization in the past four decades has brought extensive changes in the structure and value of Korean families. For ex- ample, the percentage of one-person households is increasing, particularly in the elderly population where it will reach approx- imately 33%. At the same time, more women have started to work; therefore, the number of informal caregivers is decreas- ing. Because of this rapidly aging population and progressive westernization of lifestyle, dementia has emerged as a major health problem in Korea (3, 4).
It is essential to accurately estimate the current and future
prevalence as well as the risk factors of dementia in elderly adults in Korea, which will be used to effectively plan the long-term care and medical costs that will be covered by the National Health Insurance, National Medical Aid Program, National Long-term Care Insurance, and other private insurance programs. In 2008, the Nationwide Survey on Dementia Epidemiology of Korea (NaSDEK), the first study of its kind, was conducted (5). From the results of the NaSDEK study, the standardized prevalence of dementia based on age, sex, education, and urban residency was estimated to be 8.1% (95% confidence interval [CI], 6.9%- 9.2%) for overall dementia and 24.1% (95% CI, 21.0%-27.2%) for mild cognitive impairment. In 2012, a second NaSDEK study was conducted from which the prevalence was estimated to be 8.7% (95% CI, 6.7%-10.8%) for overall dementia and 24.1% (95%
CI, 21.0%-27.2%) for mild cognitive impairment. As in Western countries, Alzheimer disease (AD) was the most prevalent sub- type (5.7% in 2008; 6.2% in 2012) followed by vascular dementia (VaD) (2.0% in 2008; 1.5% in 2012) in the NaSDEK studies.
Before the NaSDEK study, there have been many epidemio- logical studies on dementia in the elderly population in Korea since 1990 (6-17). These studies were conducted in regional po- pulations by using various study designs and diagnostic evalua- tions, and reported a wide range of estimates on dementia prev- Neuroscience
alence. However, the results of these studies may provide in- sight into the possible epidemiological transition of dementia in the past 2 decades and the potential impacts of the study methods on the prevalence estimates of dementia, which the NaSDEK study could not provide in 2008 or 2012. Whether the variance in the estimates of dementia prevalence reflects real regional differences or methodological approaches has never been studied. To our knowledge, no meta-analysis on the prev- alence or trends of dementia in the Korean population has been performed. Therefore, we performed a meta-analysis of epide- miological studies of dementia conducted in 1990-2013 to in- vestigate the epidemiological transition of dementia and po- tential moderator variables that may affect heterogeneity in the prevalence estimates in Korea.
MATERIALS AND METHODS Literature search
A literature search was conducted using the following electron- ic databases: PubMed, Scopus, EMBASE, KoreaMed, KISS, and RiCH. The literature search was limited to studies published in 1990-2013. A survey report of the Korean Ministry of Health and Welfare was also used in this meta-analysis. We screened titles and abstracts by using the following search terms: (“De- mentia” [MeSH] and ((“Prevalence” [MeSH] OR “Epidemiolo- gy” [MeSH]) and (Korea) or (Korean)) for PubMed; (“Demen- tia” [Mesh] and “Prevalence” [MeSH]) for KoreaMed; and (“De- mentia” [Mesh] and “Prevalence” [MeSH] in Korean) for KISS and RiCH. Search terms with a wider scope were used to search for literature in PubMed, Scopus, and EMBASE because of the lack of compatibility of Korean electronic databases with the other electronic databases.
The Preferred Reporting Items for Systematic Reviews and Meta-Analyses (PRISMA) systematic review guidelines (18) were followed. In the first stage, we excluded studies that were clearly irrelevant, duplicates within or between databases, studies with insufficient description of the weighting adjustment method used, and studies with convenience sampling. In the second stage, we reviewed the abstracts of the remaining articles and included the studies that fulfilled the following inclusion crite- ria: 1) cases were collected according to a population-based field survey, and were not based on hospital or institutional data or the follow-up phase of a cohort population; 2) the study re- ported the number of patients aged ≥ 60 yr, and 3) dementia was not diagnosed purely on the basis of cognitive impairment, such as according to a cut point on the Mini-Mental State Ex- amination (MMSE).
Data extraction
Data extraction was performed to determine the prevalence of dementia, including the following four sections that were based
on methodological factors and the characteristics of the study population:
1) Study design: method of screening, diagnosis and confir- mation, and sampling
2) Participants: sample size and response rate and character- istics of participants such as age-group, study location, and re- siding in an urban or rural area
3) Dementia identification: screening tools, diagnostic crite- ria, and instruments
4) Results: overall prevalence of dementia and that of the sub- types, AD and VaD.
The prevalence was extracted on the basis of the available data considering the prevalence and total number of patients according to sex, urban residency, 5-yr age-bands, and publica- tion year presented in the articles. The effective prevalence con- sidering each parameter could be calculated by using the prev- alence for the different parameters and the total number of pa- tients.
Quality assessment
Quality of studies was assessed by using the quality scoring me- thod proposed by the World Alzheimer’s Report (WAR) in 2009 (19) for the following elements:
1) Sample size < 500, 0.5 points; 500-1,499, 1 point; 1,500- 2,999, 1.5 points; and ≥ 3,000, 2 points
2) Design including a 2-phase study with no sampling of screen negatives, 0 points; 2-phase study with sampling of screen neg- atives but no weighting, 1 point; and 1-phase or 2-phase study with appropriate sampling and weighting, 2 points
3) Response proportion < 60%, 1 point; 60%-79%, 2 points;
and ≥ 80%, 3 points
4) Diagnostic assessment inclusion of multi-domain cogni- tive test battery, formal disability assessment, informant inter- view, and clinical interview, 1 point each
Statistical analysis
Meta-analysis was used to synthesize data and calculate the overall prevalence of dementia. A random-effects model was applied because of heterogeneity across the studies, the magni- tude of which was measured by using Higgins I2. Subgroup anal- ysis and meta-regression method were conducted to explain the heterogeneity and investigate the effect of stratifying sub- group factors on the prevalence. For meta-regression, logit event rate and the standard error were calculated. For detecting the presence of publication bias, funnel plots were prepared. The arithmetic equation stated below was used to calculate the in- crement in age for a doubling in the prevalence rate by using the mean log ratio of prevalence increment according to each 5-yr age-band. As we used pooled prevalence rates from meta- analysis for this calculation, a fitted model is not proper for 2 measurements of growing quantity, q1 at time t1 and q2 at time t2
(assuming that prevalence rates grow exponentially): Time
of doubling= (t2-t1)*[log(2)/log(q1/q2)]. All meta-analyses were ana- lyzed by using Comprehensive Meta-Analysis version 2.2 (Bio- Stat International, Englewood, NJ, USA) and STATA 13.0 (Stata- Corp, College Station, TX, USA) software.
RESULTS Included studies
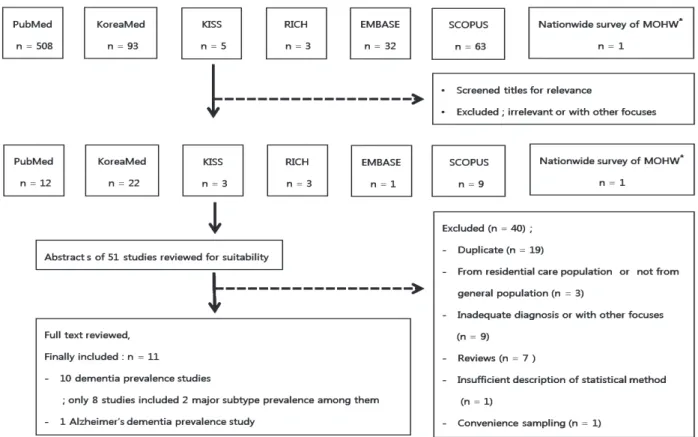
We identified 704 abstracts from 6 databases, of which 508 stud- ies were from PubMed, 93 from KoreaMed, 63 from Scopus, 32 from EMBASE, 5 from KISS, and 3 from RiCH; we also used 1 original report of the Korean Ministry of Health and Welfare. In the first stage, 654 articles were excluded because they were clearly irrelevant studies. In the second stage, 40 articles were excluded because of duplication within or between the data- bases, inadequate sampling or diagnosis, and insufficient de- scription of weighting or standardization. The final sample for meta-analysis included 11 studies (Fig. 1). The characteristics of these studies are summarized in Table 1.
Among the 11 studies, 1 (13) did not provide a prevalence es- timate of overall dementia, and 1 (12) did not provide a preva- lence estimate of AD. These 2 studies did not provide the preva- lence estimates of VaD either. The sample size of the studies rang- ed from 500 to 6,141, and the pooled sample size was 17,703. All
subjects were elderly Korean individuals aged ≥ 65 yr. Table 2 shows the quality of these studies. Nine of the 11 studies used a 2-phase design: population screening in phase I and diagnostic evaluation in phase II. Ten studies provided an adjusted preva- lence. Response rates were generally good (approximately 58%- 96%). Eight studies included the results for comprehensive di- agnostic assessment of dementia, including clinical interview, formal disability assessment, informant interview, and function and neuropsychological assessments.
Pooled prevalence and subgroup analysis
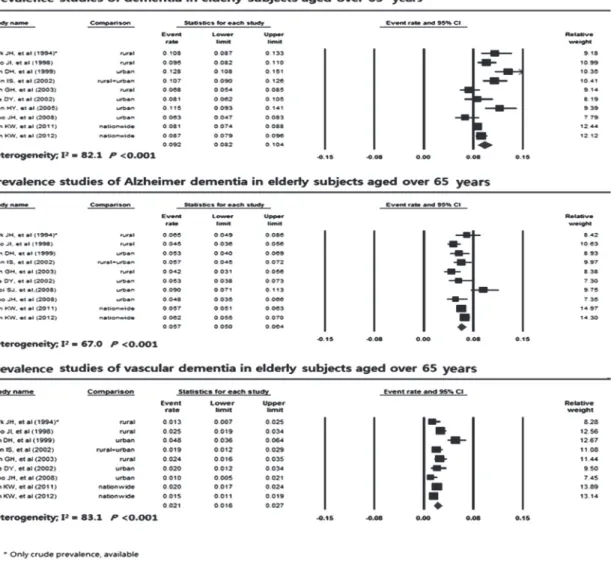
The pooled prevalence of dementia was 9.2% (95% CI, 8.2%- 10.4%) from 10 studies, with the range of prevalence from 6.3%
to 12.8% (Fig. 2). The pooled prevalence of AD and VaD was 5.7% (95% CI, 5.0%-6.4%) from 10 studies and 2.1% (95% CI, 1.6%-2.7%) from 9 studies, respectively (Fig. 3). The overall het- erogeneity in these studies was high (I2= 82.1%, P < 0.001).
The pooled age-specific prevalence of dementia approximate- ly increased with each 5-yr age-band (65-69 yr, 3.0% [95% CI, 2.0%-4.0%]; 70-74 yr, 5.3% [95% CI, 4.0%-7.1%]; 75-79 yr, 11.7%
[95% CI, 9.0%-15.1%]; 80-84 yr, 21.9% [95% CI, 16.5%-28.5%];
≥ 85 yr, 33.2% [95% CI, 25.0%-42.5%]; P < 0.001) (Table 3). The doubling of age-specific prevalence was estimated to be 5.8 yr for overall dementia. Dementia was significantly more preva- lent in women (10.7%; 95% CI, 8.7%-13.2%) than in men (6.8%;
Fig. 1. Summary of literature search.
95% CI, 5.3%-8.6%; P = 0.005). Prevalence of dementia did not differ by the urban residency within the survey area (urban, 9.1% [95% CI, 7.7%-10.7%]; rural, 9.4% [95% CI, 7.9%-11.2%]).
We also compared the prevalence of dementia according to the quality of study, survey year, and proportion of subjects who had no formal education. Considering the study quality score, pooled prevalence significantly differed, ranging from 11.2% for
< 8 points to 8.0% for > 10 points (P = 0.007). Pooled preva- lence of dementia was 7.3%-10.1% considering the survey year.
Although the pooled prevalence tended to decrease from 10.1%
to 7.3% until 2005-2009 and then to increase thereafter to 8.7%, the changes were not significant when urban residency within the surveyed area, quality scores, proportion of uneducated subjects, mean age, and proportion of women were adjusted (P = 0.655).
The pooled age-specific prevalence of AD sharply increased with each 5-yr increase in age from 1.2% in subjects aged 65-69 yr to 28.7% in those aged ≥ 85 yr (P < 0.001) (Table 4). The dou- bling of age-specific prevalence was estimated to be 4.4 yr for AD, which was shorter than that for overall dementia. Preva- lence of AD in women is 7.2% (95% CI, 5.9%-8.9%), which is much higher than the 3.4% (95% CI, 2.6%-4.3%) observed in men (P < 0.001). By quality of study, although it was not signifi- cant, prevalence of AD was from 5.2% to 5.5% in the studies with more than 8 points and 7.2% in the study under 8 points of score.
Prevalence of AD considering the survey year increased slightly from 5.1% in 1995-1999 to 6.2% in 2010-2013, but this was not significant (P = 0.114).
The pooled age-specific prevalence of VaD increased slightly with each 5-yr increase in age from 1.0% in subjects aged 65-69 Table 1. Characteristics of studies, survey procedures, and prevalence of dementia
References Published year (survey year)
Area
(Urbanity) Design Sample size Screening test
Diagnostic tests
Diagnostic criteria
Score of Quality*
Crude prevalence (adjusted prevalence) (%)
Initial Complete Dementia AD VaD
Park et al. (6) 1994 (1990) Yungil
(Rural) 2-stage 766 692 MMSE-K CAMDEX, KWIS, MDRS,
MHIS
DSM-III-R 9 10.8 6.5 1.3
Woo et al. (8) 1998 (1993) Yonchon
(Rural) 2-stage 2,171 436 MMSE-K CERAD-K(C),
CERAD-K(N) DSM-III-R,
NINCDS-ADRDA 9.5 9.4 (9.5) 4.4 (4.5) 2.5 (2.5) Kim et al. (7) 1999 (1997) Kwangmyung
(Urban)
2-stage 1,331 946 K-MMSE SNSB DSM-IV,
NINCDS-ADRDA
8 13.0 (12.8) 5.3 (5.1) 4.8 (4.8) Lee et al. (9) 2002 (2000) Seoul
(Urban) 2-stage 935 643 MMSE-KC CERAD-K DSM-IV-TR, NINCDS-ADRDA, NINDS-AIREN
9 (8.1) (5.3) (2.0)
Shin et al. (10) 2002 (1999) Gwangju (Mixed)
2-stage 1,598 1,134 MMSE-KC, CDR, BDRS, BI DSM-IV, NINCDS- ADRDA, NINDS-AIREN
6 9.7 (10.7) 5.2 (5.7) 1.8 (1.9) Suh et al. (11) 2003 (1997) Yonchon
(Rural) 2-stage 1,217 1,037 K-PAS MDRS DSM-III-R, NINCDS-ADRDA,
NINDS-AIREN
10 (6.8) (4.2) (2.4)
Shin et al. (12) 2005 (2003) Gwangju
(Urban) 1-stage 1,072 706 - CSID-K, GMS
B3-K, WLMT AGECAT algorithm 6 13.0 (11.5) Choi et al. (13) 2008 (2006) Busan
(Urban)
2-stage 1,215 706 MMSE-KC CERAD-K, GDS-K
DSM-IV-TR 7 (9.0)
Jhoo et al. (14) 2008 (2006) Seongnam (Urban)
1-stage 1,118 714 - CERAD-K(C), CERAD-K(N),
CDR
DSM-IV-TR, NINCDS-ADRDA,
NINDS-AIREN
9 5.2 (6.3) 3.9 (4.8) 1.0 (1.0)
Kim et al. (5) 2011 (2008) Nationwide (Mixed)
2-stage 8,199 6,141 MMSE-KC CERAD-K(C), CERAD-K(N), CDR, SGDS-K
DSM-IV, NINCDS-ADRDA,
NINDS-AIREN
10 9.2 (8.1) 6.5 (5.7) 2.3 (2.0)
Kim et al. (30) 2012 (2012) Nationwide (Mixed)
2-stage 6,008 4,016 MMSE-KC CERAD-K(C), CERAD-K(N), CDR, SGDS-K
DSM-IV, NINCDS-ADRDA,
NINDS-AIREN
10 6.7 (8.7) 4.9 (6.2) 1.2 (1.5)
*Proposed by the World Alzheimer’s Report 2009 (19). MMSE-K, Korean version of the Mini Mental Status Examination (31); K-MMSE, Korean Mini-Mental State Examination (32); MMSE-KC, Korean version of the Mini Mental Status Examination in the CERAD Neuropsychological Assessment Packet (33); K-PAS, Korean version of the Psychogeriatric Assessment Scale; CAMDEX, The Cambridge Examination for Mental Disorders of the Elderly (34); KWIS, Korean Wechsler Intelligence Scale (35); MDRS, Mattis Dementia Rat- ing Scale (36); MHIS, Modified Hachinski Ischemic Score (37); CERAD-K(C), Korean version of the Consortium to Establish a Registry for Alzheimer's Disease Clinical Assess- ment Packet (33); CERAD-K(N), Korean version of the Consortium to Establish a Registry for Alzheimer’s Disease Neuropsychological Assessment Packet (33); SNSB, Samsung Neuropsychological Screening Battery (38); CDR, Clinical Dementia Rating (39); BDRS, Blessed Dementia Rating Scale (40); BI, Barthel Index (40); CSID-K, Korean version of the community screening interview for dementia (41); GMS B3-K, Korean version of Geriatric Mental State Schedule B3 (42); WLMT, Word List Memory Test in the CERAD-K(N) (33); GDS-K, Korean version of the Geriatric Depression Scale (43); SGDS-K, Korean version of the Geriatric Depression Scale, short form (43); DSM-III-R, Revision of the Diag- nostic and Statistical Manual of Mental Disorders, Third Edition (44); DSM-IV, Diagnostic and Statistical Manual of Mental Disorders, Fourth Edition (45); DSM-IV-TR, Text revi- sion of the DSM-IV (46); NINCDS-ADRDA, Criteria of the National Institute of Neurological and Communicative Disorders and Stroke and the Alzheimer’s Disease and Related Disorders Association (47); NINDS-AIREN, Criteria of the National Institute of Neurological Disorders and Stroke-Association Internationale pour la Recherche et l’Enseignement en Neurosciences (48); AGECAT, Automated Geriatric Examination for Computer Assisted Taxonomy (49).
Table 2. Quality assessment of the studies*
Elements of quality score Number of studies (%)
Survey year 1990-1994
1995-1999 2000-2004 2005-2009 2010-2013
2 (18.2) 3 (27.3) 2 (18.2) 3 (27.3) 1 (9.1)
Sample size 500-1499
1500-2999 ≥ 3000
8 (72.7) 1 (9.1) 2 (18.2) Design One-phase, or two-phase study with no sampling of screen negatives
Two-phase study with sampling of screen negatives but no weighting back One-phase or two-phase study with appropriate sampling and weighting
2 (18.2) 2 (18.2) 7 (64)
Response proportion < 60%
60-79%
≥ 80%
1 (9.1) 8 (72.7) 2 (18.2)
Comprehensive diagnostic assessment 8
Quality score < 8
8-8.9 9-9.9 ≥ 10
3 (27.3) 1 (9.1) 4 (36.4) 3 (27.3)
*According to the criteria proposed in the World Alzheimer Report 2009.
Fig. 2. Forest plot of prevalence studies of dementia in the elderly Koreans.
yr to 4.2% in those aged 80-84 yr, and then decreased thereafter (P = 0.001) (Table 5). The doubling of age-specific prevalence was estimated to be 7.2 yr in subjects with VaD aged < 84 yr, which was longer than that for subjects with overall dementia.
The pooled prevalence of VaD did not differ considering the sex (P = 0.656) or by urban residency (P = 0.930). The prevalence of VaD decreased from 2.8% in 1995-1999 to 1.5% in 2010-2013, but the change was not significant (P = 0.182).
The prevalence of AD (5.7%; 95% CI, 5.0%-6.4%) was much higher than that of VaD (2.1%; 95% CI, 1.6%-2.7%). The ratio of AD/VaD doubled in the past two decades from 1.96 to 4.13 (P = 0.021) (Fig. 4).
DISCUSSION
Epidemiological indices such as prevalence, incidence, and risk factors play a key role in policymaking, planning, and allocation of health and welfare resources according to specific at-risk populations. To our knowledge, this is the first study since 1990
to review reports of the prevalence of dementia in the elderly population in Korea. By using meta-analysis, we were able to estimate the pooled prevalence of dementia in the elderly pop- ulation in Korea with reasonable precision. The overall preva- lence estimate of dementia of subjects aged ≥ 65 yr in Korea was 9.2%. It is much higher than the prevalence estimates of overall dementia in Asian people (4.19%-7.63%) reported in the World Alzheimer’s Report (WAR) in 2009 (19). This difference may be attributed to mortality and true geographical differenc- es of incidence. However, several other factors should be con- sidered. First, the participants in the WAR in 2009 were younger than those in the present meta-analysis. Furthermore, the WAR in 2009 estimated a pooled prevalence of dementia in the par- ticipants aged ≥ 60 yr. For a direct comparison, we needed a prevalence estimate of dementia in elderly Koreans aged 60-65 yr. Second, other methodologies such as sampling strategy, scre- en ing methods, and criteria that were used to diagnose demen- tia were considerably different between studies. For a direct comparison, a series of subgroup analyses stratified consider- Fig. 3. Time-trend of dementia prevalence in the elderly Koreans (1990-2013).
ing the study methodologies were warranted.
In the past two decades, the prevalence of overall dementia tended to decrease until 2000-2005 and then increased thereaf- ter, although this trend was not statistically significant. Consid- ering that the risk of dementia depends strongly on age and ed- ucation (5), this prevalence trend might have been influenced by the interaction between changes in educational level and life expectancy in Korea; the proportion of uneducated people rap- idly decreased from 54.2% to 19.1% and the life expectancy in- creased from 71.3 yr to 81.4 yr in the past two decades. In a pre- vious trend analyses on Americans, increasing levels of educa- tion among old people explained about 40% of the observed relative decrease in cognitive impairment prevalence compati- ble with dementia between 1993 and 2002 (20). In the past two decades, a dramatic decrease of uneducated people in the el- derly have been driving the decrease of dementia prevalence, particularly in the 1990s before population aging began to ac- celerate in Korea. On the contrary, 10-yr increase of life expec- tancy in the past two decades have been driving the increase dementia prevalence in the same period since dementia preva- lence generally doubles every 5 yr after the age of 65 yr (21). Ko- rea began to move rapidly from an aging society to a super-aged society since 2000. These two strong demographic changes have
been driving interactively the trend of dementia prevalence in the past two decades. Since the decrease of uneducated people will reach at a plateau within 10 yr while the population aging will continue until 2050, the influence of population aging will be stronger than that of better education on dementia prevalence in the future. In the present study, the doubling time of age-spe- cific dementia prevalence was 5.8 yr in Korea. However, it was much longer in low- and middle-income countries (approxi- mately 7.5 yr), which may be attributed, at least in part, to a high mortality in patients with dementia in these countries (22).
AD has been the most prevalent subtype of dementia follow- ed by VaD in Korea, since 1990. Furthermore, the predominance of AD has steadily increased in the past 2 decades in Korea. In this period, the prevalence of AD increased from 5.0% to 6.5%, but that of VaD decreased from 2.8% to 1.5%; therefore, the AD/
VaD ratio increased from 1.96 to 4.13. As the doubling time of age-specific prevalence in AD is much shorter than that in VaD, the AD/VaD ratio will contiuously increase with the accelera- tion of population aging in Korea. The AD/VaD ratio ranged widely from 1.8 to 4.8 in the world (23). In Western countries, AD is the most prevalent type of dementia (1, 24). In Japan, how- ever, VaD was the most prevalent type of dementia in the 1980s (25-27), but became the second most common type after AD Table 3. Prevalence of dementia stratified considering sociodemographic factors, quality of study, and survey year
Factors Numbers† Prevalence 95% CI Heterogeneity Meta-regression
Lower Upper I2 P value* β§ P value*
Age year 65-69 70-74 75-79 80-84 85+
8 8 8 5 4
3.0 5.3 11.7 21.9 33.2
2.02 4.0 9.0 16.5 25.0
4.0 7.1 15.1 28.5 42.5
50.0 85.6 58.2 81.3 86.5
0.051
< 0.001 0.019
< 0.001
< 0.001
0.72 < 0.001
Gender Male
Female 9
9 6.8
10.7 5.3
8.7 8.6
13.2 78.6
91.8 < 0.001
< 0.001 0.051 0.005
Urbanity Urban Rural Rural+Urban
6 5 1
9.1 9.4 10.7
7.7 7.9 7.6
10.7 11.2 14.9
86.3
73.0 < 0.001
0.006 0.04 0.771
Education‡ 0-25%
25-50%
50-75%
75-100%
2 5 2 1
7.6 10.1 8.1 10.8
5.3 8.1 5.9 6.8
10.7 12.4 11.2 16.8
77.9 86.5 83.3
0.03
< 0.001 0.02
0.003 0.373
Survey year 1990-1994 1995-1999 2000-2004 2005-2009 2010-2013
2 3 2 2 1
10.1 9.9 9.7 7.3 8.7
7.3 7.6 6.9 5.2 5.6
13.9 12.9 13.6 10.1 13.3
0.0 90.0 76.9 64.6
0.34
< 0.001 0.04 0.1
-0.07
0.18
0.120
0.406 Quality of study
< 8 8-8.9 9-9.9
≥ 10
2 1 4 3
11.21 12.8
8.8 8.0
9.2 10.0 7.6 7.0
13.3 16.3 10.2 9.2
0.0 70.5 51.3
0.6 0.02 0.13
-0.1 0.007
*Significance; P value < 0.05; †Number of studies that provided data available for each meta-analysis according to adjusted total prevalence, age-specific prevalence and age- gender specific prevalence, partially including crude prevalence; ‡Proportion of the subject who had no formal education (%); §Logit event rate was used for meta regression.
since the 1990s (1, 24). Complex interactions among vascular etiologies, changes in the brain, and host factors including age play roles in the development of VaD (28, 29). The epidemio- logical transition of dementia observed in Japan was explained by the modification of these potential risk factors of VaD. In Ko- rea, nationwide public health promotion programs since 2008 might have contributed to modifying these risk factors and, thus, to decreasing the incidence of VaD.
Although this review aimed to provide the best possible esti- mate of prevalence of dementia in Korea, it has several limita-
tions. Several studies included in the current meta-analysis did not provide a standardized prevalence rate, age- or sex-specific prevalence, or prevalence of the dementia subtypes. Some stud- ies included small sample sizes and, therefore, could not be in- cluded in some subgroup analyses. The stratification methods for potential risk factors of dementia, such as age, were not uni- form across the studies.
In conclusion, the prevalence of dementia in Korea is higher than that in other Asian and Western countries. The prevalence has increased since 2005 because of rapid increase in the aged population. AD is the most prevalent type, and its predominance is expected to increase with an increase in the aged population.
ACKNOWLEDGMENTS
A part of this paper has been presented at the 4th Academic Fo- rum of the National Academy of Medicine of Korea, held on September 26, 2013 in Seoul, Korea.
DISCLOSURE
The authors have no conflicts of interest to disclose.
Table 4. Prevalence of Alzheimer dementia stratified considering sociodemographic factors, quality of study, and survey year
Factors Numbers† Prevalence 95% CI Heterogeneity Meta-regression
Lower Upper I2 P value* β§ P value*
Age year 65-69 70-74 75-79 80-84 85+
5 5 5 3 3
1.2 2.3 7.3 12.5 28.7
0.8 1.5 5.2 8.7 21.1
1.9 3.4 10.0 17.8 37.8
72.7 65.1 38.3 0.0 88.7
0.006 0.022 0.166 0.742
< 0.001
0.88 < 0.001
Gender Male
Female 9
9 3.4
7.2 2.6
5.9 4.3
8.9 79.4
81.2 < 0.001
< 0.001 0.78 < 0.001
Urbanity Urban Rural Rural+Urban
6 5 1
5.8 5.7 5.7
4.9 4.9 3.6
7.0 6.9 8.8
68.4
79.3 0.007
0.001 -0.03 0.834
Education‡ 0-25%
25-50%
50-75%
75-100%
2 4 2 1
6.0 5.6 4.4 6.5
5.4 5.2 3.7 4.9
6.7 6.1 5.2 8.6
52.3 0.0 0.0
0.147 0.942 0.711
-0.003 0.126
Survey year 1990-1994 1995-1999 2000-2004 2005-2009 2010-2013
2 3 1 3 1
5.3 5.1 5.3 6.3 6.2
3.8 3.8 3.1 4.8 4.0
7.5 6.7 8.9 8.3 9.5
75.1 24.5 85.6
0.045 0.266
< 0.001
0.064 0.114
Quality of study
< 8 8-8.9 9-9.9
≥ 10
2 1 4 3
7.2 5.3 5.2 5.5
5.5 3.6 4.2 4.6
9.2 7.8 6.3 6.6
86.1 28.8 67.4
0.007 0.239 0.046
-0.07 0.153
*Significance; P value < 0.05; †Number of studies that provided data available for each meta-analysis according to adjusted total prevalence, age-specific prevalence and age- gender specific prevalence, partially including crude prevalence; ‡Proportion of the subject who had no formal education (%); §Logit event rate was used for meta regression.
Fig. 4. Ratio of prevalence of Alzheimer dementia (AD) to vascular dementia (VaD) con- sidering the survey year (β = 0.13, P = 0.021).
1993 1997 1999 2000 2006 2008 2012 6.0
5.0 4.0 3.0 2.0 1.0
0.0 *Using only adjusted prevalence rate
1.96 1.43
3.00 2.65
4.80
2.85 4.13 the Ratio of AD/VaD*
Table 5. Prevalence of vascular dementia stratified by sociodemographic factors, quality of study, and survey year
Factors Numbers† Prevalence 95% CI Heterogeneity Meta-regression
Lower Upper I2 P value* β§ P value*
Age year 65-69 70-74 75-79 80-84 85+
5 5 5 3 3
1.0 1.9 2.6 4.2 2.4
0.6 1.1 1.6 2.5 1.2
1.7 3.1 4.1 7.2 4.7
0.0 70.6 61.4 62.9 47.4
0.676 0.009 0.035 0.068 0.150
0.3 0.001
Gender Male
Female 8
8 2.2
2.6 1.3
1.5 3.8
4.4 27.0
96.1 0.213
< 0.001 0.17 0.656
Urbanity Urban Rural Rural+Urban
5 5 1
2.0 2.0 1.9
1.3 1.3 0.6
3.0 2.9 5.5
90.8
21.0 < 0.001
0.281 -0.03 0.930
Education‡ 0-25%
25-50%
50-75%
75-100%
2 4 2 1
1.3 2.5 2.5 1.3
0.7 1.6 1.4 0.5
2.4 3.8 4.4 3.5
0.0 89.3 0.0
0.319
< 0.001 0.870
0.003 0.672
Survey year 1990-1994 1995-1999 2000-2004 2005-2009 2010-2013
2 3 1 2 1
1.9 2.8 2.0 1.5 1.5
0.9 1.6 0.7 0.7 0.6
3.9 4.9 5.6 3.1 3.8
69.1 87.4 69.7
0.072
< 0.001 0.069
-0.13 0.182
Quality of study
< 8 8-8.9 9-9.9
≥ 10
1 1 4 3
1.9 4.8 1.8 1.9
1.0 2.8 1.3 1.4
3.5 8.0 2.5 2.6
59.0 63.3
0.062 0.065
-0.07 0.576
*Significance; P value < 0.05; †Number of studies that provided data available for each meta-analysis according to adjusted total prevalence, age-specific prevalence and age- gender specific prevalence, partially including crude prevalence; ‡Proportion of the subject who had no formal education (%); §Logit event rate was used for meta regression.
ORCID
You Joung Kim http://orcid.org/0000-0002-1103-3858 REFERENCES
1. Ferri CP, Prince M, Brayne C, Brodaty H, Fratiglioni L, Ganguli M, Hall K, Hasegawa K, Hendrie H, Huang Y, et al. Global prevalence of dementia:
a Delphi consensus study. Lancet 2005; 366: 2112-7.
2. Population Projections: general and processed statistics, statistics on population. Available at http://www.kosis.kr [accessed on 20 December 2013].
3. Korea National Statistical Office. Report on the population and housing census. Seoul: Korea National Statistical Office, 2005.
4. World Population Prospects. The 2012 revision: population division, de- partment of economic and social affairs. New York: United Nations, 2012.
Available at http://esa.un.org/unpd/wpp [accessed on 20 December 2013].
5. Kim KW, Park JH, Kim MH, Kim MD, Kim BJ, Kim SK, Kim JL, Moon SW, Bae JN, Woo JI, et al. A nationwide survey on the prevalence of de- mentia and mild cognitive impairment in South Korea. J Alzheimers Dis 2011; 23: 281-91.
6. Park J, Ko HJ, Park YN, Jung CH. Dementia among the elderly in a rural Korean community. Br J Psychiatry 1994; 164: 796-801.
7. Kim DH, Na DL, Yeon BG, Kang Y, Min KB, Lee SH, Lee SS, Lee MR, Pyo OJ, Park CB, et al. Prevalence of dementia in the elderly of an urban com- munity in Korea. Korean J Prev Med 1999; 32: 306-16.
8. Woo JI, Lee JH, Yoo KY, Kim CY, Kim YI, Shin YS. Prevalence estimation of dementia in a rural area of Korea. J Am Geriatr Soc 1998; 46: 983-7.
9. Lee DY, Lee JH, Ju YS, Lee KU, Kim KW, Jhoo JH, Yoon JC, Ha J, Woo JI.
The prevalence of dementia in older people in an urban population of Korea: the Seoul Study. J Am Geriatr Soc 2002; 50: 1233-9.
10. Shin IS, Kim JM, Yoon JS, Kim SJ, Yang SJ, Kim WJ, Lee SH, Kang SA, Kwak JY, Lee HY. Prevalence rate and risk factors of dementia compared be- tween urban and rural communities of the Metropolitan Kwangju area.
J Korean Neuropsychiatr Assoc 2002; 41: 1165-73.
11. Suh GH, Kim JK, Cho MJ. Community study of dementia in the older Korean rural population. Aust N Z J Psychiatry 2003; 37: 606-12.
12. Shin HY, Chung EK, Rhee JA, Yoon JS, Kim JM. Prevalence and related factors of dementia in an urban elderly population using a new screen- ing method. J Prev Med Public Health 2005; 38: 351-8.
13. Choi SJ, Jung SS, You YS, Shin BS, Kim JE, Yoon SW, Jeon DW, Baek JH, Park SW, Lee JG, et al. Prevalence of Alzheimer’s dementia and its risk factors in community-dwelling elderly Koreans. Psychiatry Investig 2008;
5: 78-85.
14. Jhoo JH, Kim KW, Huh Y, Lee SB, Park JH, Lee JJ, Choi EA, Han C, Choo IH, Youn JC, et al. Prevalence of dementia and its subtypes in an elderly urban Korean population: results from the Korean Longitudinal Study
on Health and Aging (KLoSHA). Dement Geriatr Cogn Disord 2008; 26:
270-6.
15. Kim J, Jeon IS, Chun JH, Lee SI. The prevalence of dementia in a metro- politan city of South Korea. Int J Geriatr Psychiatry 2003; 18: 617-22.
16. Kwak DI, Choi YK, Jung IK, Lee MS. Epidemiological study of dementia in a Korea urban area. J Korean Geriatr Psychiatry 1999; 3: 44-52.
17. Park NH, Lee YM, E LR. Prevalence and risk factors of dementia in the community elderly. J Korean Acad Community Health Nurs 2008; 19:
36-45.
18. Moher D, Liberati A, Tetzlaff J, Altman DG; PRISMA Group. Preferred reporting items for systematic reviews and meta-analyses: the PRISMA statement. PLoS Med 2009; 6: e1000097.
19. Alzheimer’s Disease International. World Alzheimer’s report 2009. Lon- don: Alzheimer’s Disease International, 2009.
20. Langa KM, Larson EB, Karlawish JH, Cutler DM, Kabeto MU, Kim SY, Rosen AB. Trends in the prevalence and mortality of cognitive impair- ment in the United States: is there evidence of a compression of cognitive morbidity? Alzheimers Dement 2008; 4: 134-44.
21. George-Carey R, Adeloye D, Chan KY, Paul A, Kolčić I, Campbell H, Ru- dan I. An estimate of the prevalence of dementia in Africa: a systematic analysis. J Glob Health 2012; 2: 020401.
22. Llibre Rodriguez JJ, Ferri CP, Acosta D, Guerra M, Huang Y, Jacob KS, Krishnamoorthy ES, Salas A, Sosa AL, Acosta I, et al. Prevalence of de- mentia in Latin America, India, and China: a population-based cross- sectional survey. Lancet 2008; 372: 464-74.
23. Kasai M, Nakamura K, Meguro K. Alzheimer’s disease in Japan and oth- er countries: review of epidemiological studies in the last 10 years. Brain Nerve 2010; 62: 667-78.
24. Suh GH, Shah A. A review of the epidemiological transition in dementia:
cross-national comparisons of the indices related to Alzheimer’s disease and vascular dementia. Acta Psychiatr Scand 2001; 104: 4-11.
25. Shibayama H, Kasahara Y, Kobayashi H. Prevalence of dementia in a Japanese elderly population. Acta Psychiatr Scand 1986; 74: 144-51.
26. Ueda K, Kawano H, Hasuo Y, Fujishima M. Prevalence and etiology of dementia in a Japanese community. Stroke 1992; 23: 798-803.
27. Kiyohara Y, Yoshitake T, Kato I, Ohmura T, Kawano H, Ueda K, Fujishi- ma M. Changing patterns in the prevalence of dementia in a Japanese community: the Hisayama Study. Gerontology 1994; 40: 29-35.
28. Skoog I. Status of risk factors for vascular dementia. Neuroepidemiology 1998; 17: 2-9.
29. De Leeuw FE, de Groot JC, Achten E, Oudkerk M, Ramos LM, Heijboer R, Hofman A, Jolles J, van Gijn J, Breteler MM. Prevalence of cerebral white matter lesions in elderly people: a population based magnetic res- onance imaging study: the Rotterdam Scan Study. J Neurol Neurosurg Psychiatry 2001; 70: 9-14.
30. Kim KW, Gwak KP, Kim BJ, Kim SY, Kim SK, Kim JL, Kim TH, Moon SW, Park JH, Bae JN, et al. 2012 national study on the prevalence of dementia in Korean elders. Seongnam: Seoul National University Bundang Hospi- tal; Ministry of Health & Welfare, 2012.
31. Park JH, Kwon YC. Modification of the mini-mental state examination for use in the elderly in a non-western society: Part I. development of Ko- rean version of mini-mental state examination. Int J Geriat Psychiatr 1990; 5: 381-7.
32. Kang Y, Na DL, Hahn SH. A validity study on the Korean Mini-Mental State Examination (K-MMSE) in dementia patients. J Korean Neurol
Assoc 1997; 15: 300-8.
33. Lee JH, Lee KU, Lee DY, Kim KW, Jhoo JH, Kim JH, Lee KH, Kim SY, Han SH, Woo JI. Development of the Korean version of the consortium to establish a registry for Alzheimer’s disease assessment packet (CERAD- K): clinical and neuropsychological assessment batteries. J Gerontol B Psychol Sci Soc Sci 2002; 57: P47-53.
34. Roth M, Tym E, Mountjoy CQ, Huppert FA, Hendrie H, Goddard H.
CAMDEX: the Cambridge examination for mental disorders of the el- derly (CAMDEX). Cambridge: Cambridge University Press, 1988.
35. Chun YS, Seo BY, Lee CY. Korean Wechsler Intelligence Scale-manual.
Seoul: Chung-Ang Educational Research Center, 1963.
36. Mattis S. Mental Status Examination for organic mental syndrome in the elderly patient. In: Bellak L, Karasu TB, editors. Geriatric psychiatry:
a handbook for psychiatrists and primary care physicians. New York:
Grune & Stratton, 1976, p77-121.
37. Rosen WG, Terry RD, Fuld PA, Katzman R, Peck A. Pathological verifi- cation of ischemic score in differentiation of dementias. Ann Neurol 1980;
7: 486-8.
38. Jung IK, Kwak DI, Joe SH, Lee HS. A study of standardization of Korean form of geriatric depression scale (KGDS). J Korean Geriatr Psychiatry 1997; 1: 61-72.
39. Morris JC. The clinical dementia rating (CDR): current version and scor- ing rules. Neurology 1993; 43: 2412-4.
40. Park JH, Cho SW, Shon HS. Reliability of functional status measurements in elderly people. J Korean Neuropsychiatr Assoc 1995; 34: 475-81.
41. Kim JM, Kim SW, Shin IS, Zheng TJ, Yoon JS. Development of Korean version of community screening interview for dementia (CSID-K). J Ko- rean Neuropsychiatr Assoc 2004; 43: 445-51.
42. Kim JM, Stewart R, Prince M, Shin IS, Yoon JS. Diagnosing dementia in a developing nation: an evaluation of the GMS-AGECAT algorithm in an older Korean population. Int J Geriatr Psychiatry 2003; 18: 331-6.
43. Bae JN, Cho MJ. Development of the Korean version of the geriatric de- pression scale and its short form among elderly psychiatric patients. J Psychosom Res 2004; 57: 297-305.
44. American Psychiatric Association. Diagnostic and statistical manual of mental disorders: DSM-III-R. 3rd ed. Washington, D.C.: American Psy- chiatric Association, 1987.
45. American Psychiatric Association. Diagnostic and statistical manual of mental disorders: DSM-IV. 4th ed. Washington, D.C.: American Psychi- atric Association, 1994.
46. American Psychiatric Association. Diagnostic criteria from DSM-IV-TR.
Washington, D.C.: American Psychiatric Association, 2000.
47. McKhann G, Drachman D, Folstein M, Katzman R, Price D, Stadlan EM.
Clinical diagnosis of Alzheimer’s disease: report of the NINCDS-ADRDA Work Group under the auspices of Department of Health and Human Services Task Force on Alzheimer’s Disease. Neurology 1984; 34: 939-44.
48. Hachinski V, Iadecola C, Petersen RC, Breteler MM, Nyenhuis DL, Black SE, Powers WJ, DeCarli C, Merino JG, Kalaria RN, et al. National Insti- tute of Neurological Disorders and Stroke - Canadian Stroke Network vascular cognitive impairment harmonization standards. Stroke 2006;
37: 2220-41.
49. Copeland JR, Dewey ME, Griffiths-Jones HM. A computerized psychiat- ric diagnostic system and case nomenclature for elderly subjects: GMS and AGECAT. Psychol Med 1986; 16: 89-99.