Diagnosis of the Combustion Characteristics of Spark Ignition Engine with Compressed Natural Gas(CNG) Injection Type
압축천연가스(CNG) 분사식 스파크점화엔진의 연소특성 진단
D. H. Ha, J. M. Jin, S. I. Hwang, J. K. Yeom and S. S. Chung 하동흔․진종무․황성일․염정국․정성식
(received 25 March 2012, revised 02 July 2012, accepted 17 July 2012)
주요용어:CNG 엔진(CNG Engine), 희박혼합기(Lean Mixture), 예혼합기(Pre-Mixture), 급속연소(Rapid Combustion), 부실(Sub-Chamber)
요약:희박예혼합기의 급속연소에 관한 연구를 위하여 2-실린더 가솔린 엔진을 부실 타입의 압축천연가스 (CNG) 분사 엔진으로 개조하였다. 본 연구에서는 부실의 최적설계에 관심을 두고 두 종류의 부실을 적용하 여 실험을 실시하였고, 부실의 체적과 홀 개수는 1.5cc와 6개로 각각 동일하게 하고, 홀 직경을 0.8mm 및 1.1mm로 달리하였다. CNG연료는 포트연료분사(Port fuel injection; PFI)와 부실분사(Sub-chamber injection;
SCI)에 의해 엔진에 독립적으로 공급되고, 그 실험결과로 구한 연소압력, 평균유효압력(IMEP), 질량연소분율 과 사이클변동계수(COV) 등을 서로 비교하였다. 본 연구의 대표적 실험연구결과로서 PFI 타입의 엔진연소 특성은 희박예혼합기의 경우를 제외하고 모든 조건에 있어서 기존의 가솔린 엔진과 비슷하였고, SCI 타입의 엔진연소특성으로 평균유효압력은 부실 내에 불완전 예혼합기형성으로 PFI 타입보다 낮았으며, COV는 SCI 타입이 희박가연한계가 확대됨으로 인하여, 특히 높은 공기과잉률 범위에서 PFI 타입과 비교해 보다 좋은 결과를 나타내었다.
*****†정성식(교신저자) : 동아대학교 기계공학과 E-mail : [email protected], Tel : 051-200-7654
*하동흔 : (주)서한워너 터보시스템즈
**진종무 : 노드슨코리아(주)
***황성일 : 동아대학교 대학원
****염종국 : 동아대학교 기계공학과
*****†S. S. Chung(corresponding author) : Department of Mechanical Engineering, DongA University.
E-mail : [email protected], Tel : 051-200-7654
*D. H. Ha : Seohan Warner Turbo Systems Co.
**J. M. Jin : Nordson Korea Co. Ltd.
***S. I. Hwang : Graduate School, DongA University
****J. K. Yeom : Department of Mechanical Engineering, DongA University
1. Introduction
Compressed natural gas (CNG) is a very useful fuel in spark ignition engines. Because the boiling point of CNG is very low, a high quality homogeneous pre-mixture can be obtained compared to gasoline, and this could possibly lower engine emissions. Due to the high octane number of CNG, engines could be operated with a higher compression ratio for better thermal efficiency. Also, the amount of CO
2after combustion of the CNG is lower than gasoline engines due to low-carbon number of CH
4. When
considering the use of CNG in engines, some
problems still exist. The most critical problem is
that the combustion velocity of the pre-mixture in
the cylinder is slower than that of gasoline. The
combustion velocity affects the engine speed and
thus engine power. To solve this problem, a higher
combustion velocity of CNG pre-mixture in
engines is needed. To address these problems, a
number of studies on CNG engines have been
conducted
1,5,6,7). For example, Kang performed
experimental study on a CNG engines operating
with direct and indirect injection of CNG and
found that the torque is increased by 10% and the
emission is decreased by a small amount for direct injection CNG engine compared to indirect injection
6). Prior to this report, a series of studies were carried out to obtain basic data for the technology development of the CNG engine
8-11). The combustion chamber of the engine was divided into two chambers: sub-chamber and main-chamber, just like the sub-chamber-type diesel engines. The sub-chamber, which was hemispherical in shape, had a volume of about 3 cc and eight holes of 1.5 mm diameter. Those values, however, were not fixed because they were experimental parameters of the studies using a constant volume combustor
8-10)or a test engine
11). A spark plug was equipped in the sub-chamber, and a pre-mixture was formed inside each chamber during a compression stroke. When the pre-mixture in the sub-chamber was ignited by a spark, the burned and unburned gas containing a number of active radicals were spouted from every hole into the main-chamber as a sharp torch.
Then the pre-mixture in the main chamber was ignited and flames propagated. In these reports, the radicals in the spouted gas were measured by an experimental method. This combustion method is called radical ignition
8-11). In contrast, the injection duration of CNG is proportional to the displacement volume of the engines. Because the energy density of the CNG is smaller than the liquid fuel, one of the important problems of CNG engines is the longer injection duration. As the CNG injection duration increases, the time for mixing air and CNG after injection becomes gradually shorter, and overlap in the engine operation
11). From these points of view, CNG is best suited to small high-speed engines. In this report, a small two-cylinder gasoline engine (Vanguard 473147) was selected for the technology development. The cylinder is 376 cc in volume.
This engine displacement is roughly one-half of the size used in our previous report
9). Therefore, the injection duration of the test engine is one-half that of the engine used in the previous report, assuming that both engines are operated at the
same excess air ratio. To evaluate the possibility of rapid combustion of a leaner mixture, two kinds of CNG engine injection were examined separately:
port-fuel injection (PFI), and sub-chamber injection (SCI). The engine was set to operate at 2000 rpm with a throttle valve openratio of 0.3, and the excess air ratio was varied from the lean flammability limit to 1.0. The data obtained from the experiments have been used to compare SCI with PFI.
2. Experimental System
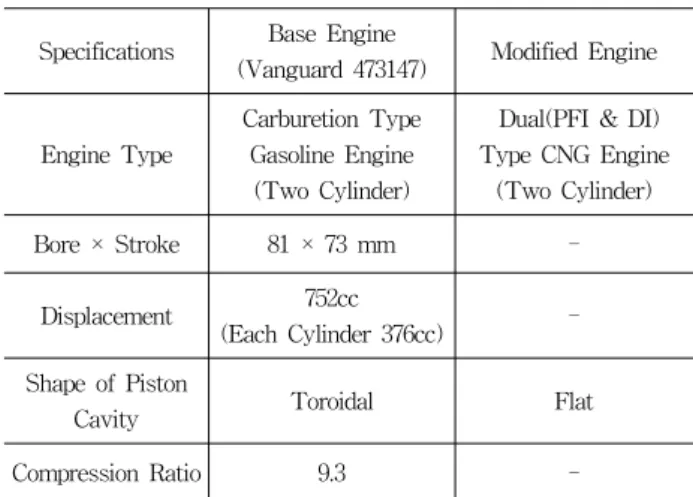
Figure 1 shows the experimental system used in this study. This system consisted of the test engine, CNG supply lines with safety apparatus, an engine dynamometer, and combustion and emission analysis apparatus. Table 1 shows the experimental conditions.
Fig. 1 Schematic diagram of experimental system Table 1 Experimental conditions
Specifications Base Engine
(Vanguard 473147) Modified Engine
Engine Type
Carburetion Type Gasoline Engine
(Two Cylinder)
Dual(PFI & DI) Type CNG Engine
(Two Cylinder)
Bore × Stroke 81 × 73 mm -
Displacement 752cc
(Each Cylinder 376cc) - Shape of Piston
Cavity Toroidal Flat
Compression Ratio 9.3 -
2.1 Test engine
A modified two-cylinder spark ignition engine for small-scaled generation in the construction field was used as the test engine. In this V-type two-cylinder engine, only the end part of the injector was modified into a combustion chamber with a sub-chamber, similar to the sub- chamber-type diesel engine. The original engine had a carburetor, which is changed to CNG injection system. The two CNG injectors were set in the sub-chamber and intake port. The second cylinder of the two-cylinder engine has no valves and is operated passively without any fuel supply.
The engine was tested with the two types of injection separately, first with the PFI and then with the SCI. An eddy current-type dynamometer was used to control the engine torque and the revolution speed is controlled with a hand-operated accelerator linked to the throttle valve opening.
Combustion pressure in the cylinder was measured using a piezoelectric pressure transducer (6055Bsp, Kistler Corp.). The results were passed through an amplifier (5015A, Kistler Corp.) and an A/D converter, before storing in the computer. A wide-band lambda sensor (LSU-4, Bosch Corp.) with an oxygen sensor was mounted on the exhaust port. The technology of the lambda sensor allows for the accurate lambda ratio readings from 0.7 to 1.4 and beyond. The measured values were then fed back into the electronic control unit (ECU) to control the excess air ratio more precisely. To set the exact excess air ratio to the engine, an air flow meter (Series 8000 MP/NH, Eldridge Products Inc.) was installed to measure the intake air mass. The necessary data on CNG mass were taken from our previous report
4). Both the injection and spark timing were controlled by the ECU (The System Corp.). The CNG injector was controlled using the current control method, which uses a high-pressure solenoid injector. The cooling water temperature was maintained at 75℃, and the spark timing was adjusted to the maximum brake torque (MBT). A LabVIEW data acquisition system was used for signal detection
and analysis of the combustion characteristics of the test engine.
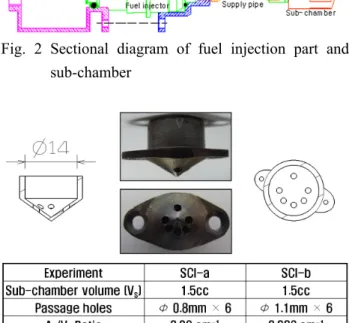
2.2 CNG injection parts and sub-chamber
Figure 2 shows a CNG supply system, with a surge tank and a CNG injector connected by apipe.
The volume of the surge tank is 81cc, the length of the pipe is 62 mm, and the inner diameter is 1 mm. The spark plug (Kistler Co.) has a small hole to set the pressure sensor from the outside. But in this experiment, the hole was used for connecting the injector and the sub-chamber as shown in Fig.
2. The sub-chamber with CNG injector is attached to the cylinder head. Two kinds of sub-chambers were tested individually to obtain the optimum design for the sub-chamber. Both the sub- chambers have the same volume (1.5 cc) and number of holes (6). However, the diameters of the holes in the two sub-chambers are different (0.8 mm and 1.1 mm). The sub-chambers are named as SCI-a (0.8 mm) and SCI-b (1.1 mm). The A
h/V
sratios of the sub-chambers are 0.02 cm
-1Fig. 2 Sectional diagram of fuel injection part and sub-chamber
Fig. 3 Photo of sub-chamber with 6 holes
and 0.038 cm
-1, respectively, where A
his the total area of the holes and V
sis the sub-chamber volume.
Figure 3 shows the arrangement of holes in the sub-chamber. The injection pressure of the CNG was set at 6 MPa. The pressure was reduced from bomb pressure (20 MPa) as it passes through two decompression regulators. Since CNG is a high-pressure gas, some safety valves were needed in the CNG supply line. We installed three safety valves: a manual cutoff valve, a high-pressure solenoid valve, and an overflow cutoff valve.
2.3 Control signals
Figure 4 shows the crank angle, top-dead-center (TDC), injection, and spark signals on an oscilloscope monitor. The crank angle and TDC signals are from an encoder, and the injection and the spark signals are from the ECU. The figure indicates that all the signals are independently controlled with x-axis as a time axis. In Fig. 4, the injector signal shows that the pulling voltage is maintained for 2.5 ms at stage one, and the holding duration of the on-off signals is repeated continuously. This control method for the injector signal was chosen because it reduced electric power consumption and prevented the injector from generating heat.
Fig. 4 Signals from encoder and ECU
3. Experimental results
3.1 Pressure profiles
P-q profiles of the PFI, SCI-a, and SCI-b are shown in Figure 5. In the Fig. 5, the ST is spark timing with unit °(deg.). The experimental conditions were set as follows; 30% for the throttle valve open ratio, 2000 rpm for the rotational speed of the engine, and 44° after top-dead-center (ATDC) for the injection timing as point of injection start. The injection timing is an important parameter of the gas direct injection engine because, the different injection timing at a decided rpm or rpm change at a decided injection timing leads to different combustion characteristics.
The gas fuel needs longer injection duration than the liquid fuel. In our previous report
4), the injection timing was limited to the angle ranging from the end of valve overlap as exhaust valve close to ATDC 50°, because the COV of P
maxreaches 12% faster as the crank angle goes beyond ATDC 50°. But, the injection duration was set at 15ms (9ms, in this study) for 2000rpm. To decide on the injection timing in this study, three different injection timings, 44°, 47° and 50° ATDC, were examined, and 44° was decided as the best injection timing in view of MBT. Based on the above reasoning, the most suitable injection timing should be set near the end of valve overlap to get longer duration for mixing of air and fuel after
-150 -100 -50 0 50 100 150
0 1 2 3
4 0
1 2 3 0 4
1 2 3 4
λ=1.0, ST=BTDC 29 λ=1.2, ST=BTDC 45 λ=1.4, ST=BTDC 49
λ=1.0, ST=BTDC 40 λ=1.2, ST=BTDC 46 λ=1.4, ST=BTDC 77
Crank Angle, deg
.Pre ssure , MPa
SCI-b
SCI-a
PFI λ=1.4, ST=BTDC 37
λ=1.2, ST=BTDC 36 λ=1.7, ST=BTDC 51 λ=1.0, ST=BTDC 25
30% Throttle Open, 2000rpm, I.T=ATDC 44
Fig. 5 Pressure profiles versus crank angle by PFI
and SCI
injection. In the case of PFI, the injection timing was set at 44° to compare with SCI. As shown in Fig. 5, the excess air ratio l was varied from 1.0 to the lean flammability limit. In general, the value of P
max, which is the maximum cylinder pressure in the moving engines, is inversely proportional to the excess air ratio l. Therefore, PFI in Fig. 5 changed systematically with the excess air ratio l.
This means that the engine was successfully modified. However, P
maxof both SCI-a and SCI-b did not change systematically, especially in the case of SCI-a. The test engine, especially the sub-chamber, was tested for the rapid combustion of the leaner pre-mixture. Hence, the sub-chamber must have an optimized geometry for the gas flowing through the holes. Also, the pre-mixture in the sub-chamber must be in the best state for ignition, mobility for combustion, and spouting into the main-chamber for rapid combustion. This is difficult because the sub-chamber is a small and complicated region where physical, chemical, and thermal phenomena occur in an instant. Several studies to obtain the optimum sub-chamber design were carried out using CVC engines
2~3). From the results, both the SCI-a and SCI-b were decided as experimental parameters in this study. However, the SCI-a sub-chamber produces lower engine power. For SCI-a, when l=1 P
maxshows the lowest value for all conditions. This may be caused by the small diameter of the sub-chamber hole or the faulty pre-mixture state, or both. However, the
-10 0 10 20 30 40 50
-10 0 10 20 30 40 50
-100 -50 0 50 100
-10 0 10 20 30 40 50
SCI-b
SCI-a
λ=1.0, ST=BTDC 40ٛ
λ=1.2, ST=BTDC 46ٛ
λ=1.4, ST=BTDC 77ٛ
λ=1.2, ST=BTDC 36ٛ
λ=1.4, ST=BTDC 37ٛ
λ=1.7, ST=BTDC 51ٛ
λ=1.0, ST=BTDC 25ٛ
λ=1.0, ST=BTDC 29ٛ
λ=1.2, ST=BTDC 45ٛ
λ=1.4, ST=BTDC 49ٛ
Ra te of He at Relea se, J/ de g.
PFI
Crank Angle, deg.
Fig. 6 Rate of heat release as a function of crank angle
P
maxin the case of SCI-b shows systematic variation with the excess air ratio and the combustion pressure in overall is higher than that of SCI-a. The results indicate that the ratio A
h/V
smust be greater than 0.02 cm
-1from the viewpoint of power. On the other hand, to investigate the P-q profiles shown in Fig. 5, we deduce that the P-q profiles change into the rate of heat release and cumulated heat release. This will be discussed in more detail in the next section.
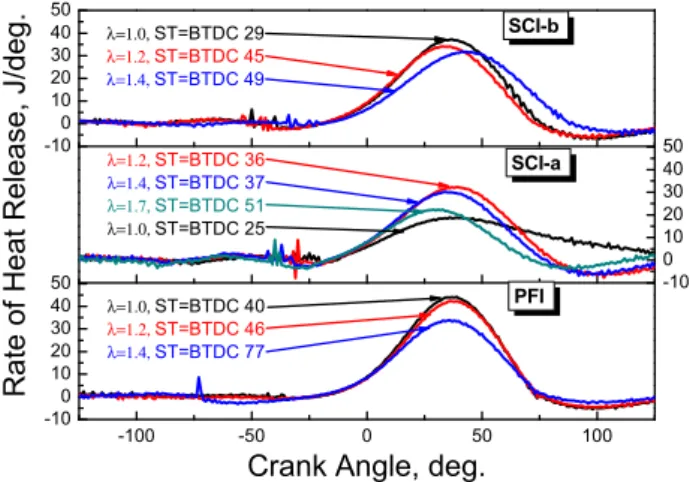
3.2 Rate of heat release
The purpose of this experimental study is to develop an injection technology for the CNG engine. SCI-a and SCI-b were designed and built based on previous reports
5~11). But, the design of SCI-a did not work to our expectation. However, the results are of course important because this experiment also needs to be understood as a part of the entire process.
Figure 6 shows the results of the rate of heat release obtained from the data shown in Fig. 5.
The SCI-a in Fig. 5, shows an excessively slow grade, when the excess air ratio l is set to 1.0, and the injection duration is 9 ms. This is the longest injection compared to the other conditions of l for which the mixing time of the air and CNG after injection is shorter. The hole diameter of SCI-a is smaller than the hole diameter of SCI-b.
Both of them, with the long injection time and small holes, would produce a good pre-mixture for the ignition in the sub-chamber and for the gas spouting after ignition from the sub-chamber.
Therefore, the flame propagation in the main- chamber is not smooth.
3.3 Mass fraction burned
The mass fraction burned versus crank angle for the CNG engine is shown in Figs. 7(a)-(c).
The curves of mass-fraction-burned are taken
from the integral of the instantaneous heat release
shown in Fig. 6. In Fig. 7, all curves for all
conditions have very similar tendencies, except
when l=1 in 7(b). Figure 7 gives important
information on the flame propagation speed and
combustion characteristics such as the rapid combustion starting point, which is the same as the ignition delay.
0 20 40 60 80 100 120
0 20 40 60 80 100
Ma ss Fraction Burned, %
Combution duration, deg.
PFI
30% Throttle Open 2000 rpm
λ
=0.8
λ=1.0
λ=1.2
λ=1.4
0 20 40 60 80 100 120
0 20 40 60 80 100
Mass F ract ion Burned, %
Combution duration, deg.
SCI-a
30% Throttle Open 2000 rpm
λ
=1.0
λ=1.2
λ=1.4
λ=1.7
Combustion Duration, deg.
0 20 40 60 80 100 120
0 20 40 60 80 100
SCI-b
30% Throttle Open 2000 rpm
λ
=1.0
λ=1.2
λ=1.4
Ma ss F rac tion Bu rn ed , %
Combution duration, deg.
Combustion Duration, deg.
Fig. 7 Mass fraction burned with excess air ratio
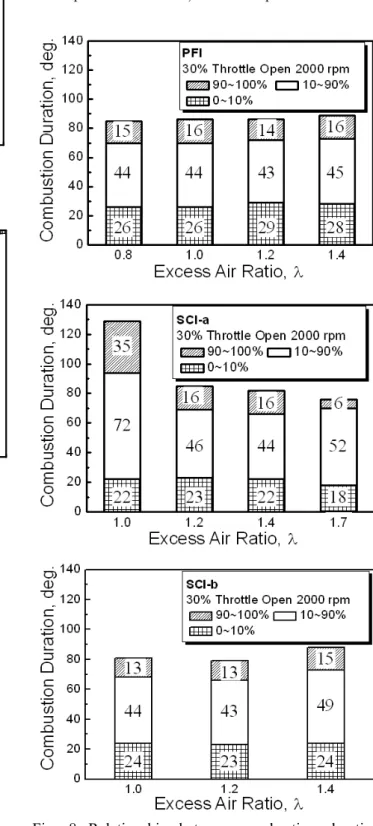
3.4 Combustion durations
Figures 8(a)-(c) show bar charts with itemized combustion characteristics for PFI and SCI. This figure shows a plot of the mass fraction burned versus the excess air ratio. In the legend of Fig. 8, 0~10%, 10~90%, and 90~100% indicate the burned combustion ratio; these are called the flame development duration, the rapid combustion
Fig. 8 Relationship between combustion duration
and excess air ratio
duration, and the after combustion duration, respectively. In Fig. 8(a), because the arithmetic average of the total combustion duration is about 86° and the standard deviation is small, the PFI shows quite smooth operation conditions. The range of 0~10% (called the flame development duration) is equivalent to the ignition delay. When comparing the 0~10% of PFI and SCI in Figs.
8(a)-(c), SCI is shorter by 3°, 6°, and 5° than PFI at l=1.0, 1.2, 1.4, respectively. When calculating these values, the arithmetic average values of SCI-a and SCI-b were used. Furthermore, the condition l=1.7 for SCI-a shows the shortest flame development duration. This shorter duration means the start of faster combustion, and the rapid combustion of a leaner pre-mixture is the purpose of this experimental study.
3.5 Indicated mean effective pressure
Figure 9 shows indicated mean effective pressure (IMEP) variations of both PFI and SCI according to the excess-air ratio. The IMEP variation with the excess-air ratio is systematical for both PFI and SCI. The magnitude of the SCI-IMEP is lower than that of the PFI-IMEP.
However, the IMEP gap between the PFI and SCI gradually decreases with the excess air ratio. At l
= 1.0, the values of IMEP of SCI-a and SCI-b are approximately 66% and 76%, respectively, that of the PFI. Both values are smaller than the corresponding ones at l = 1.4, i.e., 80% and 93%.
Therefore, the IMEP reduction for the SCI is less significant at leaner air-fuel ratios.
0.8 1.0 1.2 1.4 1.6 1.8
0.0 0.4 0.8 1.2
1.6 30% Throttle Open
2000 rpm PFI SCI-a SCI-b
Excesss Air Ratio, λ
imep, MPa
Fig. 9 Comparison of IMEP with excess-air ratio
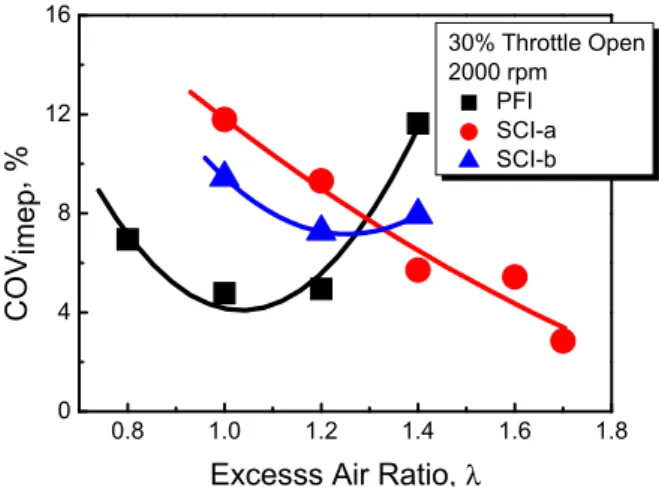
3.6 Cycle variations
One of the best characteristic feature of this experimental study is illustrated in Fig. 10, which shows the relationship between the coefficient of cycle variation of IMEP (COV
imep) and excess air ratio. The COV
imepis the ensemble average value of 100 cycles. It is known that internal combustion engines are operated under 10% of the COV
imep. From this point of view, the PFI-CNG engine shows stable operation except for l=1.4; i.e., the flammability limits of typical spark-ignition engines by standard combustion methods are not wide. Based on this fact, SCI showed a critically stable operation until l=1.7 with respect to the excess air ratio. The SCI showed a greater success in comparison to the PFI. Because IMEP obtained from PFI is good, especially at l=1.0 and SCI has stability in the lean pre-mixture. From the analysis of our experimental results, we propose to employ a dual injection into the port and sub-chamber with both SCI and PFI installed.
0.8 1.0 1.2 1.4 1.6 1.8
0 4 8 12 16
30% Throttle Open 2000 rpm
PFI SCI-a SCI-b