Housing Characteristics and Determinants of Housing Cost Burden of Young Single- or Two-person Households in the U.S. Metropolitan Areas
미국 대도시 지역 청년 1-2인가구의 주거 특성 및 주거비 부담 영향 요인
최병숙* 이현정**
Choi, Byungsook Lee, Hyun-Jeong
Abstract
The purpose of this study was to explore housing characteristics of young single- or two-person households in the U.S. metropolitan urban areas and determinants of their housing cost burden. Total 764 single-person households, 744 two-person households and 424 households with three or more persons were selected from the 2011 American Housing Survey public-use microdata for the study based on specific sampling criteria. The major findings are as follows: (1) In comparisons with larger households, single- or two-person households were characterized to be headed by younger householders, to have less income, and to have a greater proportion of households living in central cities of metropolitan areas, renting housing units, living in smaller size units or multifamily structures; (3) housing cost of single- or two- person households were significantly less than a larger households while housing costs per unit square footage (SQFT) of single- or two-person households was significantly greater; (4) regardless of the household size, there are many household headed by young college graduates paying too much of their income for housing, and single-person households were found to have the greatest housing cost burden; and (5) a linear combination of low-income status, monthly housing costs per unit SQFT, annual household income, and unit SQFT per person was found to be most efficient to predict single- or two-person households with housing cost burden.
Keywords : Young Households, Single- or Two-person Households, Housing Cost Burden, 2011 American Housing Survey,
Keywords : Discriminant Analysis주 요 어 : 청년가구, 1-2인가구, 주거비 부담, 2011년 미국주거조사, 판별분석
I. Introduction
1. Background
The transition from living in parents’ home to the first independent housing is considered one of the most significant events for a young person in his/her progression to adulthood (Beer, Faulner, Paris & Clower, 2011;
Billari, Philipov & Baizán, 2001). Billari et al. (2001) state that leaving parents’ home indicates the person’s
‘greater social autonomy (p. 340)’ as well as independence as a household.
The economic recession over the past couple of years in the United States has affected many individuals’ and households’ finance. Especially, many young people are experiencing a more difficult time to find a stable job with satisfactory salary to achieve financial independence.
For the reasons, transition to independent living is delayed for many young people (Joint Center for Housing Studies of Harvard University (JCHS), 2013). Even a young person succeeds in formation of an autonomous household, the person may experience difficulty to afford his/her own housing costs when his/her income is not stable or enough for the independent living.
Young households’ housing cost burdens could be related to many other social issues. When a young household faces a problem managing housing costs, the financial burden may be shifted to family, especially to parents leaving less resources for the parents to prepare for later life. Or, the burdened young household may choose to move to more affordable lower-quality housing in a less
**정회원(주저자), 전북대학교 주거환경학과 부교수, 이학박사
**정회원(교신저자), 충북대학교 주거환경학과 부교수, Ph.D.
Corresponding Author: Hyun-Jeong Lee, Dept. of Housing &
Interior Design, Chungbuk Natl. Univ., 52 Naesudong-ro, Heungdeok- gu, Cheongju, Chungbuk, 361-763, Korea
E-mail: [email protected]
본 연구는 2011년도 정부(미래창조과학부)의 재원으로 한국연구재 단의 지원을 받아 연구되었음(NRF-2011-0014238).
preferable neighborhood or location (JCHS, 2011). Home foreclosure or eviction from a rental housing unit due to mortgage or rent delinquency would be the worst ending.
2. Research Purpose
This was a part of study series to explore housing and housing cost burden situation of young professionals in Korea and the United States. The purpose of this study was to explore housing characteristics of young single- or two-person households in the U.S. metropolitan urban areas and determinants of their housing cost burden using the 2011 American Housing Survey (AHS) public-use microdata. Especially, this study focused on single- or two-person households headed by college graduates and who have recently moved for job-related reasons.
II. Literature Review
1. American Housing Survey (AHS)
AHS is a longitudinal national housing survey of the United States conducted in every odd-numbered years.
Currently, the U.S. Department of Housing and Urban Development (HUD) sponsors the AHS and the U.S.
Census Bureau administers it (U.S. Census Bureau, n.d.a, n.d.b). The beginning of the AHS was the Annual Housing Survey conducted to 60,000 housing units in 1973. The Annual Housing Survey was administered every year until it was modified to biennial survey and renamed American Housing Survey in 1981 because of budget constraints (U.S. Census Bureau, n.d.b).
The AHS utilizes on-site or telephone interviews to the occupants in each of the sample units (U.S. Census Bureau, n.d.c). Sample size of the 2009 AHS was approximately 55,000 housing units. In 2011, the size was increased to 186,400 housing units. Among them, approximately 8,900 units were found ineligible for the survey and 177,500 eligible sample units were interviewed (U.S. Census Bureau, n.d.d).
According to the 2011 American Community Survey, it was estimated that there were 132,316,248 housing units in the United States in 2011.
1)Considering the number of housing units, 177,500 sample units of the 2011 AHS represent approximately 0.13% of total housing units in 2011.
2)Each sample unit was selected to represent about 2,000 other units, which is called
‘weight’ in the survey (U.S. Census Bureau, n.d.d).
Overall response rate of 2011 AHS was about 87 percent (U.S. Census Bureau, n.d.d).
Microdata of the AHS is usually released to public about a year from the survey. The AHS microdata has been used by many researchers in- and outside the United States. Using the 2009 AHS microdata, Ahn (2012) investigated governmental assistance for rural elderly housing; Lee (2012a) examined housing cost burden of the U.S. households by current and previous tenure types; and Deal (2011) determined relationship between perceived neighborhood safety and residential satisfaction of elderly population. Recently, Ahn, Lee and Parrott (2013) explored demographic and housing characteristics of Hispanic households and Kwon, Hwang and Beamish (2013) investigated disabilities and housing accessibilities of elderly using the 2011 AHS microdata.
Some researchers have utilized AHS microdata in cross- cultural studies. Lee (2012b) compared post-college housing choices of college graduates in the United States and Korea by utilizing microdata of the 2009 AHS and the 2011 Household Income and Expenditure Survey of Korea.
2. Housing Cost Burden and Housing Affordability
Housing cost burden is one of the most frequently used indices of housing affordability. Housing cost burden is calculated as percent of housing cost out of household income. Usually, a household that pays 30 percent or more of the household income for housing cost is considered to have housing cost burden. If a household pays 50 percent or more of its income for housing cost, the household is considered to have ‘severe’ housing cost burden. JCHS (2013) indicates that 42.3 million U.S. households had housing cost burden in 2011 and the number represents 37 percent of the U.S. households in the year. Furthermore, 17.9 percent of the U.S.
households had severe housing cost burden to pay half or more of the household income toward housing costs.
For some households, housing affordability could play a critical role in achieving quality of life. If a household pays too much of its income for housing costs, the household has too little resource to spend for other needs including foods, clothes, and medicine which are critical for basic living (JCHS, 2011). Many researchers found that the housing affordability actually influences quality of life in many ways. It could influence physical
2) According to the statistics from the 2009 American Community Survey, the 55,000 housing units sampled for the 2009 AHS represented approximately 0.04% of total housing units in the year.
1) Statistics were obtained from the American FactFinder by the U.S. Census Bureau (http://factfinder2.census.gov).
and mental health of occupants (Newman, 2008; Schwartz, 2010), education and employment (Schwartz, 2010) as well as well-being of young children (Harkness &
Newman, 2005).
There were several research studies that examined housing cost burden or affordability of diverse population groups in the United States. Using the 2001 Survey of Consumer Finances data, DeVaney, Chiremba and Vincent (2004) compared housing cost burden by the respondents’
stages in lifecycle and tenure types. McConnell and Akresh (2010) analyzed housing cost burden of new legal immigrants utilizing the 2003 New Immigrant Survey data. Mimura (2008) used the 1999 National Survey of America’s Families and compared effects of housing cost burden among low-income households with children by the householders’ race. As mentioned previously, Lee (2012a) examined housing cost burden of the U.S.
households by current and previous tenure types, and Lee (2012b) compared housing cost burden of households living with college graduates in Korea and the United States.
Previous research study most closely related to this study is the one that analyzed housing cost burden of young 1- to 2-person households utilizing the 2009 AHS microdata (Lee, 2012c). This study follows major sampling criteria and data analysis procedure of the previous study by Lee (2012c) and sampling criteria and variables were modified to for a better diagnose of young households’ housing cost burdens. The changes in sampling criteria and variables are explained in Methodology and Findings parts of this manuscript.
III. Methodology
1. Data and Target Selection
This study utilized a public-use microdata set of the 2011 AHS as a secondary data. As stated earlier in this manuscript, this study follows methodology of a previous study by Lee (2012c) which was a similar study utilizing a public-use microdata of the 2009 AHS. After review of other studies on housing issues of young households and housing cost burdens, however, sampling criteria and variables were modified in this study.
There were specific criteria used in this study to select target households that are considered to have similar characteristics to young professionals. First, in this study, a ‘young household’ was defined as a household headed by a person whose age was between 20 to 34 years. In the previous study (Lee, 2012c), households headed by
person between 20 to 39 years of age were selected as representatives of young households. As this study was a part of study series comparing housing situations of young professionals in Korea and the United States, however, the upper limit of the age range was lowered to 34 years after review of other related studies in Korea (Bae, 2013; Baek, 2008; Kwon & Lee, 2013).
Second, targeted sampling of this study was young single- or two-person households living in urban areas of Metropolitan Statistical Areas (MSA)
3). In previous study (Lee, 2012c), it was found that majority of the young single- or two-person households were living inside MSA. Thus, it was decided to focus on young households living in urban areas of MSA in this study rather than including households in rural areas or non- MSA areas.
Other than those two changes, the rest of sampling criteria followed those of the previous study by Lee (2012c): households headed by college graduates (house- holder with Bachelor’s degree or higher educational attainment), and have moved within the last three years (in or after 2008) for job-related reasons
4). In addition, households who had zero or negative incomes were excluded from the data analyses because it was very complicated to interpret their housing cost burden which was one of the major components of this study.
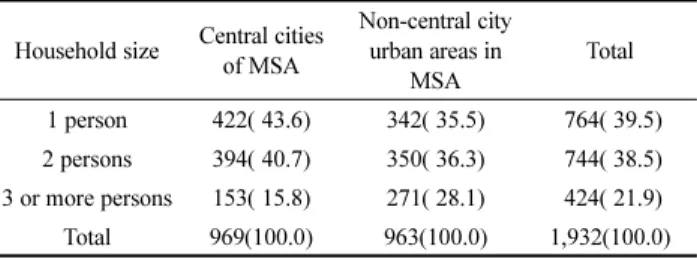
As results, 764 single-person households and 744 two- person households meeting the target selection criteria were selected for the further data analyses. In addition, 424 households with three or more household members meeting the criteria of age and educational attainment of householders, household income, location, and recent move year and reasons were also included in the data analyses as a comparative group to the single- or two- person households <Table 1>.
3) Central cities and non-central city urban areas of Metropolitan Statistical Area (MSA) defined in the 2011 AHS
4) Reasons of recent move was a new job or job transfer; to be closer to work/school/other; or other financial/employment related reasons
Table 1. Households Selected for the Study Household size Central cities
of MSA
Non-central city urban areas in
MSA
Total
1 person 422( 43.6) 342( 35.5) 764( 39.5) 2 persons 394( 40.7) 350( 36.3) 744( 38.5) 3 or more persons 153( 15.8) 271( 28.1) 424( 21.9) Total 969(100.0) 963(100.0) 1,932(100.0) Note. Numbers in parentheses are valid percents within each location.
2. Data Analysis
Data analysis of this study consists of two major stages. In the first stage, household and housing characteristics of single- or two-person households were compared with households with three or more household members using a series of chi-square tests of independence and one-way analyses of variance (ANOVA). In the second stage of the data analysis, determinants of housing cost burden of single- or two-person households were explored utilizing a series of discriminant analyses.
For the entire data analyses, IBM SPSS Statistics 21.0 were used.
IV. Findings
1. Household Composition of Targeted Households Marital status and relationships of the other household members to the householders of selected single- or two- person households are shown in <Table 2>. Over 92 percent of persons living alone were never married.
Among two-person households, approximately 42 percent were married couples, 31 percent lived with non- relatives, and 21 percent were with significant others.
There were only few households living with their own child (1.8%).
2. Household Characteristics
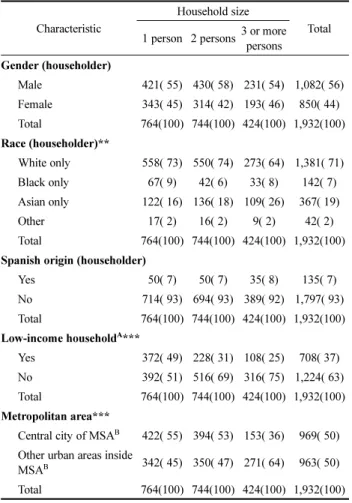
Household characteristics of single- or two-person households were compared with those of households with three or more persons. Households characteristics compared in the study was demographic characteristics of householders including age, gender, race, and whether or not from Spanish origin; and household characteristics including annual household income, low-income household status and location in MSA. A low-income household in this study refers to a household whose annual income was below 80 percent of the area median income (AMI).
As results, there were significant differences found in age and race of householder, annual household income, low-income status, and location (
p< .05). Compared withhouseholds with three or more persons, single- or two- person households tended to be headed by younger householders; have a greater proportion of householders headed by White; to have less income; have a greater proportion of low-income households; and have a greater proportion of households living in central cities of MSAs <Table 3, 4 & 5>.
Single-person households showed the lowest average annual household income less than $50,000, which was assumed to be resulted from the number of households who had incomes. So analysis of covariance (ANCOVA) was run to see if household income was different even after eliminating the effect of the number of earners.
For the ANCOVA, household annual income was a dependent variable, household size (1 person, 2 persons, 3 or more persons) was an independent variable, and the number of household members who had wage and
Table 2. Household Composition of Targeted HouseholdsMarital status & household composition n (%) Single-person household
Never married 705 ( 92.3)
Married, spouse absent 31 ( 4.1)
Divorced 23 ( 3.0)
Separated 5 ( .7)
Total 764 (100.0)
Two-person household
Householder+spouse (married couple) 310 ( 41.7) Householder never married
with non-relative (house/roommate, border, etc.) 219 ( 29.4)
with unmarried partner 153 ( 20.6)
with parent or sibling (brother or sister) 28 ( 3.8)
with own child 10 ( 1.3)
with other relative 1 ( .1)
Householder divorced, separated, or spouse absent
with non-relative (house/roommate, boarder, etc.) 11 ( 1.5)
with own child 8 ( 1.1)
with unmarried partner 4 ( .5)
Total 744 (100.0)
Note. Percents are valid percents within each household size. Total of percents may not be 100 due to rounding.
Table 3. Householder's Age and Household Income by Household Size
Characteristic n Mean ANOVA
F p
Age of householder (years)
1-person household 764 27.3a
67.532 .000
2-person household 744 27.3a
Household with 3 or more persons 424 29.4b Household annual income (USD)
1-person household 764 49,695a
137.819 .000
2-person household 744 78,392b
Household with 3 or more persons 424 107,560c
Note. Alphabets next to means refer to homogeneous subsets with Duncan’s PostHoc tests at p< .05 level.
salary income was a covariate. As results, significant income differences were found by household size even after controlling the effect of the number of household members with wage and salary income (F=38.883, p=.000).
3. Housing Characteristics
Housing characteristics of single- or two-person households were compared with those of households with three or
more persons. Housing characteristics compared were tenure type, home structure type, unit size (number of bedrooms
5), unit square footage (SQFT)), unit density (unit SQFT/person, persons/bedroom), housing adequacy, self-rating of the unit or neighborhood as a place to live (1 being worst, to 10 being best), housing costs (monthly housing costs, monthly housing costs/unit SQFT), housing cost burden (annual housing costs/
annual household income, whether or not the household had housing cost burden). In addition to the housing variables used in the previous study by Lee (2012c), more diverse variables including unit size, unit density, and housing costs per unit SQFT were added for a better examination of housing situation and housing cost burden of the young households.
In 2011 AHS, “housing adequacy” was a recoded variable generated by combining several other variables measuring whether or not the unit was equipped with facilities and features that made the unit suitable for living and whether or not the unit showed any sign of structural defects or facilities malfunctioning, and so on.
Some examples of the facilities and features are kitchen and plumbing facilities, hot and cold running water, a bathtub of shower, a flush toilet and electricity. Some of the structural defects or facilities malfunctioning are breakdowns of heating equipment, inside and outside water leaks, holes and open cracks on structures, etc.
(HUD, 2011).
According to the AHS codebook (HUD, 2011), housing costs of the AHS includes mortgage and rent costs, other mortgage charges and required fees, land/site rent, real estate taxes, homeowner’s insurance costs, condominium/
homeowner’s association fee, utility costs, and costs for routine maintenance. To compare housing costs and housing cost burdens, households with no or negative housing costs were excluded for the analysis. To classify households with housing cost burden, a housing cost burden threshold of 30 percent was used. Households who paid 30 percent or more of the household income for housing costs were considered to have housing cost burden.
As results, significant differences were found in tenure type, home structure types, housing unit size (number of bedrooms, unit SQFT), unit density (unit SQFT per person, persons per bedroom), housing adequacy, housing cost (monthly housing costs, monthly housing costs per
Table 4. Household Characteristics by Household SizeCharacteristic
Household size
Total 1 person 2 persons3 or more
persons Gender (householder)
Male 421( 55) 430( 58) 231( 54) 1,082( 56) Female 343( 45) 314( 42) 193( 46) 850( 44) Total 764(100) 744(100) 424(100) 1,932(100) Race (householder)**
White only 558( 73) 550( 74) 273( 64) 1,381( 71)
Black only 67( 9) 42( 6) 33( 8) 142( 7)
Asian only 122( 16) 136( 18) 109( 26) 367( 19)
Other 17( 2) 16( 2) 9( 2) 42( 2)
Total 764(100) 744(100) 424(100) 1,932(100) Spanish origin (householder)
Yes 50( 7) 50( 7) 35( 8) 135( 7)
No 714( 93) 694( 93) 389( 92) 1,797( 93)
Total 764(100) 744(100) 424(100) 1,932(100) Low-income householdA***
Yes 372( 49) 228( 31) 108( 25) 708( 37)
No 392( 51) 516( 69) 316( 75) 1,224( 63)
Total 764(100) 744(100) 424(100) 1,932(100) Metropolitan area***
Central city of MSAB 422( 55) 394( 53) 153( 36) 969( 50) Other urban areas inside
MSAB 342( 45) 350( 47) 271( 64) 963( 50) Total 764(100) 744(100) 424(100) 1,932(100) Note. Numbers in parentheses are valid percents within each household size. Total of percents may not be 100 due to rounding.
**Chi-square is significant at p< .01 level. ***Chi-square is significant at p< .001 level. Refer to <Table 5> for the Chi-square statistics.
AHousehold with income below 80% of AMI
BMetropolitan Statistical Area of 2011 American Housing Survey
Table 5. Pearson Chi-square: Household Characteristics by Household size
Characteristic χ2 df p
Gender (householder) 1.619 2 .445
Race (householder) 22.968 6 .001
Spanish origin (householder) 1.360 2 .507
Low-income household 82.087 2 .000
Metropolitan area 43.801 2 .000
Note. Each variable was compared with household size. Categories of household size and each characteristic followed those in <Table 4>.
5) For the housing units with no bedroom, such as efficiency or stu- dio units, the number of bedrooms were recoded to 1.
unit SQFT) and whether or not the household had housing cost burden <Table 6, 7 & 8>.
Single- or two-person households showed a significantly greater proportion of renter households and households living in multifamily structures than a larger households.
In terms of unit size, single-person households tended to live in a smaller size units with smaller square footage and/or smaller number of rooms. As for unit density, however, single- or two-person households showed a larger unit SQFT per person and a smaller persons-per- bedroom ratio.
Monthly housing cost of single- or two-person households were significantly less than a larger households
while monthly housing costs per unit SQFT of single- or two-person households was significantly greater.
Single-person household were found to have the greatest housing cost burden. To see the housing cost-to-income ratio and the proportion of households with housing cost
Table 6. Housing Characteristics by Household SizeCharacteristic
Household size
Total 1 person 2 persons 3 or more
persons Tenure type***
Owner 39( 5) 87( 12) 100( 24) 226( 12)
Renter 721( 94) 655( 88) 318( 75) 1,694( 88) Occupied without rent 4( 1) 2( 0) 6( 1) 14( 1) Total 764(100) 744(100) 424(100) 1,932(100) Home structure type***
Single-family structure 107( 14) 203( 27) 225( 53) 535( 28) 2- to 4-unit structure 106( 14) 131( 18) 61( 14) 298( 15) Multifamily structure 551( 72) 410( 55) 138( 33) 1,099( 57) Total 764(100) 744(100) 424(100) 1,932(100) Housing adequacy*
Adequate 735( 90) 757( 93) 434( 95) 1,926( 93) Moderately inadequate 59( 7) 36( 4) 15( 3) 110( 5) Severely inadequate 21( 3) 18( 2) 7( 2) 46( 2) Total 764(100) 744(100) 424(100) 1,932(100) Housing cost burdenA***
Burdened 338( 44) 214( 29) 131( 31) 683( 35) Not burdened 426( 56) 530( 71) 293( 69) 1,249( 65) Total 764(100) 744(100) 424(100) 1,932(100) Note. Numbers in parentheses are valid percents within each household size. Total of percents may not be 100 due to rounding.
AHousehold paid 30% or more of their household income for housing costs were considered to be burdened.
*Chi-square is significant at p< .05 level. ***Chi-square is significant at p< .001 level. Refer to <Table 7> for the Chi-square statistics.
Table 7. Pearson Chi-square: Housing Characteristics by Household Size
Characteristic χ2 df p
Tenure type 97.202 4 .000
Home structure type 229.834 4 .000
Housing adequacy 12.751 4 .013
Housing cost burden 44.228 2 .000
Note. Each variable was compared with household size. Categories of household size and each characteristic followed those in <Table 6>.
Table 8. Housing Size, Density, Rating, Housing Cost by Household Size
Characteristic n Mean ANOVA
F p
Unit square footage (SQFT)
1-person household 702 915.9a
56.020 .000
2-person household 674 1,213.8b
Household with 3 or more persons 388 1,819.1c Unit SQFT/person
1-person household 702 915.9a
34.839 .000
2-person household 674 606.9b
Household with 3 or more persons 388 512.0b Number of bedroomsA
1-person household 764 1.32a
446.759 .000
2-person household 744 1.92b
Household with 3 or more persons 424 2.83b Persons/bedroomA
1-person household 764 .84a
249.231 .000
2-person household 744 1.23b
Household with 3 or more persons 424 1.44b Rating of unit as a place to liveB
1-person household 760 7.77a
1.403 .246
2-person household 736 7.89a
Household with 3 or more persons 416 7.81a Rating of neighborhood as place to liveB
1-person household 760 7.75a
.415 .660
2-person household 734 7.78a
Household with 3 or more persons 416 7.84a Monthly housing cost (USD)
1-person household 763 1,118a
85,672 .000
2-person household 743 1,390a
Household with 3 or more persons 421 1,835b Monthly housing costs/unit SQFTC
1-person household 702 1.56a
5.936 .003
2-person household 674 1.45a
Household with 3 or more persons 389 1.31b Housing cost burden (%)CD
1-person household 763 226.30a
5.20 .006
2-person household 743 32.67b
Household with 3 or more persons 421 31.53b
Note. Alphabets next to means refer to homogeneous subsets with Duncan’s PostHoc tests at p< .05 level.
AFor efficiency and studio, the number of bedroom was recoded to 1.
BRated from 1 being the worst to 10 being the best.
COnly housing costs of households with monthly housing cost $1 or more were analyzed.
DHousing cost burden=(Annual housing costs)/(Annual household income) ×100 (%)
burden, however, many households headed by young college graduates were experiencing housing affordability problems regardless of the household size.
4. Determinants of Housing Cost Burden
The second stage of the data analysis was to explore determinants of housing cost burden of single- or two- person households. A series of discriminant analyses were utilized to examine influences of linear combination of household and housing characteristics on housing cost burden of single- or two-person households.
In addition to the original sampling criteria, there were a couple more criteria added for the second stage of data analyses. First of all, only households that had
$1 or more of household income and monthly housing cost were included. If either household income or monthly housing cost is zero or negative, it is difficult to calculate housing cost burden and interpret it. Thus, it was assumed not suitable for the housing cost burden analysis of this study. Second, households that occupied the units without paying rent were excluded as mortgage payment and rent payment is a very important part of the housing cost burden. Finally, 1,501 households composed of 760 single-person households and 741 two- person households were selected for discriminant analysis.
Dependent variable was housing cost burden which was a dichotomous variable grouped households into two parties depending on whether or not having housing cost burden to pay 30 percent or more of their household income for housing costs: Burdened, or not burdened.
The independent variables used in the discriminant analyses were household and housing characteristics used in the first stage of data analysis excluding housing cost burden: Age, gender, race and Spanish origin of householder, annual household income, low-income status, location in metropolitan area, tenure type, structure type, unit size (unit SQFT, number of bedrooms), unit density (persons/bedroom, unit SQFT/person), housing adequacy, self-ratings of the unit and neighborhood as a place to live, and housing cost (monthly housing cost, monthly housing costs/unit SQFT). In addition, household size (1 person, 2 persons) were added to the independent variables.
Among independent variables, categorical variables were recoded into dummy variables. Descriptions of the dummy variables used in discriminant analyses is shown in <Table 9>.
Considering the dummy variables, the number of independent variables were 22. When running discriminant analysis, sample size is recommended to be at least five times the number of independent variables (Hair, Anderson, Tatham & Black, 1998). As the sample size exceeds 110, the number of independent variables was appropriate for the analysis.
For variable entry in discriminant models, a stepwise method using Wilk’s lambda was adopted. See <Table 10> for the summary of final stepwise discriminant models for each household size.
It was found that a discriminant model with householder’s race (Asian), annual household income, low-income status, number of bedrooms, unit SQFT per person, monthly housing costs per unit SQFT could explain 47.7 percent
6)of the variance in housing cost burden of one- to two-person households. To see that the group centriod of households with housing cost burden was greater than that of households without housing cost burden, households headed by Asian, with less income, being low-income households, living in units with more bedrooms and a smaller SQFT per person, and paying more housing costs per unit SQFT tended to have a greater chance to have housing cost burden. The final discriminant model was found to be able to predict 81.5% of one- to two-person households with housing cost burden correctly. Final stepwise models of discriminant analysis by household size were found to predict 84.l
Table 9. Dummy Variables Used in Discriminant AnalysesVariable Description
Household characteristics
DSINGLE Household size: Single-person household = 1 DFEMALE Householder’s gender: Female = 1
DWHITE Householder’s race: White only = 1 DBLACK Householder’s race: Black only = 1 DASIAN Householder’s race: Asian only = 1
DSPAN Household from Spanish Origin: Spanish origin = 1 DLOW Low-income householdA: Low-income household = 1 DCCMSA Metropolitan Area: Central city of MSAB = 1 Housing characteristics
DRENTER Tenure type: Renter = 1
DSF Home structural type: Single-family housing = 1 DMF Home structural type: Multifamily housing = 1 DADEQ Housing adequacy: Adequate = 1
AHousehold with income below 80% of AMI
BMetropolitan Statistical Area of the 2011 AHS
6) Refer to squared canonical correlation in <Table 10>.
percent of single-person households with housing cost burden and 79.9 percent of two-person households with housing cost burden correctly.
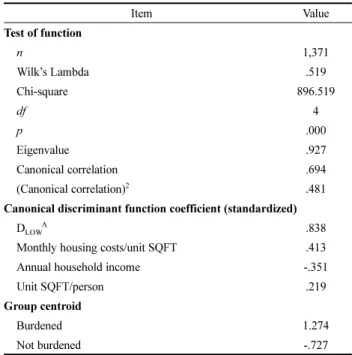
Among the independent variable included in the final stepwise models of discriminant analyses by household size, low-income status, monthly housing costs per unit SQFT, annual household income, and unit SQFT per person were found to have the strongest influences on prediction of households with housing cost burden regardless of the household size. It was examined to see if a singular discriminant model using these four most influential variables has the accuracy level to predict households with housing cost burden regardless of the household size similar to previous stepwise discriminant
models with more variables as presented in Table 10.
Enter method was used for variable entry to the new discriminant model.
Refer to <Table 11> for a new discriminant model with four most influential variables using all 1- to 2-person households. To see the squared canonical correlation, the new model was found to explain 48.1 percent of the variance in housing cost burden of one- to two-person households.
Actual housing cost burden (burdened, not burdened) and predicted discriminant membership of housing cost burden resulted from the new discriminant model were compared using cross-tabulations. As results, it was found that the new discriminant model with only four most influential variables were abel to predict 84.1 percent of single-person households with housing cost burden, and 77.8 percent of two-person households with housing cost burden correctly <Table 12>.
Table 10. Summary of Discriminant Analyses: Housing Cost Burden by Household Size and Tenure Type
Item
Household size All 1- to 2-person households 1 person 2 persons
Test of function
n 599 540 1,139
Wilk’s Lambda .557 .477 .522
Chi-square 346.709 396.023 736.414
df 8 7 7
p .000 .000 .000
Eigenvalue .794 1.098 .915
Canonical correlation .665 .723 .691
(Canonical correlation)2 .442 .523 .477 Canonical discriminant function coefficient (standardized)
DWDS - .166 -
DASIAN .163 - .089
Annual household income -.324 -.512 -.400
DLOW .924 .754 .854
DCCMSA .126 - -
DRENTER - .177 -
DSF .154 - -
Number of bedrooms - .331 .201
Persons/bedroom -.209 - -
Unit SQFT/person .188 .186 .184
Monthly housing costs/unit SQFT .360 .539 .414
Unit rating as a place to live - - .094
Group centroid
Burdened .959 1.648 1.223
Not burdened -.825 -.664 -.747
Classification accuracy
Burdened 84.1% 79.9% 81.5%
Not burdened 80.1% 88.8% 84.6%
Total 81.9% 86.3% 83.5%
Note. Dependent variable is housing cost burden (burdened, not burdened). Summary is based on a final stepwise model of each discriminant analysis by household size. Refer to <Table 9> for descriptions of the dummy variables.
Table 11. Discriminant Model with Top 4 Influential Variables
Item Value
Test of function
n 1,371
Wilk’s Lambda .519
Chi-square 896.519
df 4
p .000
Eigenvalue .927
Canonical correlation .694
(Canonical correlation)2 .481
Canonical discriminant function coefficient (standardized)
DLOWA .838
Monthly housing costs/unit SQFT .413
Annual household income -.351
Unit SQFT/person .219
Group centroid
Burdened 1.274
Not burdened -.727
Note. Dependent variable is housing cost burden (burdened, not burdened). The model is based on discriminant analysis with all one- to two-person households.
ALow-income household: Household with income below 80% of AMI
Table 12. Prediction Accuracy of New Discriminant Model with Top 4 Influential Variables by Household Size
Housing cost burden
Total Burdened Not burdened
1-person households 84.1% 79.5% 81.9%
2-person households 77.8% 88.8% 85.7%
All 1- to 2-person households 81.7% 84.7% 83.6%
Note. Percentages presented are percents of households predicted correctly within each household type using a new discriminant model generated with all 1- to 2-person households shown in <Table 11>.
The prediction accuracy was improved for single- person households and was somewhat reduced for two- person households using the previous discriminant models. Overall, prediction accuracy of one- to two- person households with housing cost burden stayed almost same with the new discriminant model. Thus, it would be more effective and efficient to use the new model with four most influential variables in predicting housing cost burden of young single- or two-person households in metropolitan areas than using more complicated models with more variables.
V. Conclusions
1. Summary and Implications
This study was conducted to explore housing characteristics of young single- or two-person households headed by young college graduates in the U.S.
metropolitan urban areas and determinants of their housing cost burden. This study used the 2011 AHS public-use microdata as secondary data. Major findings are summarized as follows:
(1) Majority of young single-person households were never married and majority of young two-person households were persons living with spouse or significant other;
(2) in comparison with larger households, young single- or two-person households were characterized to be headed by relatively younger householders, to have less income, and to have a greater proportion of households renting housing units and/or living in multifamily structures, which is consistent with findings from previous similar study with the 2009 AHS (Lee, 2012c);
(3) young single- or two-person households were also found to have a greater proportion of households living in central cities of MSA and/or in a smaller size units than households with three or more persons;
(4) housing costs of single- or two-person households were significantly less than households with three or more persons while housing costs per unit SQFT of single- or two-person households was significantly greater;
(5) regardless of the household size, there are many household headed by young college graduates paying too much of their income for housing, and single-person households were found to have the greatest housing cost burden; and
(6) a linear combination of low-income status, monthly housing costs per unit SQFT, annual household income, and unit SQFT per person was found to be
most efficient to predict single- or two-person households with housing cost burden.
There are a couple of implications to make based on the study findings. First, although single- or two-person households were found to live in smaller units than households with three or more persons, they were found to pay a greater housing costs per unit SQFT. Also, the housing costs per unit SQFT was one of the crucial predictors of households with housing cost burden.
Thus, when providing housing units targeting young single- or two-person households, especially rental units in central cities of metropolitan areas, it would be critical to lower per-SQFT costs as well to meet their affordability needs.
In general, however, it is typically known that a smaller-sized unit costs more per unit SQFT. In addition, when developing residential properties targeting young people in urban areas, it is hard to overlook proximity to public transportation system, work and diverse amenities, which usually is a major cause of relatively higher property value or rent under a regular housing market system. For the reasons, development of micro units (Johnston, 2013; Restuccia, 2014) with minimal in-home features and energy efficient systems or governmental rent subsidy would be some of the solutions to alleviate housing cost burden of young single- or two-person households in urban areas.
Second, considering the time of survey, some young households may have gotten to have housing cost burdens due to unexpected changes in household income or employment status of household members: Changes in full-time status or working hours, layoff, and so on.
However, some may suffer from housing cost burdens because they fail to consider their financial situation sufficiently before choosing their housing units. Thus, it would need to expand financial education opportunities targeting young people, especially those who plan to leave parents’ home, so that they can make more reasonable housing choices based on a realistic assessment of their current and future situation and housing needs, as well as housing market condition.
2. Limitations and Suggestions for Further Study
This study utilized public-use microdata of the AHS,
a national survey. Some of the greatest advantages to
use national survey data are a vast sample size and
representativeness of the sample examined and guaranteed,
which individual researchers are extremely difficult to
achieve with limited resource and manpower.
There are some drawbacks to use AHS as secondary data as it does not contain all information that every researcher expects, of course. Although the AHS is the most comprehensive nationwide housing survey in the United States that has been improved over decades, it is not tailored to every individual researchers’ needs. It would be beneficial to supplement such deficiencies in using national data with additional studies.
For example, when investigating young households’
housing cost burden, it is important to review sources and amount of fund coming from outside the household, especially family not in the household, to pay housing costs. AHS does include questions whether or not any person outside the household provided financial support or assistance, but does not contain the amount of external fund or the person’s relationship to the householder.
Also, it was impossible to tell young professionals from the variables included in the 2011 AHS as it does not include any information related to years since first full-time employment or final degree. Instead, age of householder, year of last move and reasons for the move were used as substitutive indicators to select similar groups of households in this study.
Thus, it is suggested for further study approaching young households’ housing cost burden to include source and amount of supportive fund to manage their housing costs and to use strict sampling criteria to aim the right target of the study. Also, it would be helpful to explore their perception of housing cost burden in addition to their actual housing cost burden to better understand their housing situation.
References
1. Ahn, M., Lee, S., & Parrott, K. (2013). Demographic and housing characteristics of Hispanic renters in the United States. Proceedings of the 2013 Annual Conference of the Housing Education and Research Association, 36-38.
2. Bae, B. (2013). A study on housing affordability of university student in Seoul. Unpublished Master's thesis, University of Seoul, Seoul.
3. Baek, D. (2008). A study on housing preferences of career beginners: Based on questionnaire survey in Seoul.
Unpublished Master's thesis, Konkuk University, Seoul.
4. Beer, A., Faulkner, D., Paris, C., & Clower, T. (2011).
Housing transitions through the life course: Aspirations, needs and policy. Portland, OR: The Policy Press.
5. Billari, F. C., Philipov, D., & Baizán, P. (2001). Leaving home in Europe: The experience of cohorts born around 1960. International Journal of Population Geography, 7, 339-356.
6. Deal, R. L. (2012). Residential satisfaction of the elderly:
Does perceived neighborhood safety matter? Unpublished Master's thesis, The University of Georgia, Athens, GA.
7. DeVaney, S. A., Chiremba, S., & Vincent, A. (2004). Life cycle stage and housing cost burden. Financial Counseling and Planning, 15(1), 31-39.
8. Hair, J. F., Anderson, R. E., Tatham, R. L., & Black, W. C.
(1998). Multivariate data analysis (5th Ed.). Upper Saddle River, NJ: Prantice Hall.
9. Harkness, J., & Newman, S. J. (2005). Housing affordability and children’s wellbeing: Evidence from the national survey of America’s families. Housing Policy Debate, 16(2), 223-255.
10. Johnston, S. (2013, November 13). Micro apartments offer small slice of city living. U.S. News & World Report.
Retrieved from http://money.usnews.com/money/personal- finance/articles/2013/11/15/micro-apartments-offer-small- slice-of-city-living
11. Joint Center for Housing Studies of Harvard University.
(2011). America’s rental housing: Meeting challenges, building on opportunities. Retrieved from http://www.jchs.
harvard.edu/sites/jchs.harvard.edu/files/
americasrentalhousing-2011.pdf
12. Joint Center for Housing Studies of Harvard University.
(2013). The state of the nation's housing 2013. Retrieved from http://www.jchs.harvard.edu/sites/jchs.harvard.edu/
files/son2013.pdf
13. Kwon, H. J., Hwang, E., & Beamish, J. O. (2013). A demographic profile of older adults' disabilities and housing accessibilities: The 2011 American Housing Survey.
Proceedings of the 2013 Annual Conference of the Housing Education and Research Association, 98-99.
14. Kwon, J. & Lee, E. (2013, July). 청년 주거빈곤 보고서. 제3 회 주거복지 컨퍼런스 발표자료.
15. Lee, H. (2012a). Influences on housing cost burden of the U.S. households by current and previous housing tenure types. International Journal of Human Ecology, 13(1), 129- 145.
16. Lee, H. (2012b). Post-college housing situation of young people in the United States and in Korea. Proceedings of the 2012 Annual Conference of the Housing Education and Research Association, 61-63.
17. Lee, H. (2012c). Housing cost burden of single- or two- person households in their 20s and 30s in the United States.
Journal of the Korean Housing Association, 23(2), 69-77.
18. McConnell, E. D., & Akresh, I. R. (2010). Housing cost burden and new lawful immigrants in the United States.
Population Research and Policy Review, 29, 143-171.
19. Mimura, Y. (2008). Housing cost burden, poverty status, and economic hardship among low-income families.
Journal of Family and Economic Issues, 29, 152-165.
20. Newman, S. J. (2008). Does housing matter for poor families? A critical summary of research and issues still to be resolved. Journal of Policy Analysis and Management, 27(4), 895 925.
21. Restuccia, P. (2014, January 22). Micro-units perfect fit for young pros. Boston Herald. http://bostonherald.com/business/
real_estate/2014/01/micro_units_perfect_fit_for_young_pros 22. Schwartz, A. F. (2010). Housing policy in the United States
(2nd Ed.). New York: Routledge.
23. U.S. Census Bureau. (n.d.a). American Housing Survey (AHS): AHS main. Retrieved from http://www.census.gov/
housing/ahs/
24. U.S. Census Bureau. (n.d.b). American Housing Survey (AHS): About the American Housing Survey (AHS).
Retrieved from http://www.census.gov/housing/ahs/about/
25. U.S. Census Bureau. (n.d.c). American Housing Survey (AHS): Methodology. Retrieved from http://www.census.
gov/housing/ahs/methodology/
26. U.S. Census Bureau. (n.d.d). Appendix B. Sample design and weighting. Retrieved from http://www.census.gov/
housing/ahs/files/Appendix%20B-National.pdf
27. U.S. Department of Housing and Urban Development.
(2011). Codebook for the American Housing Survey, public use file: 1977-2011. Retrieved from http://www.huduser.
org/portal/datasets/ahs/AHS_Codebook.pdf
접수일(2013. 11. 26) 게재확정일자(2014. 2. 10)