1. 서론
제조 기반에서의 데이터 분석이 기업 경쟁력 강화 및 현장의 애로사항을 해결할 수 있는 수단으로 떠오르고 있다. 이를 위해 빅데이터 기반의 제조 데이터 분석 소 프트웨어가 사용되고 있으며, 특히 IIoT라는 특성에 맞 게끔 이기종간의 4G, 5G데이터를 효율적으로 분석할 수 있는 Smart-Manufacturing 소프트웨어들이 점차 늘어나고 있다[1][3].
제조 기반 IIoT환경에서는 현장 데이터의 자동 패턴
인식 및 추출기술이 제공되는 소프트웨어를 사용하고 있다. 또한 기업 및 제조 상품 관련 웹/소셜 데이터 수 집 연계를 위한 빅데이터 수집 소프트웨어를 사용하고, 분석 결과를 체계적이고 직관적으로 정보를 확인하기 위해 의사결정지원과 데이터 시각화와 관련된 소프트웨 어를 사용 중에 있다[3][4].
이에 따라 기존에 사용되었던 일반 소프트웨어 품질 측정 방안이 IIoT와 빅데이터, 신규 통신망 기술에 맞 는 형태로 변화되어야 하며, 특히 제조 현장의 이해에 맞는 형태로 변화하여야 한다. 즉 기존의 ISO/IEC
제조 기반 IIoT 환경에서 데이터 분석 소프트웨어의 품질 평가를 위한 모델
최종석*, 신용태**
Model for Quality Assessment of Data Analytics Software in Manufacturing-Based IIoT Environments
Jongseok Choi*, Yongtae Shin**
요 약 IT기술의 발달로 제조 기반의 IIoT환경을 기반으로 한 데이터 마이닝 형태의 소프트웨어들이 점차 늘어나고 있 다. 그러나 빅데이터 및 데이터마이닝을 진행해야 하는 대량의 데이터를 가지는 제조 기업의 소프트웨어 특성상 일반 소 프트웨어와 동일한 형태로 소프트웨어 품질을 평가하기 힘든 실정이다. 또한 이기종간의 장비 및 소프트웨어가 혼재된 제 조 기반의 환경에서 특히 기존의 품질 특성을 적용하여 사용되는 소프트웨어에 대한 품질 판단을 진행하기 어렵다. 본 논문에서는 제조 기반의 특성을 조사하고 이에 맞는 소프트웨어 품질 평가 모델을 개발하여 평가를 실시하고자 한다.
Abstract A form of data mining software, based on manufacturing-based IIoT environment with the development of IT technologies are increasingly growing. However, it is difficult to evaluate the software quality in the same form as general software due to the characteristics of the software of a manufacturing company that has a large amount of data that needs to be carried out with big data and data mining. In addition, in a manufacturing-based environment where heterogeneous equipment and software are mixed, it is difficult to perform quality judgment on software used by applying existing quality characteristics. Therefore, in this paper, the characteristics of the manufacturing base are investigated, and a software quality evaluation model suitable for it is developed and evaluated.
Key Words : IIoT, Software Quality, Big-data Software, Data Analytics, Quality Assessment
*Spartan Software Education Institute, Soongsil University ([email protected])
**Corresponding Author : School of Computing, Soongsil University ([email protected])
Received August 13, 2021 Revised August 14, 2021 Accepted August 21, 2021
25010기반의 품질 평가의 기준을 최대한 충족함과 동 시에 제조현장과 IIoT의 특성을 반영한 생산, 설비등에 서의 소프트웨어 품질 평가 방안이 필요하다.
이를 위하여 본 논문에서는 제조 기반의 시스템 및 제조 현장의 소프트웨어에 대하여 분석을 진행하고, 기 존 ISO/IEC 25010의 품질 특성을 분석하고 이에 대한 부특성을 재 정의하여 제조 기반 IIoT 환경에서 데이터 분석 소프트웨어에 대한 품질 분석 방안에 대한 모델을 제안하고 이를 통해 실제 설비공정에서의 소프트웨어 품질 평가 결과 도출을 통해 제안 모델의 효용성을 확 인하고자 한다.
2. 관련연구
2.1 제조 기반 IIoT 환경에서의 소프트웨어 제조 현장의 경우 기업이 쉽게 적용할 수 있는 실용 적이고 유연한 Smart-Manufacturing 소프트웨어를 도입하고 있다. 특히 아래 <표 1>과 같은 이유로 정확 하고, 신뢰할 수 있는 Smart-Manufacturing 소프트 웨어를 도입하고자 한다[1].
표 1. 제조 현장에서의 문제점
Table 1. Problems on the Manufacturing site Problems
Many situations where the MES system has not been introduced
Field data is unstructured, not stored
In most cases, field handwritten data and Excel data are used to manage indicators and perform analysis
Poor management of indicators such as production, facility operation, quality, cost, and inspection Inconsistency of market and customer needs due to non-interworking with external data of the company
Manual data analysis and decision making Identification of faulty factors, the identification of anomalies is unclear
Difficulty in analyzing operation rate, yield, quality, etc. by process
Difficulty supporting managerial decision making Lack of IT experts and budget and difficulty in investment
특히, IT Smart-Manufacturing 관련 소프트웨어 를 도입하고자 하는 이유 중의 대부분이 수작업에 의한
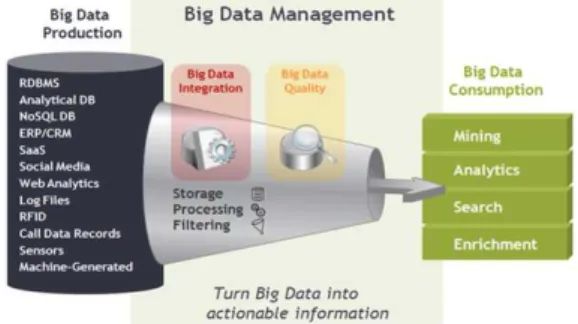
데이터 분석과 의사결정에 대한 문제와 생산, 설비가동, 품질, 원가, 검사 등의 지표 관리의 부실을 예방하고자 함이다[2]. 또한 공정별 가동율, 수율, 품질 등의 분석을 위해서 소프트웨어를 도입하고자 하는데, 이는 주로 데 이터의 상호운용 및 연결, 신뢰성이 기반이 되는 <그림 1>과 같은 빅데이터 분석 형태의 소프트웨어를 도입하고 자 한다.
그림 1. 제조 기업이 도입하고자 하는 SW의 형태 Fig. 1. The type of software that a manufacturing company wants to introduce
데이터적 측면에서는 텍스트 형태의 데이터 관리 및 가공과 MIS/ERP(Management Information System/
Enterprise Resource Planning) 정형 데이터, Excel 수기 데이터, 설비 및 장치의 로그 데이터가 관리되고, 가공될 수 있기를 원하며, 수집/분석 시 IT전문가의 부 재로 인해 ETL이나 데이터 위자드 형태로의 활용을 원 하고 있다[7]. 이를 통해 실용적인 활용 시 고객/시장의 반응을 분석하고 다양한 데이터를 분석할 수 있으며, 데이터 연관관계 분석과 함께 시각화 및 분석 모델로 의사결정 지원을 수행할 수 있는 소프트웨어를 도입하 고자 한다[8].
2.2 ISO/IEC 25010
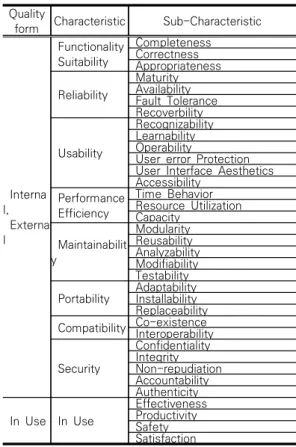
ISO/IEC 25010은 <표 2>와 같이 소프트웨어 내부 및 외부의 품질 특성을 주특성과 부특성으로 나누어 제 공하고 사용품질의 지표를 제공한다[3][4]. 주특성은 품 질요소를 명시적으로 나타낼 수 있는 기준이며, 부특성 은 주 특성을 상세히 나누어 명시하기 위한 기준을 말 한다.
표 2. ISO/IEC 25010의 특성과 부특성
Table 2. Characteristics and sub-characteristics of ISO/IEC 25010
기능 적합성은 제품이 사용될 때, 요구를 충족시킬 수 있는 기능의 제공 정도를 나타내고, 수행 요율성은 조건에서 자원의 양에 따른 성능 지표를 나타낸다. 호 환성은 동일한 환경을 공유하면서 필요한 기능을 수행 할 수 있는 정도로서 운영 측면에서 가장 필요한 특성 으로 분류될 수 있다. 사용성은 소프트웨어의 만족을 달성하는 정도로 제품이 사용자에 의해 유효하고 효율 성 있게 사용됨을 측정할 수 있고, 신뢰성을 통해 명시 된 기간과 조건에서 기능이 유지됨을 측정할 수 있다.
보안성과 유지보수성은 제품이 데이터를 보호하는 정도 를 측정하고 의도된 대로 변경할 수 있는 정도를 측정 하며, 이식성은 다양한 환경으로의 적합도를 측정할 수 있다[5][6].
3. 제안하는 품질 평가 모델 3.1 제조 기반 IIoT 환경 SW 품질 매트릭 제조 기반 IIoT환경에서의 현장 특성상 설계 단계 및 개발과 함께 테스트 관련자 및 개발자가 소프트웨어 의 품질을 평가할 수 있는 형태가 아니기 때문에 품질 특성의 매트릭 중 사용 품질 매트릭 기반으로 측정을 진행하여야 한다.[9] 특히 소프트웨어 자체의 품질이 아 닌 사용한 결과 관점에서 측정되어야 하며, 사용자의 작업 시나리오 내에서 품질을 확인해야 현장에서 가장 밀접하게 사용 가능한 소프트웨어를 선정할 수 있다.
다만, 사용 품질의 특성상 4가지의 부특성만을 가짐으 로 명확한 평가가 어려움에 따라 외부 품질의 일부 특 성을 재구성하여 품질 측정의 성능을 증대시켜야 한다.
그러나 너무 많은 품질 측정을 위한 특성을 평가 요소 로 재구성 및 사용할 경우, IIoT 및 제조 환경의 주요 평가 목적을 벗어나 과도한 품질 측정에 따른 오용 또 는 문제를 일으킬 수 있다.[10] 따라서 비 IT 전문가 도 수행 가능한 최소한의 품질 측정 모델을 개발하는 것이 필요하다
표 3. 제조 기반 IIoT 환경 SW매트릭
Table 3. Manufacturing-based IIoT environment SW metrics
<표 3>과 같이 제조 기반 IIoT 환경에서 품질 평가 에 사용할 수 있는 SW매트릭을 구성하였다. 제안한 제 조기반 IIoT 환경 SW 매트릭에서 기능성은 기능에 대 한 소프트웨어 제품의 능력을 평가할 수 있도록 하였다.
사용성은 소프트웨어에 영향을 받는 운영자, 사용자, 간 접사용자들이 소프트웨어를 사용 시 실제 사용 항태를 만족하는 평가 요소를 나타낼 수 있게 하였다. 기능성 과 사용성은 ISO/IEC 25040을 근간으로 위 매트릭을 Quality
form Characteristic Sub-Characteristic
Interna l,
Externa l
Functionality Suitability
Completeness Correctness Appropriateness Reliability
Maturity Availability Fault Tolerance Recoverbility
Usability
Recognizability Learnability Operability
User error Protection User Interface Aesthetics Accessibility
Performance Efficiency
Time Behavior Resource Utilization Capacity
Maintainabilit y
Modularity Reusability Analyzability Modifiability Testability Portability Adaptability
Installability Replaceability Compatibility Co-existence Interoperability
Security
Confidentiality Integrity Non-repudiation Accountability Authenticity In Use In Use
Effectiveness Productivity Safety Satisfaction
Characteristic Sub-Characteristic Matric code Functionality
Suitability F01
Accuracy F02
Security F03
Usability
Understandability U01
Operability U02
Learnability U03
Performance Efficiency
Time behaviour E01 Resource utilization E02 Maintainability
Recoverability
Analyzability M01
Stability M02
통해 기술의 품질을 평가할 때, 최소한의 명세를 작성 하고 평가를 진행할 수 있는 형태로 모델을 개발하였다.
소프트웨어의 수정 및 변경의 용이함을 나타낼 수 있 는 유지보수성의 경우 유사하게 나타날 수 있는 신뢰성, 이식성의 특성을 혼합하여 아래와 같이 재생성 하였으 며, 적절한 자원의 사용과 적정한 반응시간의 정도를 측정하기 위하여 효율성을 사용하였다. 또한, 기존의 내 용 중 제품 혹은 내부 변수, 용량, 대역폭 등의 전문 지 식을 활용하여 측정하여야 하는 시험가능성, 기억용량, 접근성, 사용자 오류보호는 제조 기반 하드웨어의 특성 상 수치화하거나 확인하기 어렵고, IT관련 비전문가가 활용하기 힘든 부분임에 따라 제외하였다. 정보보호 측 면을 나타내는 부인방지, 인증성, 무결성, 책임성 또한 일반 센서와 기계적 하드웨어가 대부분을 차지하는 제 조의 특성에 따라 제거하였다.
기능성숙도 및 사용자 인터페이스 미학은 측정하려 는 기능이 해당하는 모든 목적을 만족하는지의 여부를 판단하기 힘들고 디자인적인 요소에 관련된 사항을 표 현하고 있어 제조의 특성에 따라 제거하였다.
3.2 품질 측정 상세 방안
품질 측정을 위한 상세 매트릭의 경우 각 목적과 측 정항목, 측정을 위한 계산식으로 나타 낼 수 있으며, 모 든 계산에 대한 결과 영역은 0 ≤ X ≤ 1으로 나타낼 수 있다.
3.2.1 기능성의 상세
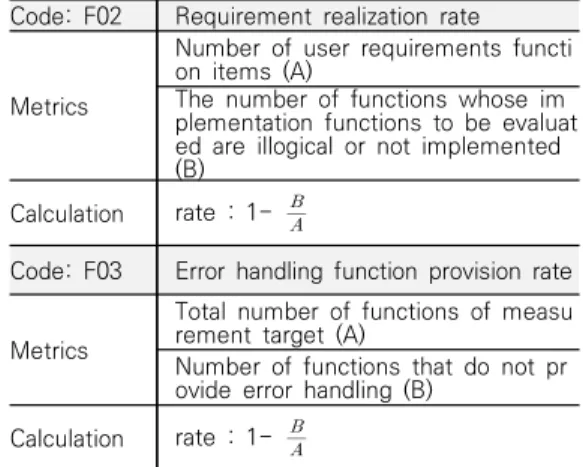
기능성의 부특성으로는 <표 4>와 같이 적절성, 정확 성, 보안성이 있으며, 요구사항 반영률과 요구사항 실현 율, 오류처리기능의 제공률로 나타낼 수 있다.
표 4. 기능성의 상세
Table 4. Detail of Functionality
3.2.2 사용성의 상세
사용성은 <표 5>와 같이 특정한 행동 하에서 사용자 가 소프트웨어에 대하여 습득하고 사용할 수 있는 능력 을 측정한 지표로 이해용이성, 운영성, 학습성으로 표현 된다. 또한 표현된 각각은 화면구성요소의 적정도와 일 관률로 아래와 같이 계산될 수 있다.
표 5. 사용성의 상세 Table 5. Detail of Usability
Code: F01 Requirement reflection rate
Metrics
Number of items in total user requir ements (A)
Number of items of user requireme nts not reflected in any function (B) Calculation rate : 1-
Code: F02 Requirement realization rate
Metrics
Number of user requirements functi on items (A)
The number of functions whose im plementation functions to be evaluat ed are illogical or not implemented (B)
Calculation rate : 1-
Code: F03 Error handling function provision rate
Metrics
Total number of functions of measu rement target (A)
Number of functions that do not pr ovide error handling (B)
Calculation rate : 1-
Code: U01 Screen Element Adequacy
Metric s
1 Total number of screens displayed i n the I/O screen list
2 Identification of screens with inappr opriate functions in the input/output screen design
3 Identifies screens that contain items that do not fit the name of each sc reen
4
Identifies the screen where each m enu name on the menu screen doe s not match the function performed on the screen
5 Identifies screens with missing or u nnecessary items in the name of ea ch screen
6 Number of screens that do not fit a ll 2, 3, 4, 5
Calculation
① When the input/output screen list and the design document correspon d 1:1
Screen Element Adequacy (X) = 1-
② If ① does not apply, count the nu mber of screens that are not imple mented and that violate the content s of 6)
Screen Element Adequacy (X) = 1-
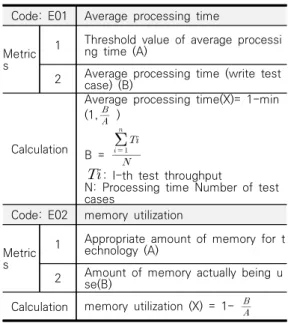
3.2.3 효율성의 상세
효율성은 [표 6]과 같이 시간반응성과 자원효율성으 로 부특성을 나타낼 수 있고 각각은 평균처리시간과 메 모리 사용율로 계산될 수 있다.
표 6. 효율성의 상세
Table 6. Detail of Performance Efficiency
3.2.4 유지보수 및 신뢰성의 상세
유지보수 및 신뢰성은 <표 7>과 같이 분석성과 안정 성을 부특성으로 가지고 각각 소프트웨어 결함의 분석 성과 결함 발생률을 가진다.
표 7. 유지보수 및 신뢰성의 상세 Table 7. Detail of Maintainability and
Recoverability
위 특성들은 모두 품질 측정 항목을 바탕으로 품질을 계산할 수 있다. 이는 특성별 결과 값의 합산으로 나타 Code: U02 Screen component consistency
Metric s
1 Total number of screens displayed o n the input/output screen list (A) 2 Identifies screens with inconsistent
sequence of function keys
3
Identifies the screen where different item names are given to the same i tem or the same item name is assi gned to different items
4 Identifies a screen with a different screen name from the menu name on the menu screen
5 Identifies a screen that does not au tomatically output data of other func tions or cannot select input 6 Number of screens that do not fit a
ll 2, 3, 4, 5 (B)
Calculation
① When the input/output screen list and the input/output screen design correspond 1:1
Screen Element Consistency(X)= 1-
② If ① does not apply, count the nu mber of screens that are not imple mented and that violate the content s of 6)
Screen Element Consistency(X)= 1-
Code: U03 Screen output method consistency
Metric s
1 Total number of screens displayed o n the input/output screen list (A) 2 Identifies screens that do not break
information and have the same sorti ng method
3
Identifies a screen with consistent c ontents (screen format, message) o utput to the system for each functi on performed by the user
4 Number of screens that satisfy both 2 and 3 (B)
Calculation
① When the input/output screen list and the execution screen design cor respond 1:1
Consistency of screen output metho d (X) = 1-
② If ① does not apply, count the nu mber of screens that are not imple mented and that violate the content s of 4)
Consistency of screen output metho d (X) = 1-
Code: E01 Average processing time
Metric s
1 Threshold value of average processi ng time (A)
2 Average processing time (write test case) (B)
Calculation
Average processing time(X)= 1-min (1, )
B =
: I-th test throughput
N: Processing time Number of test cases
Code: E02 memory utilization
Metric s
1 Appropriate amount of memory for t echnology (A)
2 Amount of memory actually being u se(B)
Calculation memory utilization (X) = 1-
Code: M01 software defect analysis
Metric s
1 Number of undeterminable errors a mong errors that occurred during a certain period (A)
2 Total number of software errors that occurred over a period of time (B) Calculation Analystability (X) = 1-
Code: M02 Defect rate
Metric s
1 Number of errors that occurred duri ng a certain period of time (B) 2 Total number of software errors ove
r a period of time (A) Calculation Defect Rate (X) =
내지며, 계산식은 아래와 같다.
식 :
× ×
· i : 품질 특성
· j : 품질특성에 포함된 매트릭
· MV(i,j) : 품질 특성별 측정 결과
· N(i) : 품질 특성별 적용된 매트릭 수
· W(i) : 전체 매트릭 중 해당 특성의 비율
· Q(i) : 특성별 결과 값
· : 기술의 총 특성 결과 값
4. 성능평가 4.1 품질모델 평가의 기준
품질 모델에 대한 평가는 충분한 실무 연관성을 가지 기 위해 평가 항목별 매트릭을 기반으로 실제 테스트케 이스를 수행하여 결과를 기술하고, 이 기술된 결과를 바탕으로 이 품질 평가의 수준을 수용할 것인지 판단하 여야 한다. 이 단계에서 제안하는 품질 모델의 실용성 과 계산성, 설득력, 명료성, 구성단위 일관성을 판단하 여야 한다.
명료성은 매트릭의 결과가 모호하지 않아야 함을 나 타내는 측도로써 본 논문에서의 결과 영역은 수치화되 어 나타내어짐에 따라 추가로 판단하지 않으며, 구성단 위의 일관성은 각 특성 결과 및 가변치에 대한 기준을 0 ≤ X ≤ 1로 하여 측정에 문제가 없는 단위를 사용한 것으로 볼 수 있다.
4.2 품질모델 평가를 위한 분석 4.2.1 테스트 케이스를 통한 분석
품질평가가 실제 소프트웨어에서 적용가능한 부분인 지를 판단하는 실용성과 계산성을 확인하기 위해 현장 의 실제 소프트웨어를 통해 품질 평가를 진행하였다.
<그림 2>와 같이 제조 현장에서 사용되는 케이스로 제조 공정에 대한 관리 및 분석 소프트웨어인 MIR Solution을 기반으로 품질 평가를 진행하였다.
그림 2. 품질평가를 진행한 실무 현장 소프트웨어
Fig. 2. Practical field software with quality evaluation
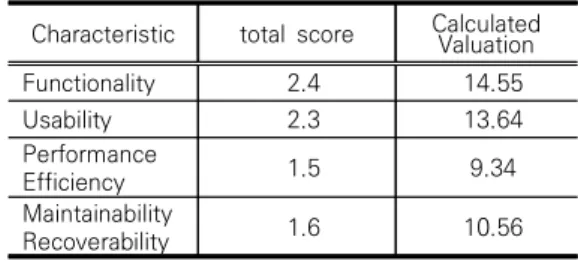
소프트웨어 품질 평가를 표준에 입각한 환경으로 진 행하기 위하여 소프트웨어가 품질 특성을 충족하는지 평가하는 기준인 ISO/IEC 25040[6]을 기반으로 평가 설정 및 단계별 진행을 수행하여 평가가 정상적으로 이 루어 질 수 있음을 확인하였다. <표 8>은 이러한 품질 평가의 결과로 실제 매트릭의 계산성이 가능함을 확인 할 수 있었으며, <표 9>로의 합계 및 품질측정 최종 결 과에 따라 각각의 특성 간 판단의 가치가 수치로 평가 될 수 있음을 확인하였다.
표 8. 품질 평가 결과
Table 8. Quality evaluation result
표 9. 특성별 품질평가 계산 결과
Table 9. Calculation result of quality evaluation for each characteristic
Characteristic total score Calculated Valuation
Functionality 2.4 14.55
Usability 2.3 13.64
Performance
Efficiency 1.5 9.34
Maintainability
Recoverability 1.6 10.56
Characteristic Sub-Characteristic Score Functionality
Suitability 0.9
Accuracy 0.8
Security 0.7
Usability
Understandability 0.8
Operability 0.7
Learnability 0.8
Performance Efficiency
Time behaviour 0.9
Resource utilization 0.6 Maintainability
Recoverability
Analyzability 0.8
Stability 0.8
4.2.2 품질 측정 신뢰성 분석
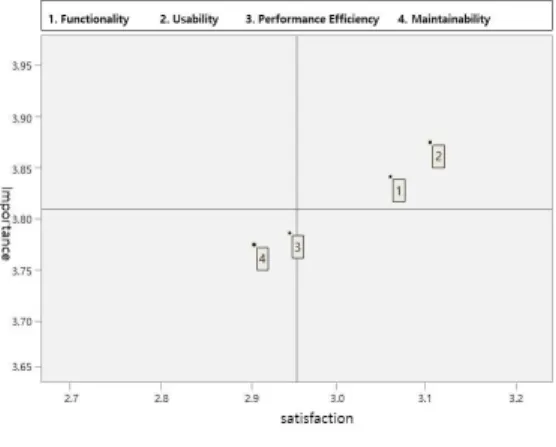
품질 측정 결과에 대한 만족도를 신뢰적으로 판단하 기 위하여 품질 측정을 진행한 사용자들의 수용도를 분 석하였다. 판단을 위한 인원은 품질 평가를 진행한 인 원 중 소프트웨어의 운영자 15명과 간접사용자 5명을 대상으로 실시하였다. 분석은 각각의 매트릭 특성들에 대하여 각 항목별로 중요도와 만족도를 조사하고, 조사 한 데이터를 통합하여 속성을 표기하고 각 속성들의 중 요도와 만족도를 기준으로 분석을 실시하였다. 신뢰도 분석에 필요한 검증은 Cronbach’ α 검증으로 수행하 였으며 타당성 분석을 위한 대응표본은 유의수준을 p<0.07 수준으로 진행하였다. 이에 따라 중요도와 만족 도의 평균은 0.84, 표준편차는 0.06 표준오차평균은 0.249, 95%신뢰구간에서의 하한과 상한의 차는 0.234, T의 결과 33.75, df 5, 유의수준 0.00으로 특 성 요인에 대한 수준에서 검증에 문제가 없음을 확인하 였다. 이러한 결과에 따라 중요도의 순위 분석은 <그림 3>과 같이 사용성, 기능성, 효율성, 유지보수성 순으로 확인되었으며 만족도 조사에서도 동일한 결과로 확인되 었다. 사용성과 기능성은 모두 만족도와 중요성측면에 서 충분한 품질 특성을 가지고 있는 것으로 확인되었지 만, 효율성과 유지보수성은 일부 보완이 필요한 것으로 판단되었다.
그림 3. 특성의 중요도와 만족도 분석
Fig. 3. Analysis of the importance and satisfaction of characteristics
5. 결론
본 논문에서는 제조 현장에 맞는 소프트웨어의 경우 기존 소프트웨어와는 다른 형태로 소프트웨어의 품질을 측정해야 함을 확인하였고, 이를 위한 품질 모델을 제 안하였다. 제안된 품질 모델은 각 품질을 실제 환경에 맞는 형태로 테스트케이스를 통해 분석하였으며, 특성 에 대한 중요도 평가를 실시하였다. 이를 통해 제조 기 업의 소프트웨어에서 충분한 품질 특성을 가지는 것으 로 판단되었다. 다만 성능평가 시 효율성과 유지보수성 이 일부 낮은 결과를 보였으나, 이는 부특성 중 평균처 리시간 및 결함 분석성에서 장시간 동안 SW품질에 대 한 테스트가 불가능하여 나타나게 된 결과로서 향후 장 시간의 품질 테스트를 통해 결과를 보완하여 특성의 표 본 오류를 줄일 수 있을 것으로 판단된다. 추가적으로 사후 유지에 관련된 사항 및 대체 솔루션 도입 시 평가 방안, 제조기업 특성에 맞는 경영 이슈, 지능형 시스템 에 대하여 고려된 품질 평가 모델을 구성한다면 소프트 웨어 품질 평가에 대한 기준을 향상 시킬 수 있을 것으 로 예상된다.
REFERENCES
[1] S. Oh, H. La and S. Kim, “Method to Evaluate and Enhance Reusability of Cloud Services”, KIPS Transactions on Computer and Communication Systems, vol.19, no.1, pp. 49-62, Nov, 2012
[2] J. Lee, J. Choi and J. Park, “A Practical Quality Evaluation Model of Mobile Cloud Software”, The Journal of Korean Institute of Information Technology, Vol. 13, No. 3, pp.
95-110, Mar. 2015
[3] J. Lee and S. Park, “The Relationship of the Impact of Production Process Integration on Logistics Stabilization and Inventory Management”, Korean Computers and Accounting Review, Vol. 19, No. 1, pp.
69-97, Jun, 2021
[4] N. Lee, S. Lee and H. Shin, “Value Creation of Servitization : A Focus on the Mediating Effect of Operational Performance”, Journal of the Korean Operations Research and
Management Science Society, Vol. 45, No. 1, pp. 39-59, Dec, 2019
[5] ISO/IEC 25010, “Systems and software engineering - Systems and software Quality Requirements and Evaluation - System and software quality models”, ISO/IEC JTC 1/ SC 7, Mar, 2011
[6] ISO/IEC 25040, “Systems and software engineering - Systems and software Quality Requirements and Evaluation - Evaluation process”, ISO/IEC JTC 1/ SC 7, Mar, 2011 [7] M. A. Cusumano, S. J. Kahl and F. F. Suarez,
“Services, industry evolution, and the competitive strategies of product firms”, Strategic Management Journal, Vol 36, pp.
559-575, Jan, 2014
[8] Y. Seo and S. Chae, “A study of appropriateness evaluation method for quality activity management of Software R&D Project”, Journal of Digital Convergence, Vol.13, No.8, pp. 91-99, Jul, 2015
[9] S. M. Jung, “Design of Software Quality Evaluation Model for IoT”, Journal of the Korea Institute of Information and Communication Engineering, Vol. 20, No. 7, pp. 1342-1354, Jul, 2016
[10] M. Kim, N. Lee and J. Park, “A Quality Evaluation Model for IoT Services”, KIPS Transactions on Computer and Communication Systems, Vol. 5, No. 9, pp.
269-274, Aug, 2016,
저자약력
최 종 석(Jongseok Choi) [정회원]
• 2013.03 ~ 2015. 02 숭실대학교 박사수료
• 2019. 10 ~ 현재 ㈜공감하다 대표
• 2020. 09 ~ 현재
숭실대학교 스파르탄SW교육원 교수
<관심분야> 빅데이터, IoT, 데이터분석, 무선통신
신 용 태(Yongtae Shin) [비회원]
• 1994 Unviersity of Iowa Computer Science 공학박사
• 1995. 03 ~ 현재 숭실대학교 컴퓨터학부 교수
• 2018. 03 ~ 현재
숭실대학교 스파르탄SW교육원 원장
<관심분야> 인공지능, 데이터분석, 무선통신, IoT